Abstract
To obtain quantitative information on the size and dynamics of unfolded proteins we combined single-molecule lifetime and intensity FRET measurements with molecular simulations. We compared the unfolded states of the 64-residue, α/β protein L and the 66-residue, all-β cold-shock protein CspTm. The average radius of gyration (Rg) calculated from FRET data on freely diffusing molecules was identical for the two unfolded proteins at guanidinium chloride concentrations >3 M, and the FRET-derived Rg of protein L agreed well with the Rg previously measured by equilibrium small-angle x-ray scattering. As the denaturant concentration was lowered, the mean FRET efficiency of the unfolded subpopulation increased, signaling collapse of the polypeptide chain, with protein L being slightly more compact than CspTm. A decrease in Rg with decreasing denaturant was also observed in all-atom molecular dynamics calculations in explicit water/urea solvent, and Langevin simulations of a simplified representation of the polypeptide suggest that collapse can result from either increased interresidue attraction or decreased excluded volume. In contrast to both the FRET and simulation results, previous time-resolved small-angle x-ray scattering experiments showed no collapse for protein L. Analysis of the donor fluorescence decay of the unfolded subpopulation of both proteins gives information about the end-to-end chain distribution and suggests that chain dynamics is slow compared with the donor life-time of ≈2 ns, whereas the bin-size independence of the small excess width above the shot noise for the FRET efficiency distributions may result from incomplete conformational averaging on even the 1-ms time scale.
Keywords: molecular dynamics, protein folding, denatured protein, small-angle x-ray scattering, radius of gyration
The role of the structure and dynamics of the unfolded states of proteins in determining the kinetics and mechanisms of protein folding is a relatively unexplored area. At high concentrations of chemical denaturants, unfolded proteins behave like random-coil homopolymers, and the average radius of gyration (Rg) depends only on the length of the polypeptide chain (1). However, at low denaturant concentrations where proteins fold and sequence matters, evidence for specific structure in the unfolded state has been observed for several proteins (2–4). Several experimental studies, moreover, suggest that native-like structure in the unfolded state may play an important role in the folding mechanism (5–7).
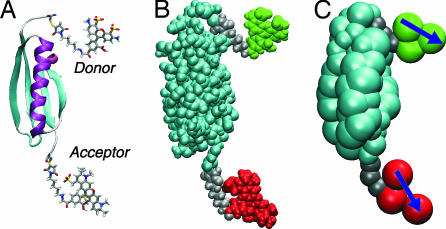
Single-molecule FRET is well suited to investigate the structure and dynamics of unfolded proteins (8–14) because, unlike ensemble studies, it can resolve the folded and unfolded subpopulations in low denaturant regimes and also reveal information on structural distributions. Although single-molecule FRET has been mostly used in qualitative structural studies, quantitative distance information has been obtained for DNA (15, 16) and polyproline (17). In the case of unfolded proteins, quantitative FRET analysis is complicated by the wide range of end-to-end distances, chain dynamics, and the presence of large fluorescent dye labels. Here we demonstrate the quantitative applicability of single-molecule FRET measurements to unfolded proteins using intensity and life-time measurements in combination with molecular simulations for two well characterized two-state proteins, the 64-residue α/β protein L (Fig. 1) and the 66-residue all-β cold-shock protein CspTm (18–23). The size distribution of the unfolded state was determined for both proteins, and for protein L it was compared with equilibrium and time-resolved small-angle x-ray scattering (SAXS) experiments (1, 20). The donor fluorescence decays and FRET efficiency distribution widths were analyzed to extract dynamical information on the unfolded protein chain on the nanosecond and millisecond time scales, respectively. Finally, simulations using both simplified and all-atom protein models were used throughout this study to justify the analysis and to support and interpret the results.†
Fig. 1.
Structures of dye-labeled protein L. (A) Cartoon. (B) Space-filled heavy atoms. (C) Bead model used in Langevin simulations.
Results
Uncorrected FRET Efficiency Histograms.
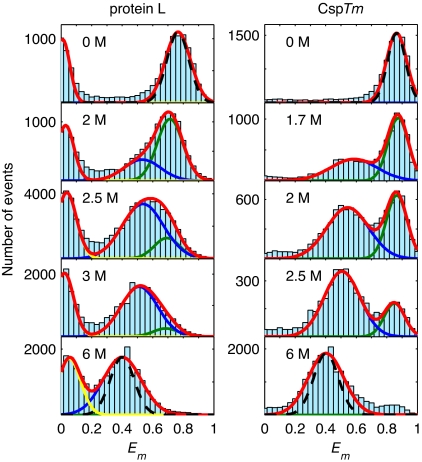
Fluorescent bursts of photons were observed as single protein molecules labeled with FRET donor and acceptor dyes diffused freely through the detection volume of a confocal microscope. A pulsed laser excitation system coupled with time-correlated single-photon counting electronics recorded the arrival time and fluorescence delay of each photon (see Materials and Methods), yielding both intensity and life-time information. A burst has a measured FRET efficiency Em defined as Em = (nA − nDl)/(nA + nD), where nD and nA are the number of donor and acceptor photons in a burst and l is the probability of donor photons leaking into the acceptor channel. Histograms of FRET efficiencies of fluorescent bursts are shown in Fig. 2 for protein L and CspTm at selected denaturant concentrations. The peaks at high efficiency (0.78 for protein L and 0.85 for CspTm) correspond to folded protein molecules. As the denaturant concentration is increased, new peaks, corresponding to unfolded protein molecules, appear with mean efficiencies 〈Em〉 near 0.6 that grow in amplitude relative to the folded peaks. Above 3 M GdmCl, only the unfolded peak remains [denaturation midpoints from ensemble FRET for dye-labeled proteins in GdmCl: CspTm, 2.0 M GdmCl (10); protein L, 2.6 M GdmCl (data not shown)].‡ The peak at zero efficiency for protein L arises from protein molecules lacking an active acceptor dye; this peak is absent in the purer CspTm sample. The mean FRET efficiencies (see Materials and Methods for fitting procedure) of the unfolded states in both protein L and CspTm continuously decrease with increasing denaturant concentration, suggesting an increase in the average end-to-end distance.
Fig. 2.
FRET efficiency histograms for protein L (Left) and CspTm (Right) for several denaturant concentrations. The peaks at high and intermediate Em correspond to the folded and unfolded state populations, respectively. The green and blue lines are Gaussian fits to the folded and unfolded subpopulations. Molecules lacking an active acceptor (yellow) appear at Em ≈ 0. The Poissonian shot-noise contribution (29) to the folded and unfolded peak widths (black dashed lines) is shown at 0 M and 6 M GdmCl.
Calculating Accurate Mean FRET Efficiencies.
Before the measured 〈Em〉 for unfolded states can be converted to average interdye distances, it must be corrected to account for the different detection efficiencies of each dye because of differences in the dye quantum yields, detector quantum efficiencies, and optical beam path transmissivities. The correction factor γ relates the measured mean FRET efficiency 〈Em〉 to the true mean FRET efficiency 〈E〉, where 〈E〉 = 〈nA〉/(〈nA〉 + γ〈nD〉) = 〈Em〉/[〈Em〉 + γ(1 − 〈Em〉)] ≈ 〈nA/(nA + γnD)〉. In principle, γ may be determined by measuring the absolute quantum yields, detector efficiencies, and transmissivities for each dye, which is difficult and error-prone, or by employing alternating laser excitation of the donor and acceptor (24). However, γ can also be simply and more accurately obtained by equating the FRET efficiency defined by using donor lifetimes with the FRET efficiency defined by using donor and acceptor intensities:
where τDA and τD are donor dye life-times (for single exponential emission decays) in the presence and absence of the acceptor. Donor life-times in the presence (τDA = 1.01 ± 0.03) and absence (τD = 3.78 ± 0.04) of the acceptor dye for the folded state of protein L at 0 M GdmCl determined from the folded and zero efficiency peaks in the FRET histogram give 〈E〉 = 0.74 ± 0.02 and γ = 1.28 ± 0.01. Relative quantum yields and transmissivities at 0, 1, 1.5, 2, 3, 4, and 6 M GdmCl were used to determine γ at these concentrations and to interpolate γ between these concentrations for protein L.
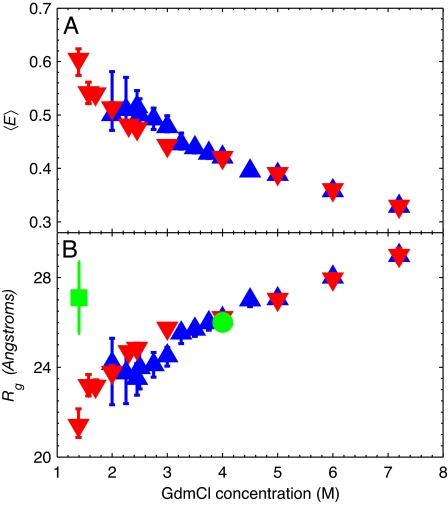
In CspTm, τDA at 0 M denaturant is on the order of the time resolution of the life-time measurement, which greatly increases the error in γ. However, the quantum yields (based on a comparison of donor and acceptor dye life-times in the labeled proteins) and spectral characteristics for each dye appear to be the same for protein L and CspTm. We therefore assume that the denaturant-dependent γ corrections for the two proteins are the same. The γ-corrected mean FRET efficiencies 〈E〉 for the unfolded state of each protein as a function of denaturant are shown in Fig. 3A.
Fig. 3.
Dependence of FRET efficiency and Rg on denaturant concentration. (A) Mean FRET efficiencies 〈E〉 for the unfolded states of protein L (blue triangles) and CspTm (red inverted triangles) after γ correction. (B) Rg for protein L and CspTm in the unfolded state determined from 〈E〉 assuming slow chain dynamics and a Gaussian chain model for the end-to-end distribution. The Rg values previously determined by equilibrium SAXS at 4 M GdmCl (green circle) and by time-resolved SAXS at 1.4 M GdmCl (green square) are also shown (20).
Langevin Simulations Using a Simplified Representation of the Protein.
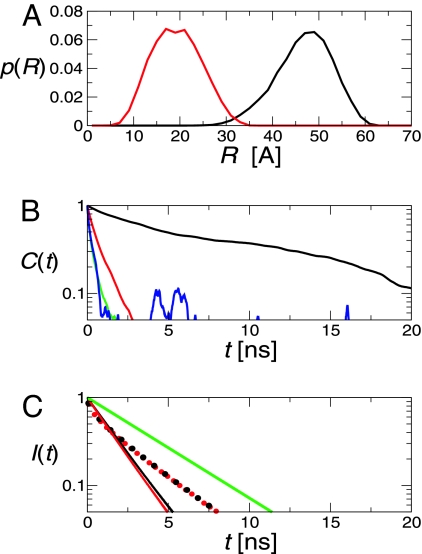
Langevin simulations of a simplified representation of the protein, linkers, and dyes (Fig. 1) (see Materials and Methods) were used to model the effects of dye orientational and linker dynamics. The simulation time scale is set by the Langevin friction of 50 ps−1 (commonly used to mimic water); this choice and our treatment of the linkers are justified by agreement between the correlation time for donor reorientation of 0.3 ns (Fig. 4B) and the 0.3-ns polarization anisotropy decay time reported previously for these dyes and linkers attached to polyproline (17).
Fig. 4.
Langevin simulation results for protein L and CspTm. (A) Donor–acceptor distance distributions for folded protein L (black line) and CspTm (red line). The N- and C-terminal α carbons are separated by 38 Å and 13 Å in the structures of protein L and CspTm, respectively. (B) Decay of correlation functions for donor–acceptor distance (black line), reorientation of the donor (green line) and acceptor (red line), and κ2 (blue line). (C) Decay of donor fluorescence in protein L calculated with (red lines) and without (black lines) the assumption of complete orientational averaging; curves for the folded and unfolded states are solid and broken, respectively, and the isolated donor decay is shown for reference in green.
The first quantitative test for single-molecule FRET measurements is the comparison of the folded state FRET efficiency with that predicted from the known structure. The donor fluorescence decay, I(t), was computed directly from the instantaneous transfer rates during the simulation [described in supporting information (SI) Text] (25) (Fig. 4C), and the mean FRET efficiency was derived from 〈E〉 = 1 − kD∫0∞I(t)dt, where kD is the decay rate of donor fluorescence (kD = 1/τD). The calculated folded efficiency of 0.69 agrees well with the measured 〈E〉 = 0.74 ± 0.02.
The model results also suggest the relevant dynamical averaging regime. The rapid decay of the correlation function for κ2, the Förster orientational factor, of ≈0.3 ns in the folded state (Fig. 4B), is much shorter than τD, suggesting that it is valid to assume κ2 = 2/3. This assumption has very little effect on the predicted fluorescence decay for the folded protein and no effect for the unfolded protein (Fig. 4C). Because the donor–acceptor distance correlation function of the folded protein also decays more slowly (≈9 ns) than the donor emission (1.0 ns), the mean folded efficiency can be calculated by assuming a static distribution of R:
 |
where L is the contour length, giving 〈E〉 = 0.71, in very close agreement with the result (〈E〉 = 0.69) of the exact calculation. Simulations of the unfolded protein indicate that it is in the same averaging regime.
The equivalent calculation for CspTm gives 〈E〉 = 0.99, much higher than the measured 〈E〉 = 0.85. Including electrostatic repulsion between the dyes in the model is too small an effect to explain the discrepancy (see SI Text). Therefore, the difference between the experimental and theoretical values is most likely due to a breakdown of the assumption of a uniform dielectric and of the point dipole approximation in Förster theory, which assumes that the dimensions of the donor (7 Å) and acceptor (12 Å) chromophores are small compared with their intermolecular separation (18 Å in CspTm) (17, 26, 27) (Fig. 4A).
Calculating the Rg of the Unfolded Subpopulation.
In the limit of fast orientational averaging and slow chain reconfiguration on the donor life-time (17), the end-to-end distance distribution Peq(R) can be computed at a given denaturant concentration by using Eq. 2. To further test whether the chain is reconfiguring slowly on the donor life-time, the donor fluorescence decay I(t) was computed for protein L at 4 M GdmCl by using a Gaussian chain end-to-end distribution for Peq(R) with one-dimensional diffusive dynamics (SI Fig. 8; see SI Text for details). The donor fluorescence decay for a static chain is essentially indistinguishable from the decay for a chain reconfiguring with the diffusion coefficient D = 16 Å2/ns obtained by Buscaglia et al. (28). This diffusion coefficient is an upper limit because it was measured for glycine-rich peptides in the absence of denaturant (D decreases with increasing denaturant concentration).
The mean FRET efficiencies in Fig. 3A were fitted by using Eq. 2 with a static Gaussian chain distribution of Peq(R). The average Rg (more precisely ) was calculated from the mean-square end-to-end distance, 〈R2〉, by using the relation 〈R〉g2 = 〈R2〉/6 (Fig. 3B). The two proteins expand continuously from ≈23 Å at 2.5 M GdmCl to ≈29 Å at 7.2 M GdmCl (see SI Table 1). These Rg values depend somewhat on the choice of Peq(R) in Eq. 2.
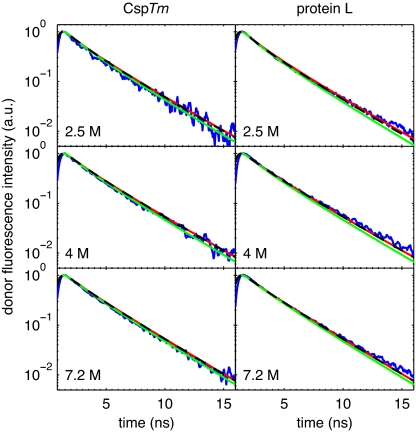
Langevin simulations of a simple bead model were therefore used to explore the uncertainty in the determination of Rg from the FRET data and to provide insight into the mechanism of chain expansion in the unfolded state (see Materials and Methods). Both the attractive interaction between the beads and the size of the bead were independently varied, the latter to allow for changes in excluded volume as a result of denaturant binding to the chain. Three models were considered: (i) a chain with no attractive interactions and variable excluded volume, (ii) a chain with fixed excluded volume and variable attraction, and (iii) a chain with fixed attraction and variable excluded volume. For each model the free parameters were varied to match the mean efficiency to the experimental mean at each denaturant concentration. The predicted donor fluorescence decays (see Fig. 5) for all three models agree reasonably well with the experimental donor fluorescence decays (blue lines) over the entire denaturant concentration range, with the pure excluded volume chain (green lines) being slightly worse for protein L than the models with both excluded volume and attractive interactions (black dashed lines) or the Gaussian chain (red lines) model.
Fig. 5.
Comparison of measured (blue lines) lifetimes for CspTm (Left) and protein L (Right) at 2.5 M (Top), 4 M (Middle), and 7.2 M (Bottom) GdmCl with those calculated assuming no chain dynamics during the donor lifetime for several Peq(R): Gaussian chain (red lines) and bead models with only excluded volume (green lines) and both excluded volume and attractive interactions (black dashed lines).
All-Atom Molecular Dynamics Simulations.
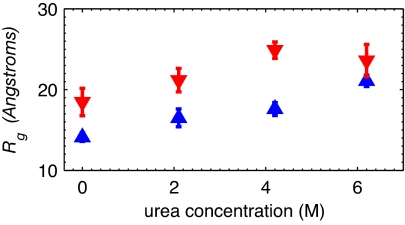
To further investigate the effects of denaturant on Rg and 〈R2〉 of unfolded protein L and CspTm, all-atom molecular dynamics simulations in explicit urea/water solvent were carried out (see Materials and Methods). Simulations were performed in urea, rather than GdmCl, because of lack of an adequate GdmCl force field. Despite the computational complexity that limits configurational sampling, the molecular dynamics simulations clearly indicate a continuous shift in Rg to higher values as the urea concentration is increased (Fig. 6). Distributions of the end-to-end distances and Rg for unfolded protein L and CspTm as a function of urea concentration are shown in SI Figs. 9 and 10.
Fig. 6.
Expansion of denatured states in simulations. All-atom molecular dynamics simulations of protein L (blue) and CspTm (red) in explicit urea/water solutions show an increase in Rg with urea concentration.
Slow Dynamics in the Unfolded State.
The width of the FRET efficiency peak from shot noise, σsn, is given by
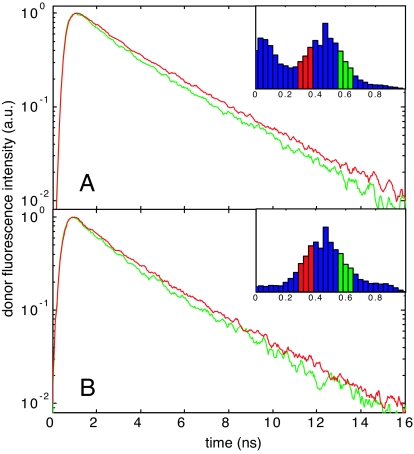
where 〈N−1〉 is the mean of the inverse number of photons in a burst and NT is the minimum number of photons in a burst (29) (see SI Table 2). The FRET efficiency peaks for folded protein L and CspTm have widths equal to σsn within error (Fig. 2, 0 M GdmCl, black dashed lines). However, the FRET peaks for both proteins are significantly broader than σsn for the unfolded state (Fig. 2, 6 M GdmCl, black dashed lines). For protein L, the measured peak width σmpL is σ mpL ≈ 1.56σsn, and for CspTmσmCsp ≈ 1.35 σsn. Additionally, the donor fluorescence decays from the high- and low-efficiency sides of the unfolded peak in the FRET histogram differ measurably for both protein L and CspTm (Fig. 7), whereas no such difference is seen for the folded state peak of protein L (data not shown). The unfolded state FRET peak widths for both proteins are insensitive to changes in observation time over the 1- to 2-ms range (SI Fig. 11).
Fig. 7.
Differences in donor fluorescence decays within the unfolded state FRET peaks at 4 M GdmCl for protein L (A) and CspTm (B). The donor photons in the green and red curves are from bursts on the high-efficiency (green) and low-efficiency (red) side of the unfolded peak, respectively (see Insets). The donor fluorescence decays faster for bursts with higher 〈E〉.
Discussion
Calculation of Rg from FRET and Comparison with SAXS Data.
Obtaining structural information from FRET data requires detailed consideration of dye-linker and protein dynamics (17, 24). Because unfolded proteins have a wide range of conformations, structure and dynamics are intimately connected. We confirmed the quantitative accuracy of the mean FRET efficiency of the folded protein 〈E〉 from the agreement with that calculated from Langevin simulations of a simplified representation of the dye-labeled protein. Analysis of the simulations and the experimental donor fluorescence decays for the unfolded proteins establish that, on the time scale of the donor life-time, the dyes are completely orientationally averaging, whereas the polypeptide backbone is essentially static (end-to-end distance correlation time of ≈50 ns) (Fig. 4 and SI Fig. 8) (28). This result is consistent with the end-to-end diffusion coefficient determined by Buscaglia et al. (28) and the ≈70-ns correlation time determined for the acid-denatured, 51-residue protein BBL from an ensemble T-jump study (30).
The shape of the donor fluorescence decay curves (Fig. 5) was also important in assessing end-to-end chain distributions for determining Rg. Several models were considered. First, excellent agreement between the calculated and observed decays was obtained with the end-to-end distribution of a Gaussian chain model having an 〈R2〉 consistent with the mean FRET efficiency. Excellent agreement was also obtained with distributions obtained from Langevin simulations of a simple bead model (31) that includes both excluded volume and weak attractive interactions between the beads (see SI Text for model details). For the bead model the expansion of the unfolded state was modeled equally well by varying either the interaction energy or the excluded volume term as a result of increased chain thickness from bound denaturant molecules (28, 32, 33). To mimic high denaturant conditions, the simulations were also performed with no attractive interactions between the beads (pure excluded volume chain). Surprisingly, this model also fits the CspTm data reasonably well but differs significantly from the decay curves for protein L. These comparisons provide a rough estimate of the uncertainty in using the FRET data for calculating Rg values. The Gaussian chain and bead models give Rg values for the unfolded states of protein L and CspTm that are generally within 1 Å of each other, whereas the pure excluded volume chain gives Rg values that are ≈2 Å smaller.
Our results differ from those recently reported by Sherman and Haran, who studied a His-tagged protein L labeled with the same dye pair using only intensity data to determine the FRET efficiency (34). They reported a mean FRET efficiency of 0.90 for the folded protein, considerably higher than our value determined from both life-time measurements and simulations (the highest possible value of 〈E〉 = 0.81 from simulation corresponds to linker dynamics much faster than the donor lifetime) and mean FRET efficiencies for the unfolded state that are systematically higher than the values determined here using both intensity and lifetime data. Another difference between this study and the work of Sherman and Haran (34) is the interpretation of the change in Rg with denaturant concentration. They explain their data with an analytical homopolymer model (35) in which the excluded volume contribution does not change with denaturant concentration. Our bead model results suggest that the increase in Rg for the unfolded state can result from decreasing the interaction energy or increasing the excluded volume (as concluded by Buscaglia et al. in ref. 28), or a combination of the two effects.
Equilibrium SAXS results for protein L by Plaxco et al. (20) yield an Rg of 26.0 ± 0.3 Å at 4 M GdmCl, in excellent agreement with our value of 26 ± 1 Å calculated from the FRET data. A problem arises, however, when comparing the Rg from single-molecule FRET at lower denaturant concentrations to the time-resolved SAXS measurement using the stopped-flow method. Surprisingly, no collapse at all was found (20). One possible reason for the difference that must be considered is that the dye labels in our experiments induce protein collapse in the unfolded state. However, ensemble stopped-flow FRET studies on protein L (19) and Bc-Csp (36) (a cold-shock protein closely related to CspTm) using much smaller donor and acceptor molecules at several different labeling positions show large decreases in FRET efficiency upon rapidly decreasing denaturant. In addition, the all-atom molecular dynamics simulations on protein L and CspTm presented in Fig. 6 clearly demonstrate large changes in Rg with changing (urea) denaturant concentration for both protein L and CspTm. S. Doniach (personal communication) has suggested to us that the protein concentration in the time-resolved SAXS experiment was sufficiently high that increased interparticle interference at low denaturant could lead to a larger apparent Rg. The definitive measure of Rg at low denaturant concentration will require new time-resolved SAXS experiments at much lower protein concentrations.
An interesting result from the single-molecule Rg measurements for protein L and CspTm is that the two proteins, which have almost identical lengths (protein L, 64 residues; CspTm, 66 residues), behave identically above 3 M GdmCl but differ in size below this denaturant concentration (Fig. 3B). These results are consistent with the prevailing idea that at high denaturant concentrations unfolded proteins have the properties of random-coil-like homopolymers (1, 28). Below 3 M GdmCl, the Rg data clearly show that sequence matters. There has been much interest in the unfolded state of proteins under weakly denaturing conditions. Fitzke and Rose (37) recently showed that systems with random-coil end-to-end distributions can also have native structural elements. Previous NMR and ensemble FRET studies on the denatured state of protein L have indicated that there may be partial ordering of the helix and in the first turn region between strands 1 and 2 (19, 22). Meanwhile, similar types of studies in CspTm have not found evidence for structure in the unfolded state (36, 38). It is therefore tempting to attribute protein L's smaller Rg at low denaturant to transient local structure formation in the unfolded state of protein L (19, 22). However, this difference may also arise from nonspecific hydrophobic collapse because protein L has a slightly more hydrophobic sequence than CspTm.
Dynamics from the Width of FRET Efficiency Distributions.
Analysis of the donor fluorescence decay provides information about dynamics on the nanosecond time scale. Dynamics at longer times affect the shape and/or width of the FRET efficiency distribution (i.e., times comparable to or longer than the interval between detected protons, ≈60 μs in our experiments) (29). However, interpreting the widths of FRET efficiency distributions in excess of that expected from Poisson shot noise has been a controversial issue since the first experiments on protein folding and has not yet been resolved (8, 10, 13, 17, 39, 40). The folded protein peaks for protein L and CspTm have shot-noise limited widths (Fig. 2, 0 M, black dashed lines), whereas those of the unfolded subpopulations of both proteins have widths in excess of the shot noise (Fig. 2, 6 M, black dashed lines). Additionally, the donor fluorescence decay time is the same across the folded FRET peak (data not shown), whereas it varies across the unfolded peak (Fig. 7) at all denaturant concentrations. These results rule out the possibility that the excess width in the unfolded state is due to instrumental, optical, or signal processing artifacts. Photophysical artifacts such as transient population of triplet states, acceptor blinking, or photobleaching would have to occur on a time scale comparable to or longer than the average interval between photons to affect the width (blinking on time scales much faster than the bin size would affect the mean FRET efficiency, but not the width). These processes, if present and occurring on a time scale between the mean interphoton interval and the observation time (≈1 ms), would cause the measured FRET peak widths of the unfolded state to narrow with increasing observation time. This is in contrast to our observation that the width is independent of bin size (SI Fig. 11).
The additional widths must therefore arise from heterogeneities in the dye-labeled protein system that affect 〈E〉 and that persist on time scales much longer than 1 ms. The most interesting physical origin for this heterogeneity is very slow polypeptide dynamics. In principle, dynamics can occur on many different time scales for unfolded proteins: tens of nanoseconds for motions in the unfolded well, microseconds to milliseconds for transitions between expanded denatured states and more compact denatured states separated by free energy barriers (41), and even slower dynamics corresponding to dissolution and formation of specific structure (13). It remains to be determined whether the heterogeneities seen here in the unfolded state are intrinsic to the protein dynamics or result from a (less interesting) protein–dye interaction.
Summary and Conclusions
Combining donor life-time and FRET efficiency measurements with molecular simulations is a powerful method for interpreting FRET experiments and for quantitatively investigating structural and dynamical properties of unfolded proteins. Two outstanding issues remain to be resolved by additional experiments. First, the disagreement between the FRET-determined Rg for protein L at low denaturant concentrations and the Rg determined by time-resolved SAXS at relatively high protein concentrations must be addressed. Second, additional experiments, such as FRET measurements on immobilized unfolded molecules (12, 13), are needed to determine the structural origins and relaxation times for the very slow dynamics inferred from the analysis of the width of the FRET efficiency distributions.
Materials and Methods
Sample Preparation.
A recombinant protein L with Cys residues added to the N and C termini was reacted with maleimide derivatives of Alexa Fluor 488 and Alexa Fluor 594 and purified by using size-exclusion and ion-exchange chromatographies. See SI Text for details. The preparation of labeled CspTm has been described previously (10).
Single-Molecule Spectroscopy.
Single-molecule FRET efficiencies for protein L and CspTm were measured on a PicoQuant Microtime 200 fluorescence microscope (Berlin, Germany) with time-correlated single-photon counting capabilities. The donor dye was excited by using a 470-nm pulsed laser (20-MHz repetition rate, 80-ps FWHM, 35-μW average power), and donor and acceptor fluorescence was detected by single-photon counting avalanche photodiodes. The arrival time of each photon (100-ns resolution) as well as the fluorescence delay time relative to the laser pulse (37-ps resolution) were recorded for each detection channel and stored for later analysis.
Data Analysis and Fitting.
Fluorescent bursts were identified by dividing data trajectories into 1-ms bins and merging adjacent bins that contained at least nine photons into individual burst events. Only bursts containing photons nA + nD > 30 were used in the FRET analysis. Fitting details are described in SI Text. The experimental donor fluorescence decay curves shown in Figs. 5 and 7 were obtained by selecting those bursts that have Em within a specified efficiency range and then histogramming the fluorescence delay times for those donor photons to give the donor fluorescence decay curve for that subensemble of molecules.
Langevin and Molecular Dynamics Simulations.
For the Langevin simulations a simplified model for the polypeptide structure was used in which each amino acid residue is represented as a spherical bead (Fig. 1). A Gō-like energy function was used for the protein, with analogously coarse-grained linkers and dyes (31). Simulations of length 0.75 μs were run with Langevin dynamics for both the folded and unfolded protein with friction of 50 ps−1 at a temperature of 300 K using the CHARMM code (42). See SI Text for simulation details.
All-atom molecular dynamics simulations of the unfolded proteins in a 60-Å cell of urea and water were run by using the OPLS-AA/L force field and the GROMACS 3.3 simulation package. The same set of initial configurations at each denaturant concentration was used in five simulations run at constant temperature and pressure for 15–25 ns. The effect of statistical sampling errors on measured properties was estimated by using a block error analysis. See SI Text for simulation details.
Supplementary Material
Acknowledgments
We thank Benjamin Schuler (University of Zurich, Zurich, Switzerland) for the gift of dye-labeled CspTm, Attila Szabo for many helpful discussions, Sebastian Doniach for discussion of the SAXS results, Gerhard Hummer for advice on the simulations, David Baker for sharing a protein L plasmid, Annie Aniana for technical assistance, and Gilad Haran for a preprint of his manuscript. This work was supported by the Intramural Research Program of the National Institute of Diabetes and Digestive and Kidney Diseases, National Institutes of Health.
Abbreviations
- Rg
radius of gyration
- SAXS
small-angle x-ray scattering.
Note Added in Proof.
Two papers closely related to the present work have published (43) or are about to appear (44) in PNAS. The conclusions in these works concerning both the end-to-end distribution and nanosecond dynamics of the unfolded state of CspTm are consistent with those presented here.
Footnotes
The authors declare no conflict of interest.
This article is a PNAS direct submission.
After our experiments were completed we became aware of a single-molecule FRET study on protein L by Sherman and Haran (34) using continuous-wave laser excitation.
The relative peak areas for the folded and unfolded states are not equal to the relative subensemble populations because of different detection efficiencies for donor and acceptor fluorescence and longer residence times in the excitation volume resulting from the decreased diffusion coefficient of unfolded proteins.
This article contains supporting information online at www.pnas.org/cgi/content/full/0607097104/DC1.
References
- 1.Kohn JE, Millett IS, Jacob J, Zagrovic B, Dillon TM, Cingel N, Dothager RS, Seifert S, Thiyagarajan P, Sosnick TR, et al. Proc Natl Acad Sci USA. 2004;101:12491–12496. doi: 10.1073/pnas.0403643101. [DOI] [PMC free article] [PubMed] [Google Scholar]
- 2.Dyson HJ, Wright PE. Adv Protein Chem. 2002;62:311–340. doi: 10.1016/s0065-3233(02)62012-1. [DOI] [PubMed] [Google Scholar]
- 3.Baldwin RL. Adv Protein Chem. 2002;62:361–367. doi: 10.1016/s0065-3233(02)62014-5. [DOI] [PubMed] [Google Scholar]
- 4.Mayor U, Grossmann JG, Foster NW, Freund SMV, Fersht AR. J Mol Biol. 2003;333:977–991. doi: 10.1016/j.jmb.2003.08.062. [DOI] [PubMed] [Google Scholar]
- 5.Myers JK, Oas TG. Nat Struct Biol. 2001;8:552–558. doi: 10.1038/88626. [DOI] [PubMed] [Google Scholar]
- 6.Mayor U, Guydosh NR, Johnson CM, Grossmann JG, Sato S, Jas GS, Freund SMV, Alonso DOV, Daggett V, Fersht AR. Nature. 2003;421:863–867. doi: 10.1038/nature01428. [DOI] [PubMed] [Google Scholar]
- 7.Brewer SH, Vu DM, Tang YF, Li Y, Franzen S, Raleigh DP, Dyer RB. Proc Natl Acad Sci USA. 2005;102:16662–16667. doi: 10.1073/pnas.0505432102. [DOI] [PMC free article] [PubMed] [Google Scholar]
- 8.Talaga DS, Lau WL, Roder H, Tang JY, Jia YW, DeGrado WF, Hochstrasser RM. Proc Natl Acad Sci USA. 2000;97:13021–13026. doi: 10.1073/pnas.97.24.13021. [DOI] [PMC free article] [PubMed] [Google Scholar]
- 9.Deniz AA, Laurence TA, Dahan M, Chemla DS, Schultz PG, Weiss S. Annu Rev Phys Chem. 2001;52:233–253. doi: 10.1146/annurev.physchem.52.1.233. [DOI] [PubMed] [Google Scholar]
- 10.Schuler B, Lipman EA, Eaton WA. Nature. 2002;419:743–747. doi: 10.1038/nature01060. [DOI] [PubMed] [Google Scholar]
- 11.Lipman EA, Schuler B, Bakajin O, Eaton WA. Science. 2003;301:1233–1235. doi: 10.1126/science.1085399. [DOI] [PubMed] [Google Scholar]
- 12.Rhoades E, Gussakovsky E, Haran G. Proc Natl Acad Sci USA. 2003;100:3197–3202. doi: 10.1073/pnas.2628068100. [DOI] [PMC free article] [PubMed] [Google Scholar]
- 13.Kuzmenkina EV, Heyes CD, Nienhaus GU. Proc Natl Acad Sci USA. 2005;102:15471–15476. doi: 10.1073/pnas.0507728102. [DOI] [PMC free article] [PubMed] [Google Scholar]
- 14.Slaughter BD, Unruh JR, Price ES, Huynh JL, Urbauer RJB, Johnson CK. J Am Chem Soc. 2005;127:12107–12114. doi: 10.1021/ja0526315. [DOI] [PubMed] [Google Scholar]
- 15.Lee NK, Kapanidis AN, Wang Y, Michalet X, Mukhopadhyay J, Ebright RH, Weiss S. Biophys J. 2005;88:2939–2953. doi: 10.1529/biophysj.104.054114. [DOI] [PMC free article] [PubMed] [Google Scholar]
- 16.Antonik M, Felekyan S, Gaiduk A, Seidel CAM. J Phys Chem B. 2006;110:6970–6978. doi: 10.1021/jp057257+. [DOI] [PubMed] [Google Scholar]
- 17.Schuler B, Lipman EA, Steinbach PJ, Kumke M, Eaton WA. Proc Natl Acad Sci USA. 2005;102:2754–2759. doi: 10.1073/pnas.0408164102. [DOI] [PMC free article] [PubMed] [Google Scholar]
- 18.Perl D, Welker C, Schindler T, Schroder K, Marahiel MA, Jaenicke R, Schmid FX. Nat Struct Biol. 1998;5:229–235. doi: 10.1038/nsb0398-229. [DOI] [PubMed] [Google Scholar]
- 19.Scalley ML, Nauli S, Gladwin ST, Baker D. Biochemistry. 1999;38:15927–15935. doi: 10.1021/bi991136g. [DOI] [PubMed] [Google Scholar]
- 20.Plaxco KW, Millett IS, Segel DJ, Doniach S, Baker D. Nat Struct Biol. 1999;6:554–556. doi: 10.1038/9329. [DOI] [PubMed] [Google Scholar]
- 21.Kim DE, Fisher C, Baker D. J Mol Biol. 2000;298:971–984. doi: 10.1006/jmbi.2000.3701. [DOI] [PubMed] [Google Scholar]
- 22.Yi Q, Scalley-Kim ML, Alm EJ, Baker D. J Mol Biol. 2000;299:1341–1351. doi: 10.1006/jmbi.2000.3816. [DOI] [PubMed] [Google Scholar]
- 23.Schuler B, Kremer W, Kalbitzer HR, Jaenicke R. Biochemistry. 2002;41:11670–11680. doi: 10.1021/bi026293l. [DOI] [PubMed] [Google Scholar]
- 24.Laurence TA, Kong XX, Jager M, Weiss S. Proc Natl Acad Sci USA. 2005;102:17348–17353. doi: 10.1073/pnas.0508584102. [DOI] [PMC free article] [PubMed] [Google Scholar]
- 25.Henry ER, Hochstrasser RM. Proc Natl Acad Sci USA. 1987;84:6142–6146. doi: 10.1073/pnas.84.17.6142. [DOI] [PMC free article] [PubMed] [Google Scholar]
- 26.Scholes GD. Annu Rev Phys Chem. 2003;54:57–87. doi: 10.1146/annurev.physchem.54.011002.103746. [DOI] [PubMed] [Google Scholar]
- 27.Wong KF, Bagchi B, Rossky PJ. J Phys Chem. 2004;108:5752–5763. [Google Scholar]
- 28.Buscaglia M, Lapidus LJ, Eaton WA, Hofrichter J. Biophys J. 2006;91:276–288. doi: 10.1529/biophysj.105.071167. [DOI] [PMC free article] [PubMed] [Google Scholar]
- 29.Gopich I, Szabo A. J Chem Phys. 2005;122 doi: 10.1063/1.1812746. 014707. [DOI] [PubMed] [Google Scholar]
- 30.Sadqi M, Lapidus LJ, Munoz V. Proc Natl Acad Sci USA. 2003;100:12117–12122. doi: 10.1073/pnas.2033863100. [DOI] [PMC free article] [PubMed] [Google Scholar]
- 31.Karanicolas J, Brooks CL. Protein Sci. 2002;11:2351–2361. doi: 10.1110/ps.0205402. [DOI] [PMC free article] [PubMed] [Google Scholar]
- 32.Bennion BJ, Daggett V. Proc Natl Acad Sci USA. 2003;100:5142–5147. doi: 10.1073/pnas.0930122100. [DOI] [PMC free article] [PubMed] [Google Scholar]
- 33.Tobi D, Elber R, Thirumalai D. Biopolymers. 2003;68:359–369. doi: 10.1002/bip.10290. [DOI] [PubMed] [Google Scholar]
- 34.Sherman E, Haran G. Proc Natl Acad Sci USA. 2006;103:11539–11543. doi: 10.1073/pnas.0601395103. [DOI] [PMC free article] [PubMed] [Google Scholar]
- 35.Sanchez IC. Macromolecules. 1979;12:980–988. [Google Scholar]
- 36.Magg C, Schmid FX. J Mol Biol. 2004;335:1309–1323. doi: 10.1016/j.jmb.2003.11.050. [DOI] [PubMed] [Google Scholar]
- 37.Fitzkee NC, Rose GD. Proc Natl Acad Sci USA. 2004;101:12497–12502. doi: 10.1073/pnas.0404236101. [DOI] [PMC free article] [PubMed] [Google Scholar]
- 38.Magg C, Kubelka J, Holtermann G, Haas E, Schmid FX. J Mol Biol. 2006;360:1067–1080. doi: 10.1016/j.jmb.2006.05.073. [DOI] [PubMed] [Google Scholar]
- 39.Deniz AA, Laurence TA, Beligere GS, Dahan M, Martin AB, Chemla DS, Dawson PE, Schultz PG, Weiss S. Proc Natl Acad Sci USA. 2000;97:5179–5184. doi: 10.1073/pnas.090104997. [DOI] [PMC free article] [PubMed] [Google Scholar]
- 40.Watkins LP, Chang HY, Yang H. J Phys Chem A. 2006;110:5191–5203. doi: 10.1021/jp055886d. [DOI] [PubMed] [Google Scholar]
- 41.Hagen SJ, Eaton WA. J Mol Biol. 2000;301:1019–1027. doi: 10.1006/jmbi.2000.3969. [DOI] [PubMed] [Google Scholar]
- 42.Brooks BR, Bruccoleri RE, Olafson BD, States DJ, Swaminathan S, Karplus M. J Comp Chem. 1983;4:187–217. [Google Scholar]
- 43.Hoffman A, Kane A, Nettels D., Hertzog D, Baumgärtel P, Lengefeld J, Reichardt G, Horsley DA, Seckler R, Bakajin O, Schuler B. Proc Natl Acad Sci USA. 2007;104:105–110. doi: 10.1073/pnas.0604353104. [DOI] [PMC free article] [PubMed] [Google Scholar]
- 44.Nettles D, Gopich IV, Hoffmann A, Schuler B. Proc Natl Acad Sci USA. 2007 in press. [Google Scholar]
Associated Data
This section collects any data citations, data availability statements, or supplementary materials included in this article.


