Abstract
The mitomycin C-resistance gene, mcrA, of Streptomyces lavendulae produces MCRA, a protein that protects this microorganism from its own antibiotic, the antitumor drug mitomycin C. Expression of the bacterial mcrA gene in mammalian Chinese hamster ovary cells causes profound resistance to mitomycin C and to its structurally related analog porfiromycin under aerobic conditions but produces little change in drug sensitivity under hypoxia. The mitomycins are prodrugs that are enzymatically reduced and activated intracellularly, producing cytotoxic semiquinone anion radical and hydroquinone reduction intermediates. In vitro, MCRA protects DNA from cross-linking by the hydroquinone reduction intermediate of these mitomycins by oxidizing the hydroquinone back to the parent molecule; thus, MCRA acts as a hydroquinone oxidase. These findings suggest potential therapeutic applications for MCRA in the treatment of cancer with the mitomycins and imply that intrinsic or selected mitomycin C resistance in mammalian cells may not be due solely to decreased bioactivation, as has been hypothesized previously, but instead could involve an MCRA-like mechanism.
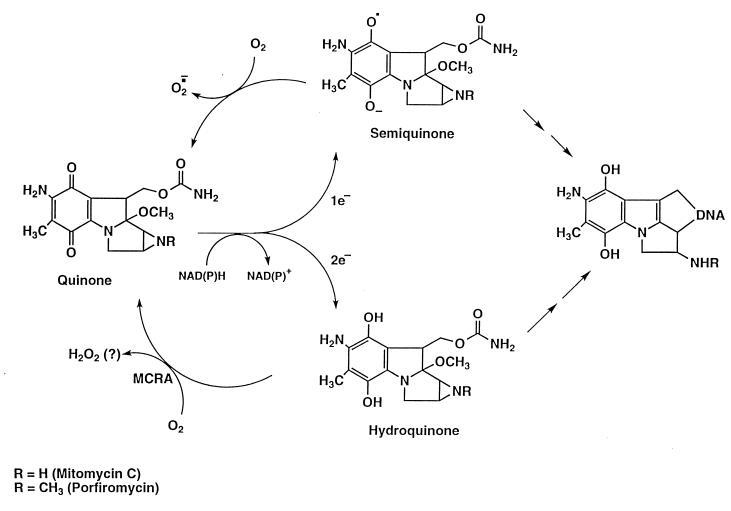
Overcoming microbial resistance to antibiotics represents a substantial hurdle currently facing medical science. An analogous problem encountered in cancer chemotherapy is the selection and emergence of drug-resistant tumor-cell populations during fractionated and protracted regimens of treatment with antineoplastic drugs (1). An understanding of the antibiotic-resistance mechanisms used by microbes may reveal strategies by which resistance may be circumvented or exploited, not only for the treatment of bacterial infections, but also for other uses. Mitomycin C (MC) and porfiromycin (POR), antibiotics produced by Gram-positive Streptomyces, are used clinically in the treatment of cancer because of their potent toxicity to tumor cells. The mitomycins are unique as anticancer drugs in that they are preferentially converted to active forms through enzymatic reduction in hypoxic regions of solid tumors (2, 3), producing highly reactive intermediates that are cytotoxic primarily because they cross-link DNA (4–6). Under aerobic conditions, redox cycling of the semiquinone anion-radical intermediate (the one-electron reduction product of the mitomycins) with molecular oxygen regenerates the nontoxic parental compound; this phenomenon results in the reduced toxicity of these compounds to aerobic cells (Fig. 1). This one-electron reduction reaction has been shown to be catalyzed by NADPH–cytochrome c (P450) reductase (EC 1.6.2.4), NADH–cytochrome b5 reductase (EC 1.6.2.2), xanthine dehydrogenase (EC 1.1.1.204), and xanthine oxidase (EC 1.1.3.22) (reviewed in refs. 7 and 8). The two-electron reduction product of the mitomycins, the hydroquinone intermediate, is relatively oxygen-insensitive (9) but is also a highly reactive electrophile that can readily cross-link DNA. This reduction product is produced by the enzyme NAD(P)H dehydrogenase (DT–diaphorase; EC 1.6.99.2) (7, 8). Because of its oxygen-insensitivity, the hydroquinone intermediate is not believed to contribute to the differential aerobic/hypoxic toxicity of the mitomycins. The clinical utility of the mitomycins is limited by their severe myelotoxicity; therefore, a strategy that could minimize or eliminate the toxicity to the aerobic myeloid progenitor-cell population might greatly enhance the therapeutic utility of these widely used anticancer drugs.
Figure 1.
Reduction/oxidation pathways of the mitomycins.
Streptomyces lavendulae produces large quantities of MC yet is exceedingly resistant to its toxic effects (10). In contrast, a single, mitomycin-induced DNA cross-link in susceptible bacteria results in death (11). Recently, the S. lavendulae encoded mcrA gene was shown to be stimulated by MC, producing MCRA, a 54-kDa flavoprotein that confers mitomycin antibiotic resistance to recipient bacteria (12–14). The mechanism of resistance by MCRA is novel: this protein reoxidizes the reduced, cytotoxic intermediate of MC to the parent drug through a redox relay mechanism, whereby electrons are shuttled from the reduced mitomycin intermediate to the covalently bound FAD cofactor of MCRA and ultimately to molecular oxygen. The finding of a single gene that is able to confer dramatic resistance to MC suggests possible therapeutic applications for MCRA. If MCRA could confer MC and POR resistance to mammalian cells, it might be used in a gene therapy application to protect the bone marrow from the cumulative and irreversible mitomycin toxicity occurring during cancer therapy (2, 3), thereby potentially increasing the therapeutic ratio of these drugs.
MATERIALS AND METHODS
Materials.
Mitomycin C was contributed by Bristol-Myers Squibb. Porfiromycin was synthesized from mitomycin C by our laboratory. Chloroquine and Hepes were purchased from Sigma. Glutamine, hypoxanthine, thymidine, geneticin (G418), trypsin, penicillin, and streptomycin were purchased from GIBCO/BRL. Tissue culture flasks, 60 mm, 100 mm, and 150 mm tissue culture dishes were acquired from Costar. 2-Mercaptoethanol was from Bio-Rad. CaCl2, glycerol, Tris, EDTA, KCl, and NaCl were obtained from J. T. Baker.
Cell Culture.
The cell line used in this study is a variant of the CHO-K1 cell line termed CHO-K1/dhfr− (15) and was obtained from the American Type Culture Collection. This cell line is deficient in dihydrofolate reductase. The cells were maintained in Iscove’s modified Dulbecco’s medium supplemented with 10% FBS (GIBCO/BRL), 2 mM glutamine, 0.1 mM hypoxanthine, 0.01 mM thymidine, and antibiotics (penicillin, 100 units/ml; streptomycin, 100 μg/ml). Transfected lines were maintained in the identical medium supplemented with 1 mg/ml G418. Cells were grown as monolayers in tissue culture flasks, Petri dishes, or 160-ml glass milk dilution bottles (Corning) at 37°C under an atmosphere of 95% air/5% CO2 in a humidified incubator. The doubling time of CHO-K1/dhfr− cultures is 19 hours.
Gene Manipulations. The mcrA gene (from a clone described in reference 12) was modified by PCR using the oligonucleotides shown below to generate a full-length product. Forward oligonucleotide, 5′-CGCGGATCCAAGCTTGCCACCATGGGGAGCACGCAATGGGGATGGGCCCTTGAG-3′; reverse oligonucleotide, 5′-CGCGGATCCAAGCTTTCTAGAGACGCCGGACAGGCTCGGTCG-3′.
Included in the first oligonucleotide is an additional glycine codon (GGG, shown underlined) immediately following the initiation codon (in bold) to optimize the start site for translational initiation (16). HindIII and XbaI sites (shown in italics) were included for subcloning purposes. PCR cycling conditions were 99°C for 5 min, followed by 20 cycles of 96°C for 1 min, 60°C for 1 min, and 72°C for 2 min. The amplified PCR product was extracted with phenol/chloroform, precipitated with 2.5 volumes of ethanol, and resuspended in 50 μl of Tris⋅EDTA (10 mM Tris⋅HCl, pH 8.0/1 mM EDTA). After digestion of 5 μl of the amplified DNA with HindIII and XbaI (Boehringer Mannheim), the mcrA fragment was subcloned into the eukaryotic expression vector pRC/CMV (Invitrogen), screened by restriction analysis, and sequenced. The plasmid, pRC/CMV-mcrA-1, contains the enhancer-promoter sequences from the immediate early gene of the human cytomegalovirus and the appropriate sequences for polyadenylation and selection (neomycin resistance) and inserts in a stable manner into the genome of transfected cell lines. Transfections were performed by the Ca3(PO4)2–DNA coprecipitation method essentially as described by Sambrook et al. (17) and modified by Belcourt et al. (18). Transfected lines (designated CHO–MCRA-1 and CHO–MCRA-2) were maintained in growth medium supplemented with 1 mg/ml G418 to provide for selection of the expression vector.
Western Analysis.
Western analysis was performed by using standard protocols as described by Sambrook et al. (17). Proteins were resolved by electrophoresis on SDS/10% PAGE and transferred to nitrocellulose. A rabbit anti-MCRA antibody (prepared as described in ref. 13) was used at a 1:4,000 dilution to detect MCRA on nitrocellulose membranes in combination with a horseradish peroxidase-conjugated anti-rabbit antibody and the enhanced chemiluminescent visualization reagent (ECL, Amersham). Molecular weight size markers are indicated in kDa.
Aerobic/Hypoxic Experiments.
CHO-K1/dhfr−, CHO-MCRA-1, and CHO-MCRA-2 cells were seeded in 160-ml glass milk dilution bottles (Corning) at 2 × 10⁵ cells per bottle (in 10 ml of growth medium) and were used in midexponential phase (≈3 to 4 days of growth). The growth medium was replaced with 5 ml of fresh medium immediately before the initiation of experimentation. Hypoxia was induced by gassing the cultures with a humidified mixture of 95% N2/5% CO2 (<10 ppm O2) at 37°C for 2 hours through a rubber septum fitted with 13 gauge (inflow) and 18 gauge (outflow) needles. After induction of hypoxia, cells were exposed to 2.5, 5, 7.5, or 10 μM MC or POR for 1 hour; drugs were injected (in 63–250 μl of 70% ethanol depending on the concentration needed) through the septum without compromising the hypoxia. Cells under aerobic conditions were treated with the mitomycins in an identical manner for 1 hour in a humidified atmosphere of 95% air/5% CO2 at 37°C but at concentrations of the mitomycins as great as 500 μM. Treated cells were washed, harvested by trypsinization, and assayed for survival by measuring their ability to form macroscopic colonies. Both aerobic and hypoxic vehicle controls (70% ethanol) were included in each experiment; the surviving fractions were normalized by using these vehicle controls. The plating efficiencies (colonies per 100 plated cells; mean ± SD) for CHO-K1/dhfr−, CHO-MCRA-1, and CHO-MCRA-2 cells were 85 ± 5, 83 ± 2, and 96 ± 4, respectively. The surviving fractions for the aerobic vehicle-treated controls (mean ± SD) were 1.07 ± 0.09, 1.03 ± 0.02, and 1.02 ± 0.05, whereas the surviving fractions for the hypoxic vehicle-treated controls were somewhat lower, reflecting the toxic effects of the hypoxia: 0.58 ± 0.04, 0.48 ± 0.04, and 0.49 ± 0.02 for CHO-K1/dhfr−, CHO-MCRA-1, and CHO-MCRA-2 cells, respectively.
DNA Cross-Linking Assay.
DNA cross-linking was measured essentially as described by Penketh et al. (19). This assay is a fluorescence-based system that uses H33258 (Molecular Probes), a DNA minor groove-binding bisbenzimide fluorescent dye that binds strongly to double-stranded DNA and becomes highly fluorescent. Briefly, T7 coliphage DNA and sodium borohydride reduced mitomycin C were combined and incubated at 37°C. At various time intervals, aliquots were removed, diluted into buffer containing H33258, heat denatured, snap cooled, and equilibrated to room temperature, and the fluorescence was measured. Data are expressed as the cross-linked fraction and was processed as described (19). T7 coliphage DNA and MCRA (essentially pure MCRA was prepared as described in detail in ref. 13) were dissolved in 20 mM Tris⋅HCl buffer containing 1 mM EDTA at pH 7.4. MC and POR stock solutions were in isopropanol at concentrations of 2.8 mM. A stock solution of sodium borohydride (14 mM in isopropanol) was made by the addition of 70 μl of 0.5 M sodium borohydride in 2-methoxyethyl ether to 930 μl of isopropanol. The final reaction mixtures (70–100 μl) contained 200 μM sodium borohydride and various concentrations of MC or POR (ranging from 40 to 100 μM) as indicated in each figure legend. HPLC analysis demonstrated that ≈50% of MC or POR was reduced in a reaction containing 200 μM of sodium borohydride as the reductant (see below and Table 2). In general, higher concentrations of POR were used to increase the cross-linking signal by this agent. Anaerobic conditions in the small reaction volumes used in these cross-linking studies were achieved by first purging solutions with nitrogen followed by nitrogen blanketing and the addition to the reaction of an oxygen-scavenging system (1 mM glucose plus 4 units/ml glucose oxidase). All incubations were carried out at 37°C. The fluorescence measurements were performed by using a Hoeffer Scientific Instruments TKO 100 Minifluorometer with a fixed excitation wavelength of 365 nm and a fixed emission wavelength of 460 nm.
Table 2.
Effect of MCRA on mitomycin C recovery after reduction to the hydroquinone by sodium borohydride.
| Sample | Mitomycin C Recovered, %
|
|
|---|---|---|
| Aerobic | Anaerobic | |
| 40 μM MC | 100 | 98 |
| 40 μM MC + 200 μM NaBH4 | 52 | 38 |
| 40 μM MC + 200 μM NaBH4 + 1 μM MCRA | 96 | 38 |
Values presented are the average of two experiments each conducted in duplicate.
HPLC Analysis.
Conversion measurements of MC from the sodium borohydride reduced form to the parental compound were by the HPLC method of Kumar et al. (20). Briefly, buffered solutions of 40 μM MC were reduced by the addition of sodium borohydride to a final concentration of 200 μM in the presence and absence of 1 μM MCRA at 37°C for 10 minutes. Anaerobic conditions were achieved as described above for DNA cross-linking. The percent recovery of MC was determined by comparison to a 40 μM solution of MC that was not reduced. In the absence of MCRA under reducing conditions, the MC peak is lost from the chromatograph with the appearance of peaks for mitosene products. The chromatographic conditions consisted of a linear gradient of 3–18% acetonitrile in 0.03 M KH2PO4 (pH 5.4) and a C-18 reverse phase column (Applied Biosystems RP-18; 220 × 4.6 mm; 5 μm).
RESULTS AND DISCUSSION
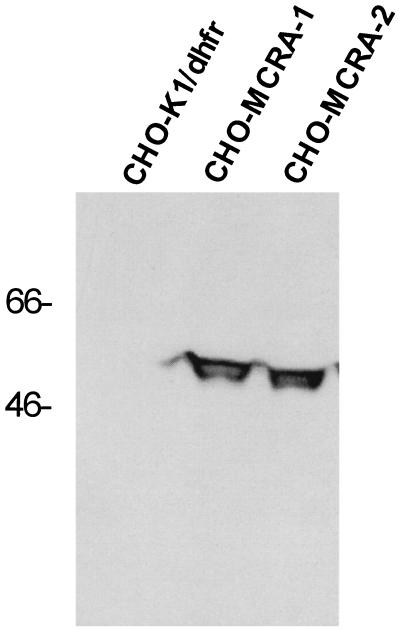
The mcrA gene was modified by the addition of mammalian translational initiation sequences and subcloning into the eukaryotic expression vector pRC/CMV. After transfection of the plasmid into CHO-K1/dhfr− cells, G418-resistant clones were screened for MC resistance. Two MC-resistant clones were subjected to Western analysis by using a rabbit anti-MCRA polyclonal antibody to assess the expression of the MCRA protein (Fig. 2). Parental cells did not express a protein immunologically related to MCRA whereas the transfected, mitomycin C-resistant clones expressed significant amounts of the MCRA protein. Immunofluorescence microscopy of mcrA-transfected cells revealed that the MCRA protein distributes uniformly throughout the cell (data not shown). As shown in Table 1, integration of the MCRA expression plasmid into the genome of the recipient CHO cells did not affect the expression levels of the mitomycin bioreductive enzymes known to be present in these cells, i.e. NADPH–cytochrome c (P450) reductase, DT–diaphorase, and NADH–cytochrome b5 reductase.
Figure 2.
Western analysis of CHO-K1/dhfr− parental cells and transfected cell clones expressing MCRA. Western analysis was performed with standard protocols as described by Sambrook et al. (17). Proteins were resolved by electrophoresis by SDS/10% PAGE and transferred to nitrocellulose. A rabbit anti-MCRA antibody was used at a 1:4,000 dilution to detect MCRA on nitrocellulose membranes in combination with a horseradish peroxidase-conjugated anti-rabbit antibody and the enhanced chemiluminescent visualization reagent (ECL, Amersham). Molecular weight size markers are indicated in kDa.
Table 1.
Oxidoreductase activities of the CHO-K1/dhfr− parental cell line and the MCRA-transfected cell line (CHO-MCRA-1) expressing the MCRA gene
| Enzyme† | Activity*
|
|
|---|---|---|
| CHO-K1/dhfr− | CHO-MCRA-1 | |
| NADPH–cytochrome c (P450) reductase | 8.7 ± 0.8 | 7.6 ± 0.6 |
| NADH–ferricyanide reductase | 1966 ± 214 | 1788 ± 138 |
| DT–Diaphorase | 8.7 ± 3.6 | 5.2 ± 2.2 |
All enzyme activities were determined by using standard assays as described (18). Values are mean ± SEM of six determinations.
No detectable xanthine oxidase or xanthine dehydrogenase activity was observed in either cell line.
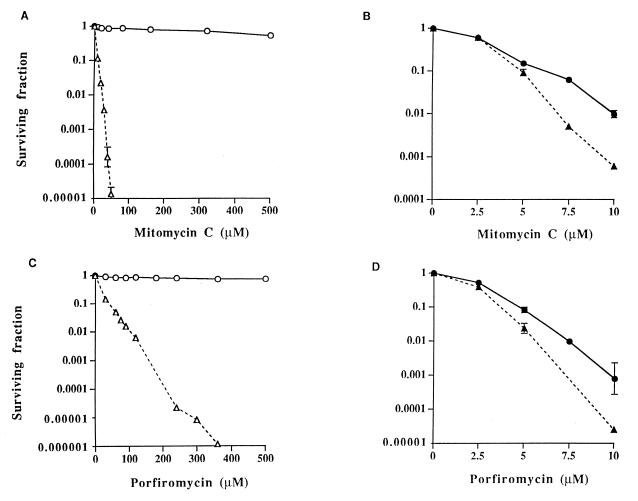
To ascertain the degree of resistance of MCRA-expressing cell lines to MC and POR, a clonogenic assay was performed under both aerobic and hypoxic conditions (Fig. 3). Profound resistance to the mitomycins was observed under aerobic conditions in the MCRA-expressing cell lines, compared with parental cells, at drug concentrations as high as 500 μM (Fig. 3 A and C). Cell survival was not affected by drug exposure times of up to 8 hours after treatment with 80 μM MC (data not shown). In contrast, parental CHO cells were extremely sensitive to the mitomycins at these high drug concentrations under aerobic conditions, with surviving fractions that were several orders of magnitude less than those observed in MCRA-expressing cells (Fig. 3 A and C). Most human and animal tumor-cell lines display an even greater sensitivity to these agents than the relatively resistant CHO cells (21–23). Under hypoxic conditions, the MCRA-expressing cells were almost as sensitive to the mitomycins as the parental cell line, indicating that the MCRA-resistance mechanism is oxygen-dependent (Fig. 3 B and D).
Figure 3.
Survival curves for CHO-K1/dhfr− parental and CHO-MCRA-1 cells treated with graded concentrations of mitomycin C or porfiromycin for 1 hour under aerobic (A and C) or hypoxic (B and D) conditions. Survival curves for CHO-MCRA-2 are similar to those for CHO-MCRA-1 and are not shown. Surviving fractions were calculated by using the plating efficiencies of the aerobic and hypoxic vehicle-treated controls. Points are geometric means of survivals from 3 to 8 independent experiments; SEMs are shown where larger than the points. ○, ● (solid line), CHO-MCRA-1 cells; ▵, ▴ (dashed line), CHO-K1/dhfr− parental cells. Note differences in scale for surviving fraction and drug concentration under the different conditions of oxygenation.
The degree of drug resistance attained with MCRA under aerobic conditions strongly argues that the hydroquinone intermediate, and not the semiquinone anion radical, must be largely responsible for the cytotoxicity of the mitomycins under aerobic conditions. The hydroquinone intermediate is relatively oxygen-insensitive compared with the semiquinone anion radical (9, 24–26); this suggests that, in the presence of oxygen, redox cycling of the semiquinone anion radical would prevent this intermediate from reacting with other nucleophiles. The second-order rate constant for the reaction of semiquinone anion radicals with O2 is extremely high, approximately 109 M−1⋅s−1 and is comparable to diffusion-controlled reaction rates (27, 28). This second-order reaction can be described accurately as a pseudo-first-order reaction if the substrate not being considered (i.e., oxygen) is present in a large molar excess (≥20-fold). In cell cultures, the oxygen concentration is ≈220 μM, and the concentration of the semiquinone anion radical is probably <1 μM. Under such circumstances, the disappearance of the semiquinone anion radical, if it were not replaced, would follow pseudo-first-order kinetics with a half-life of ≈3 × 10⁻⁶ seconds (27, 28). When acting as an electrophile, the semiquinone anion radical reacts much more sluggishly, with a half-life of several seconds (27, 28). Therefore, in the presence of oxygen, it is unlikely that a significant proportion of the semiquinone anion radical would react with DNA (or another nucleophile) through an alkylating mechanism. Because the hydroquinone intermediate is relatively oxygen stable, the aerobic toxicity of the mitomycins is likely caused by the hydroquinone and not the semiquinone anion radical. Recently, the MC hydroquinone has been implicated as the major precursor of cross-links under hypoxic conditions (20), suggesting that the semiquinone anion radical may owe its biological effects under hypoxia largely to disproportionation to the hydroquinone.
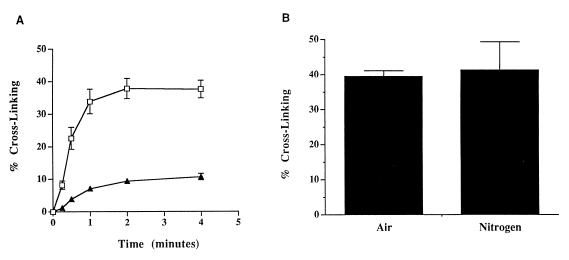
The interaction between the mitomycin hydroquinone intermediates and DNA was assessed in vitro by using a neutral-pH, fluorometric DNA cross-linking assay (19). This assay was designed to measure the ability of sodium borohydride-reduced MC and POR to cross-link DNA in the presence and absence of MCRA and oxygen. Sodium borohydride-reduced MC and POR cross-linked T7 coliphage DNA, with POR producing ≈25% of the cross-links formed by MC when equal concentrations of each agent were used (Fig. 4A). The degree of cross-linking by MC after 6 min was not significantly different in air and hypoxia (Fig. 4B); a similar result was observed for POR (data not shown). The oxygen insensitivity of these DNA–DNA cross-link alkylation events is strong evidence that the hydroquinone intermediate is the major reduction product of the mitomycins after chemical reduction with sodium borohydride under these conditions. The hydroquinone, if reoxidized before it spontaneously and irreversibly rearranges to the alkylating, quinone methide species, should regenerate the parent molecule. HPLC analysis demonstrated that, under aerobic conditions, the presence of 1 μM MCRA resulted in the recovery of 96% of the parent MC from 40 μM MC reduced with 200 μM sodium borohydride (Table 2). Only 4% of the original MC was converted to hydroquinone-derived alkylation (mitosene) products as compared with 48% seen in the absence of MCRA (Table 2). Collectively, these data are strong evidence that sodium borohydride reduction of MC generates the oxygen-insensitive hydroquinone species of MC.
Figure 4.
(A) Cross-linking of T7 coliphage DNA by the hydroquinone intermediates of MC (□) or POR (▴). Generation of the hydroquinone intermediates was accomplished by reduction of 40 μM of each drug with 200 μM sodium borohydride as described in Materials and Methods. (B) The effects of oxygen on T7 coliphage DNA cross-linking by 40 μM sodium borohydride-reduced MC after 6 min of exposure time; hypoxia was created as described in Materials and Methods. Values represent the means of three independent determinations. SEMs are shown where large enough to be visible.
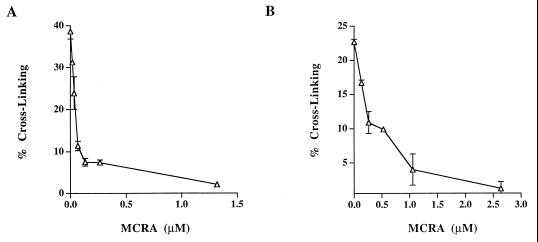
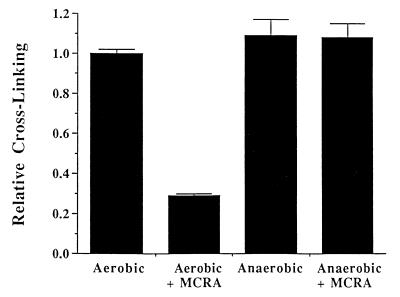
The cross-linking of T7 coliphage DNA by sodium borohydride-reduced MC and POR was also evaluated in the presence of graded concentrations of MCRA under aerobic conditions (Fig. 5). Less than 0.25 μM MCRA was required to prevent 80% of the DNA cross-linking by the MC hydroquinone intermediate, generated from 40 μM MC reduced with 200 μM of sodium borohydride. Under such conditions, the yield of hydroquinone is ≈50% (yielding about 20 μM hydroquinone; see Table 2), indicating that a single molecule of MCRA enzyme can catalyze the oxidation of multiple hydroquinone molecules. Similarly, 1 μM MCRA was required to provide equivalent protection from DNA cross-linking by the POR hydroquinone intermediate, generated from 100 μM of POR reduced with 400 μM sodium borohydride. To determine whether MCRA was functioning as a hydroquinone oxidase, the effects of oxygen and hypoxia on the activity of MCRA were measured. MCRA markedly decreased the cross-linking of DNA by the MC hydroquinone under aerobic conditions but did not prevent DNA cross-linking by the MC hydroquinone under hypoxia (Fig. 6). HPLC analysis demonstrated that oxygen is necessary for MCRA-dependent recovery of the parent mitomycin molecule after reduction of 40 μM MC by 200 μM sodium borohydride (Table 2). In the presence of oxygen and MCRA, 96% of the parent mitomycin was recovered after reduction to the hydroquinone. In contrast, anaerobic conditions prevented the MCRA-dependent restoration of the parent molecule after reduction to the hydroquinone (Table 2). Under anaerobic conditions, the amount of reduced mitomycin C produced by sodium borohydride slightly exceeds that seen in the presence of oxygen, because sodium borohydride, in addition to reducing mitomycin C, also reacts with molecular oxygen to produce reduced oxygen species. These findings demonstrate that MCRA functions as a redox cycling protein, oxidizing the mitomycin hydroquinone intermediates back to the parental drugs in an oxygen-dependent manner (see Fig. 1). The exact nature of the reduced oxygen species generated by MCRA after its oxidation of the hydroquinone intermediate is not known, although many flavoprotein oxidases generate hydrogen peroxide (29).
Figure 5.
Cross-linking of T7 coliphage DNA by the reduction of 40 μM MC (A) or 100 μM POR (B) to hydroquinone intermediates by 200 μM or 400 μM sodium borohydride, respectively, in the presence of graded concentrations of MCRA. Values represent the means of three independent determinations. SEMs are shown where large enough to be visible.
Figure 6.
The effects of oxygen on the ability of 1 μM MCRA to protect T7 coliphage DNA from cross-linking by the hydroquinone intermediate of sodium borohydride-reduced MC (50 μM). MC reduction by sodium borohydride and anaerobic conditions were accomplished as described in Materials and Methods. Values represent the means of three independent determinations. SEMs are shown where large enough to be visible.
The MCRA-catalyzed oxidation of the mitomycin hydroquinone intermediates suggests a new mechanism by which an aerobic/hypoxic differential kill by these drugs may occur. Previously, it had been postulated that the rate of reduction of the mitomycins was the main element determining their cytotoxicity and that the redox cycling of the semiquinone anion radical by oxygen was the major factor decreasing the aerobic cytotoxicity, thereby producing the observed aerobic/hypoxic differential of these agents (reviewed in ref. 7). MC-resistant cell lines generated by several laboratories (see ref. 8 for appropriate references) have, in all instances where measured, exhibited drug resistance under aerobic conditions but no drug resistance (i.e., parental sensitivity) under hypoxia. The resistance phenotype has been attributed to decreases in the activation of MC, because these cell lines typically express reduced levels of a bioreductive enzyme(s) known to activate the mitomycins. This hypothesis is inconsistent with the lack of resistance observed under hypoxia, as are the hypotheses that resistance is caused by increased repair of the DNA lesions produced by the mitomycins or by the efflux of MC through a multidrug resistance-like mechanism. Decreases in the level of mitomycin bioactivation through decreased expression of drug-activating enzymes should result in a corresponding increase in drug resistance regardless of the degree of oxygenation. Several studies have implicated DT–diaphorase, which produces the hydroquinone intermediate of the mitomycins through a two-electron reduction process, as an enzyme that only activates the mitomycins under aerobic, but not hypoxic, conditions. These results were implied from studies of cell lines treated with nonspecific inhibitors of DT–diaphorase (dicumarol), or from an analysis of mitomycin C-resistant cell lines containing decreases in DT–diaphorase enzyme levels when compared with similar, mitomycin C-sensitive cell lines, but were only resistant to mitomycin C under aerobic, but not hypoxic, conditions (reviewed in refs. 7 and 8). These latter studies compared DT–diaphorase and/or NADPH–cytochrome c (P450) reductase enzyme levels from heterologous, mitomycin C-resistant cell lines which were uncharacterized in terms of the levels of the other mitomycin bioreductive enzymes. Some resistant cell lines were derived by exposure to mitomycin C over many months; it is likely that, in addition to decreases in the one or two enzymes measured, other genetic changes have accumulated or exist in these cells that impact on drug resistance. Comparing cell lines with distinct intrinsic or selected mitomycin C sensitivities, but of different origins, disregards potential heterogeneities in the many other genetic factors that can impact on drug resistance. Therefore, based solely on the drug-resistance phenotype of mitomycin C-resistant cell lines selected in this manner, we find it difficult to conclude that DT–diaphorase must only function under aerobic conditions simply because decreases in DT–diaphorase levels correlate with increased mitomycin C resistance under aerobic, but not hypoxic, conditions. In the only study designed to explicitly measure the effect of increasing DT–diaphorase enzyme levels on mitomycin C cytotoxicity as a function of oxygenation (26), this enzyme was elevated by transfection and expression of its cDNA in CHO cells, resulting in an enhanced sensitivity of these cells to mitomycin C independent of the oxygenation state of the cells.
An oxygen-dependent resistance mechanism analogous to that produced by MCRA is most consistent with these findings. The expression of MCRA in CHO cells greatly reduced the toxicity of the mitomycins under aerobic conditions but had little effect on toxicity under hypoxia, thereby markedly enhancing the aerobic/hypoxic differential of these agents without influencing their rate of activation (Fig. 3). Moreover, we provide evidence that the very large increase in the aerobic/hypoxic differential of MCRA-expressing cells compared with parental cells is likely because of the back-oxidation of the mitomycin hydroquinone by MCRA rather than to differential rates of reduction (see Fig. 1). This oxygen effect is not dependent on the spontaneous oxidation of the semiquinone anion radical by molecular oxygen. These findings raise the question of whether endogenous oxidases or other enzymes functionally comparable to MCRA, which are capable of inactivating the mitomycin hydroquinone intermediates, exist in mammalian cells and modulate the cytotoxicity of the mitomycins during their use in cancer therapy.
Acknowledgments
The authors are grateful for support from U.S. Public Health Service Grant CA-80845 from the National Cancer Institute (A.C.S.), and grants RPG-92–001-06 (A.C.S.) and EDT-62N (S.R.) from the American Cancer Society.
ABBREVIATIONS
- MC
mitomycin C
- POR
porfiromycin
- MCRA
mitomycin C resistance-associated
Footnotes
This paper was submitted directly (Track II) to the Proceedings Office.
References
- 1.Penketh P G, Shyam K, Sartorelli A C. In: Drug Resistance. Hait W N, editor. Boston: Kluwer; 1996. pp. 65–81. [Google Scholar]
- 2.Rockwell S, Sartorelli A C. In: Antitumor Drug-Radiation Interactions. Hill B T, Bellamy A S, editors. Boca Raton, FL: CRC; 1990. pp. 125–139. [Google Scholar]
- 3.Sartorelli A C, Tomasz M, Rockwell S. Adv Enzyme Regul. 1993;33:3–17. doi: 10.1016/0065-2571(93)90005-x. [DOI] [PubMed] [Google Scholar]
- 4.Iyer V N, Szybalski W. Proc Natl Acad Sci USA. 1963;50:355–362. doi: 10.1073/pnas.50.2.355. [DOI] [PMC free article] [PubMed] [Google Scholar]
- 5.Iyer V N, Szybalski W. Science. 1964;145:55–58. doi: 10.1126/science.145.3627.55. [DOI] [PubMed] [Google Scholar]
- 6.Tomasz M, Lipman R, Chowdary D, Pawlak J, Verdine G R, Nakanishi K. Science. 1987;235:1204–1208. doi: 10.1126/science.3103215. [DOI] [PubMed] [Google Scholar]
- 7.Belcourt M F, Hodnick W F, Rockwell S, Sartorelli A C. Adv Enzyme Regul. 1998;38:111–133. doi: 10.1016/s0065-2571(97)00009-5. [DOI] [PubMed] [Google Scholar]
- 8.Sartorelli A C, Hodnick W F, Belcourt M F, Tomasz M, Haffty B, Fischer J J, Rockwell S. Oncol Res. 1994;6:501–508. [PubMed] [Google Scholar]
- 9.Beall H D, Mulcahy R T, Siegel D, Traver R D, Gibson N W, Ross D. Cancer Res. 1994;54:3196–3201. [PubMed] [Google Scholar]
- 10.Hata T, Sano Y, Sugawara R, Matsumae A, Kanamori K, Shima T, Hoshi T. J Antibiot Ser A. 1956;9:141–146. [PubMed] [Google Scholar]
- 11.Szybalski W, Iyer V N. Fed Proc. 1964;23:946–957. [PubMed] [Google Scholar]
- 12.August P R, Flickinger M C, Sherman D H. J Bacteriol. 1994;176:4448–4454. doi: 10.1128/jb.176.14.4448-4454.1994. [DOI] [PMC free article] [PubMed] [Google Scholar]
- 13.August P R, Rahn J A, Flickinger M C, Sherman D H. Gene. 1996;175:261–267. doi: 10.1016/0378-1119(96)00172-2. [DOI] [PubMed] [Google Scholar]
- 14.Johnson D A, August P R, Shackleton C, Liu H-W, Sherman D H. J Am Chem Soc. 1997;119:2576–2577. [Google Scholar]
- 15.Urlaub G, Chasin L A. Proc Natl Acad Sci USA. 1980;77:4216–4220. doi: 10.1073/pnas.77.7.4216. [DOI] [PMC free article] [PubMed] [Google Scholar]
- 16.Kozak M. J Cell Biol. 1989;108:229–241. doi: 10.1083/jcb.108.2.229. [DOI] [PMC free article] [PubMed] [Google Scholar]
- 17.Sambrook J, Fritsch E F, Maniatis T. Molecular Cloning: A Laboratory Manual. 2nd Ed. Plainview, NY: Cold Spring Harbor Lab. Press; 1989. pp. 16.32–16.36. [Google Scholar]
- 18.Belcourt M F, Hodnick W F, Rockwell S, Sartorelli A C. J Biol Chem. 1998;273:8875–8881. doi: 10.1074/jbc.273.15.8875. [DOI] [PubMed] [Google Scholar]
- 19.Penketh P G, Shyam K, Sartorelli A C. Anal Biochem. 1997;252:210–213. doi: 10.1006/abio.1997.9996. [DOI] [PubMed] [Google Scholar]
- 20.Kumar G S, Lipman R, Cummings J, Tomasz M. Biochemistry. 1998;36:14128–14136. doi: 10.1021/bi971394i. [DOI] [PubMed] [Google Scholar]
- 21.Sartorelli A C. Cancer Res. 1988;48:775–778. [PubMed] [Google Scholar]
- 22.Siegel D, Gibson N W, Preusch P C, Ross D. Cancer Res. 1990;50:7483–7489. [PubMed] [Google Scholar]
- 23.Traver R D, Horikoshi T, Danenberg K D, Stadlbauer T H W, Danenberg P V, Ross D, Gibson N W. Cancer Res. 1992;52:797–802. [PubMed] [Google Scholar]
- 24.Ross D, Beall H, Traver R D, Siegel D, Philips R M, Gibson N W. Oncol Res. 1994;6:493–500. [PubMed] [Google Scholar]
- 25.Belcourt M F, Hodnick W F, Rockwell S, Sartorelli A C. Proc Natl Acad Sci USA. 1996;93:456–460. doi: 10.1073/pnas.93.1.456. [DOI] [PMC free article] [PubMed] [Google Scholar]
- 26.Belcourt M F, Hodnick W F, Rockwell S, Sartorelli A C. Biochem Pharmacol. 1996;51:1669–1678. doi: 10.1016/0006-2952(96)00143-8. [DOI] [PubMed] [Google Scholar]
- 27.Kalyanaraman B, Perez-Reyes E, Mason R P. Biochim Biophys Acta. 1980;630:119–130. doi: 10.1016/0304-4165(80)90142-7. [DOI] [PubMed] [Google Scholar]
- 28.Halliwell B, Gutteridge J M C. Free Radicals in Biology and Medicine. Oxford: Clarendon; 1989. p. 76. [Google Scholar]
- 29.Lehninger A L. Biochemistry. New York: Worth; 1975. pp. 486–488. [Google Scholar]


