Abstract
Formation of a stereospecific protein complex is favored by specific interactions between two proteins but disfavored by the loss of translational and rotational freedom. Echoing the protein folding process, we have previously proposed a transition state for protein-protein association. Here we clarify the specification of the transition state by working with two types of toy models for protein association. A “hemisphere” model consists of two matching hemispheres as associating proteins, and a “crater” model consists of a spherical protein with a crater to which another spherical protein fits snugly. Short-range pairwise interactions between sites across the interface hold together the bound complex. Small relative translation and rotation between the subunits quickly destroy the interactions, leading to a sharp transition between the bound state with numerous short-range interactions but restricted translation and rotational freedom and the unbound state with, at most, a small number of interactions but expanded configurational freedom. This transition sets the outer boundary of the bound state as well as the transition state for association. The energy landscape is funnel-like, with the deep well of the bound state surrounded by a broad shallow basin. Calculations with the toy models suggest that mutational change in the interaction energy in the x-ray structure of a protein-protein complex, commonly used to approximate the effect on the association constant, overestimates the effect of mutation by 10–20%. With an eye toward specifying the transition states of actual protein complexes, we find that the total number of contacts between the subunits serves as a good surrogate of the interaction energy. This formalism of protein-protein association is applied to the barnase-barstar complex, reproducing the experimental results for the association rate over a wide range of ionic strength.
INTRODUCTION
Interactions between proteins play central roles in diverse biological functions such as signal transduction, immune response, motility generation, and enzyme catalysis and inhibition. The mode of action is the association and dissociation of the interacting partners. The product of association is a stereospecific protein complex. Both the stability of the protein complex (measured by the association constant Ka) and the association and dissociation rate constants (ka and kd) are of fundamental interest. In many ways, the association process resembles the folding of a protein (1). Both are favored by short-range specific interactions, between two subunits in association while among residues within the same polypeptide chain in folding. Both are disfavored by restrictions on internal motion, i.e., relative translation and rotation for association and large-scale variations of chain conformations for folding. Great insight to protein folding has been gained from systematic studies of toy models (2,3). Here we present a study of the association process based on two types of toy models.
Echoing the protein folding process, we have previously proposed a transition state for protein-protein association (4,5). The bound state of two proteins is characterized by specific (e.g., van der Waals, hydrophobic, and electrostatic) interactions, whereas the unbound state is characterized by translational and rotational freedom. On going from the bound to the unbound, a sharp transition in interaction energy and in configurational freedom is expected. This transition serves as the outer boundary of the bound state as well as the transition state for association. A main aim of this study is to clarify the specification of the transition state.
The measured association constants for protein complexes vary from <103 to >1015 M−1. What accounts for the >10 orders-of-magnitude difference in Ka? Valuable information is provided by the structure of a protein complex determined by x-ray crystallography or NMR spectroscopy. This structure presents a representative configuration of the bound complex. However, there is no statistical mechanical reason to expect a simple relation between Ka and the interaction energy in just one representative configuration of the bound complex. The understanding of Ka is limited by uncertainties about the extent of relative translation and rotation sampled in the bound state and how the interaction energy changes with the relative motion. In recent years significant progress has been made toward a fundamental understanding of binding affinity and kinetics (1,4–12), but many important questions remain unresolved. With the two types of toy models studied here, in which interactions between the subunits are fully specified, we hope to address:
How can the outer boundary of the bound state, i.e., the transition state, be specified?
What is the extent of relative motion in the bound state and the size of its configurational volume?
Is there a simple relation between Ka and Um, the minimum interaction energy in the bound state, and, in particular, can the effects of point mutations on Ka be approximated by the changes in Um?
Can the transition state thus specified be used to predict electrostatic enhancement of association rate?
FORMULATION OF THE ASSOCIATION CONSTANT
When two molecules associate to form a complex, the equilibrium is measured by the association constant, Ka. We now illustrate the formulation of Ka on a number of molecular models.
General model
The development here largely follows the book of Hill (13), but with an emphasis on protein molecules. Consider a protein molecule α with internal dynamics well separated from overall translational and rotational motion. In particular, the separability of internal and overall motion is the basis of the model-free approach to the analysis of NMR relaxation data (14). Let the overall translation be described by the displacement vector rα, the overall rotation be described by an orientation vector ωα, and the internal degrees of freedom be represented by a vector xα. If the potential of mean force, after considering the solvent degrees of freedom, of the protein molecule is Uα(xα), then the configurational integral is
 |
(1) |
where β = (kBT)−1 and V is the volume sampled by the translation of protein molecule α. For convenience, Uα will be referred to simply as the potential energy.
Now suppose that there are three species, protein A, protein B, and their complex C. For protein A or B, Eq. 1 gives the configurational integral when the subscript α is replaced by A or B. For the complex, translations of the subunits can be recast as the overall translation R plus a relative translation r = rB − rA. The potential energy of the complex can be written as UC(r, ωA, ωB, xA, xB), and its configurational integral is
 |
(2) |
It should be noted that the bound state is defined as a particular region in the configurational space and the integration of Eq. 2 is restricted to this region, as signified by the subscript b. Specifying the boundary of this region is a focus of this study.
The equilibrium constant for the association of proteins A and B to form the 1:1 complex C is then (13)
 |
(3a) |
 |
(3b) |
It is now helpful to define a potential of mean force to measure explicitly the energy of interaction between the subunits:
 |
(4) |
Note that as r → ∞ (i.e., as the subunits move far apart), UC(r, ωA, ωB, xA, xB) = UA(ωA, xA) + UB(ωB, xB) and U(r, ωA, ωB) becomes zero. The association constant then becomes
 |
(5) |
So far, the individual translations of the subunits in the complex have been recast as the overall translation of the complex plus relative translation within the complex, but the individual rotations of the subunits have been retained in the formulation of Ka. One way to separate overall and relative rotations is to 1), select a fixed orientation of protein A and then sample different orientations of protein B; and 2), rotate protein A and protein B together to different orientations. Let the orientation of protein B relative to the selected orientation of A be ω, and the orientation of the subunits together be Ω, then
 |
(6) |
It has often been said that, when two proteins form a complex, six translational and rotational degrees of freedom are lost. This statement is misleading as it neglects the relative translational (r) and relative rotational (ω) motion within the complex. A completely rigid complex, i.e., one without any relative translation or rotation, has an association constant that is given by an integral over a single point, which is zero unless the interaction potential well is infinitely deep.
The formulation of the association constant presented above is based on separating the relative translational and rotational degrees of freedom (r and ω) from the internal degrees of freedom (xA and xB) of the subunits. Tidor and Karplus (15) used normal-mode analysis to study the contribution of relative motion within the bound complex. The advantage of their approach is that there is no need to explicitly separate r and ω from xA and xB. The advantage of our formulation is that there is no need to assume the potential U(r, ωA) as harmonic.
The change in chemical potential upon the association of proteins A and B is (13)
 |
(7a) |
 |
(7b) |
where [A], [B], and [C] are the concentrations of the separate proteins and the complex. Note that, at chemical equilibrium, Δμ = 0 and Eq. 7b leads to [C]/[A][B] = Ka, the expected dependence of the equilibrium concentrations on the association constant. The standard chemical-potential change is obtained when [A] = [B] = [C] = 1 M, which is given by
 |
(7c) |
If Ka is in units of M−1, then the logarithmic term of Eq. 7c can be simply written as ln Ka.
Spherical model
Consider two spherical proteins, with an interaction energy U(r) depending on the interprotein distance r. A complex is considered formed when r is within an outer limit r‡ defining the bound state. For this model, the association constant is given by (5,6,11)
 |
(8) |
which is easily derived from Eq. 6 after considering the fact that individual rotations of the subunits are uncoupled from their relative translation and do not affect the association process. When the interaction potential is harmonic, i.e., U(r) = Um + f(r − rm)2/2, one has
 |
(9) |
With the individual rotations cast aside, the two spherical subunits can be viewed as point masses, and the complex as a diatomic molecule. While each subunit before association has three translational degrees of freedom, the complex has three degrees of translation for the center of mass, two degrees of rotation (around two perpendicular axes through the center of mass), and one degree of vibration for the intersubunit distance. If the masses of the subunits are mA and mB, then their partition functions for translational motion are
 |
(10) |
where α = A or B, and h is Planck's constant. The partition function of the complex, accounting for translation, rotation, and vibration, is (13)
 |
(11) |
where m = mA + mB is the total mass,  is the moment of inertia with μ = mAmB/(mA + mB) for the reduced mass, and ν = (f/μ)1/2/2π is the vibrational frequency. In Eq. 11, the classical limit of the vibrational partition function is used. One can easily check that the association constant calculated from the partition functions, Ka = (qC/V)/(qA/V)(qB/V), is identical to the result given by Eq. 9.
In this simple model, individual rotations of the subunits and their relative translation are uncoupled, and the relative translation can be further separated into rotation of the complex and vibration within the complex. Rotation of the complex is equivalent to a change in the direction of the relative translation, whereas vibration within the complex is just a change in the magnitude of the relative translation. For more complicated models, individual rotations and relative translation become coupled. It then becomes impractical to introduce harmonic approximations to any of the translational and rotational degrees of freedom.
Rigid-body model
Equation 6 can be interpreted as the expression for the association constant of two proteins modeled as rigid bodies that are interacting with an interaction potential U(r, ω). One expects U(r, ω) to have a deep minimum, which identifies the bound state. As already alluded to, the bound state is not just a single configuration of the complex. Configurational sampling around the energy minimum must take place in the bound state, and the integral in Eq. 6 should reflect this sampling. It is clear that Ka is not solely determined by the minimum interaction energy, Um, in the bound state. Equally important are the variation of the interaction energy with relative motion and the size of the configurational space of the bound state. Unfortunately, x-ray crystallography cannot tell the extent of configurational space sampled by the constituent proteins in the bound state. Some relative motion around the energy minimum is prevented by steric clashes between the subunits. Steric clashes thus set an inner boundary for the bound state. The outer boundary remains to be specified.
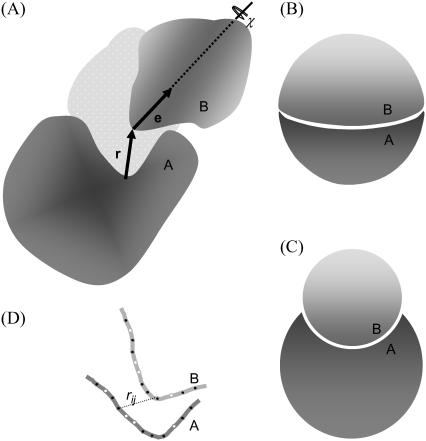
In this study we specify the six relative translational and rotational degrees of freedom of the bound state in the following way (see Fig. 1 A). Protein A is fixed in space, with the center of the binding site at the origin of a laboratory-fixed coordinate system. Protein B is allowed to translate and rotate. The position of the binding site of protein B in the laboratory-fixed coordinate system is identified as the relative translation vector r. With the magnitude of the r denoted as r and the direction of r specified by polar and azimuthal angles θ and φ, dr = r2drsinθdθdφ = −r2drdcosθdθdφ. The orientation ω of protein B in the laboratory-fixed coordinate system consists of a body-fixed unit vector e (with the polar and azimuthal angles ξ and ζ) and a rotation angle χ around the unit vector. In terms of these angles, dω = sinξdξdζdχ = −dcosξdζdχ.
FIGURE 1.
(A) Definitions of the three translational (r) and three rotational (e and χ) degrees of freedom. (B) The hemisphere and (C) crater models in their minimum-energy configurations. (D) Side view of the interface between two subunits with two types of interaction sites: filled for h and open for p.
Equation 6 can be rewritten as (4)
 |
(12) |
where the first term is the average Boltzmann factor of the bound state, and the second term 𝒱b = ∫bdrdω/8π2 is the configurational volume of the bound state. If 𝒱b is in units of Å3, then a multiplicative factor of 10−27 NA, where NA is Avogadro's number, is required for Ka to be expressed in units of M−1. In this study Eq. 12 is implemented by sampling r and ω over a region that covers the bound state. A similar sampling approach has been taken by Schlosshauer and Baker (16). In the sampling region r is restricted to between 0 and r0 and cosθ to between cosθ0 and 1. No restrictions are imposed on the other four coordinates, hence φ and ζ are allowed to vary from 0 to 2π, cosξ from −1 to 1, and χ from −π to π. The upper bound r0 is introduced because, among the six degrees of freedom, the relative separation r is the only one for which the span of all possible values (0 to ∞) cannot be fully sampled. In this study we typically set the upper bound r0 to 10 Å. Within r < r0 Å, a certain span of cosθ values may not be allowed due to collision between the subunits (such as in the hemisphere models to be introduced later). The lower bound cosθ0 is introduced to account for this situation.
The total sampling volume in the six-dimensional configurational space is V0 = 16π3(1 − cosθ0)r0 when r, cosθ, φ, cosξ, ζ, and χ are uniformly sampled. Along r, there is a geometric factor r2, which should appear as a weighting factor when the uniform sampling is used to calculate averages. Specifically, r, the average of a quantity A, 〈A〉, is calculated as 〈r2A〉′/〈r2〉′, where 〈⋯〉′ means averaging with uniform sampling. Of all the configurations distributed within the sampling volume, some do not contribute to Ka because they involve steric clashes between the subunits. Let the fraction that avoids clashes be fc. Within this fraction, only a subfraction (fb) is in the bound state. The configurational volume of the bound state is given by
 |
(13a) |
where 〈r2〉′b is the average of r2 over the bound-state configurations, generated with uniform sampling of r. Suppose that, out of M0 initial configurations, M configurations do not have steric clashes, and of these Mb are in the bound state. Then fc = M/M0, fb = Mb/M, and the average Boltzmann factor is given by
 |
(13b) |
The average Boltzmann factor can be used to define a free energy of interaction in the bound state:
 |
(14) |
The magnitude of Gint is expected to be less than that of the minimum energy Um. Now Eq. 12 can be written as
 |
(15) |
Toy models
We implement two type of toy models to illustrate the calculation of the association constant. They have different interface shapes, mimicking in a small measure the great variety of interface shapes of actual proteins. The first, called the hemisphere model, consists of two matching hemispherical proteins (both with a radius denoted by R), which form a whole sphere in the bound state (see Fig. 1 B). The binding site on each subunit is a flat circle with an area S = πR2. The second toy model, called the crater model, consists of a spherical protein with a crater to which another spherical protein snugly fits in the bound state (see Fig. 1 C). The radii of the two proteins are denoted as RA and RB, respectively. In this case the binding site is curved on each side. If the polar angle spanned by the binding site on protein B is γ, then the interface area is  . In this study cosγ is set to 0.5, so the interface areas of the two models are identical when R = RB. In both models, the body-fixed unit vector e on protein B is chosen to be the normal vector located at the center of the binding site, pointing toward the interior of the protein. The coordinate systems for r and ω are defined such that the configuration in which the two subunits are perfectly matched corresponds to r = 0, cosθ = cosξ = 1, and χ = 0. Note that for the hemisphere model, when r < R, cosθ must be greater than 0 to avoid collision between the two subunits.
To model interactions, matching loci on the binding sites of the two subunits are randomly selected, with a minimum separation of sm = 3.5 Å among the loci on either side. To ensure stereospecificity of the bound complex, there are two types of interaction loci (labeled h and p). The total numbers of h and p loci are denoted nh and np, respectively. Each locus on protein A potentially interacts with all the loci on protein B and vice versa. The interaction energy between two loci across the interface is a square well (between two h-loci or two p-loci) or square barrier (between an h- and a p-locus), with a width rw = 3.5 Å (see Fig. 1 D). When the two subunits collide, the interaction energy is infinite; otherwise it is given by
 |
(16) |
where I = −1 for two like loci and +1 for two unlike loci, s(r) = 1 if r < rw and 0 otherwise, and u0 is set to 1.57 kBT0, in which T0 is a reference temperature (e.g., 300 °K). Unless otherwise indicated, results will be for the reference temperature. In the perfectly-matched configuration of the complex, the nh h-loci and np p-loci on protein A coincide with their cognate loci on protein B and no other pairs are within interaction range, leading to a total energy of −(nh + np)u0. Note that the energy given by Eq. 16 is discrete.
Two sets of parameters are implemented for both the hemisphere model and the crater model. In the first set, R = 20 Å for the hemisphere model while RA = 25 Å and RB = 20 Å for the crater model. The interface areas of the two models are both 1257 Å2. Over this area 30 interaction loci are distributed, of which 18 were h-loci and 12 are p-loci. In the second set, R = 17 Å for the hemisphere model, while RA = 21 Å and RB = 17 Å for the crater model. The interface areas of the two models are now 908 Å2. Over this area 20 interaction loci are distributed, of which 12 are h-loci and 8 are p-loci. The interaction locus densities are ∼1 in every 45 Å2 of interface area for all models. For easy reference, the hemisphere and crater models with the larger surface area will be denoted as HL and CL, respectively, and the corresponding ones with the smaller interface area will be denoted as HS and CS, respectively. The sampling bounds r0 and cosθ0 for the models are listed in Tables 1 and 2.
TABLE 1.
Transition state and bound state properties of the toy models with an interface area of 1257 Å2
| Variables | Hemisphere model | Crater model | ||
|---|---|---|---|---|
| Sampling range of coordinate | ||||
| r0 (Å) | 10 | 6 | 10 | 6 |
| cosθ0 | 0 | 0 | −1 | −1 |
| Mean and standard deviation of coordinate in transition state | ||||
 (Å) (Å) |
3.3 ± 0.7 | 3.4 ± 0.5 | 3.7 ± 0.9 | 4.0 ± 0.7 |
 |
0.8 ± 0.2 | 0.8 ± 0.2 | 0.7 ± 0.2 | 0.7 ± 0.2 |
 |
3.0 ± 1.8 | 3.0 ± 1.8 | 2.8 ± 1.9 | 3.0 ± 2.0 |
 |
0.995 ± 0.004 | 0.994 ± 0.005 | 0.988 ± 0.011 | 0.987 ± 0.009 |
 |
2.9 ± 1.7 | 2.9 ± 1.7 | 3.6 ± 1.6 | 3.4 ± 1.7 |
 |
0.004 ± 0.15 | −0.001 ± 0.19 | −0.01 ± 0.17 | 0.003 ± 0.20 |
| Energetic and geometric parameters of bound state | ||||
| −βUm | 54.98 | 56.55 | 54.98 | 54.98 |
| −βU‡ | 23.56 | 21.99 | 25.14 | 21.99 |
| 〈exp(−βU)〉b | 6.79 × 10²⁰ | 6.26 × 10²⁰ | 4.44 × 10²⁰ | 3.01 × 10²⁰ |
| −βGint | 47.97 | 47.89 | 47.54 | 47.15 |
| fc | 7.18 × 10⁻³ | 2.52 × 10⁻³ | 1.66 × 10⁻³ | 0.510 × 10⁻³ |
| fb | 2.26 × 10⁻³ | 11.96 × 10⁻³ | 2.10 × 10⁻³ | 14.57 × 10⁻³ |
| 〈r2〉′b (Å2) | 6.75 | 7.13 | 7.54 | 8.78 |
| 𝒱b (10−3 Å3) | 6.88 | 8.10 | 3.31 | 4.92 |
| Ka (1015 M−1) | 2.8 | 3.1 | 0.89 | 0.89 |
TABLE 2.
Transition state and bound state properties of the toy models with an interface area of 908 Å2
| Variables | Hemisphere model | Crater model | ||
|---|---|---|---|---|
| Sampling ranges of coordinate | ||||
| r0 (Å) | 10 | 6 | 10 | 6 |
| cosθ0 | 0 | 0 | −1 | −1 |
| Mean and standard deviation of coordinate in transition state | ||||
 (Å) (Å) |
3.4 ± 0.8 | 3.5 ± 0.7 | 3.5 ± 0.6 | 3.3 ± 0.5 |
 |
0.7 ± 0.2 | 0.7 ± 0.2 | 0.7 ± 0.2 | 0.7 ± 0.2 |
 |
3.0 ± 1.9 | 3.0 ± 1.9 | 3.0 ± 1.8 | 3.1 ± 1.8 |
 |
0.994 ± 0.006 | 0.993 ± 0.007 | 0.986 ± 0.010 | 0.988 ± 0.008 |
 |
3.5 ± 2.1 | 3.5 ± 2.1 | 3.3 ± 1.9 | 3.2 ± 1.9 |
 |
−0.004 ± 0.23 | −0.002 ± 0.25 | −0.03 ± 0.18 | −0.03 ± 0.14 |
| Energetic and geometric parameters of bound state | ||||
| −βUm | 39.27 | 39.27 | 36.13 | 36.13 |
| −βU‡ | 18.85 | 17.28 | 17.28 | 18.85 |
| 〈exp(−βU)〉b | 1.36 × 10¹⁴ | 0.953 × 10¹⁴ | 0.111 × 10¹⁴ | 0.154 × 10¹⁴ |
| −βGint | 32.54 | 32.19 | 30.04 | 30.36 |
| fc | 10.1 × 10⁻³ | 3.54 × 10⁻³ | 2.47 × 10⁻³ | 0.770 × 10⁻³ |
| fb | 2.46 × 10⁻³ | 14.13 × 10⁻³ | 2.09 × 10⁻³ | 9.65 × 10⁻³ |
| 〈r2〉′b (Å2) | 6.55 | 7.23 | 7.37 | 6.58 |
| 𝒱b (10−3 Å3) | 10.2 | 13.6 | 4.78 | 3.69 |
| Ka (108 M−1) | 8.4 | 7.8 | 0.32 | 0.34 |
Outer boundary of bound state and association rate constant
The outer boundary of the bound state dictates the rate constant at which the complex is formed by diffusion. Experimental data on the diffusion-controlled association rate thus provide valuable information for specifying the outer boundary. In the absence of long-range interactions, the diffusion-controlled association rate constant,  , is typically in the range of 105–106 M−1 s−1 (17). The parameters used in the models should lead to values of
  that are in this range. We carry out this important check by calculating
  for each model through Brownian dynamics simulations (18).
The outer boundary of the bound state plays a critical role in the transition-state theory for the protein-protein association (4,5,17). In this theory, the outer boundary is taken to be the transition state, and the association rate constant in the presence of long-range electrostatic interactions is calculated as
 |
(17) |
where Uel is the free energy of long-range electrostatic interactions between the associating proteins, and 〈…〉‡ signifies averaging over the transition state. Note that short-range interactions and long-range electrostatic interactions play separate roles. The former exclusively determine the transition state and thus the prefactor  , while the latter exclusively contribute to the exponential factor. Previous specifications of the transition state have been guided by experimental data (4,19–22); our aim is to establish a theoretical foundation for the transition state of protein-protein association. We test our theoretically based transition state by comparing the prediction of Eq. 17 for the ionic-strength dependence of ka against experimental data.
FUNNEL-LIKE ENERGY LANDSCAPE AND TRANSITION STATE
The toy models are designed to capture two essential properties of protein complexes:
The bound state is located around the bottom of a deep energy well, stabilized by numerous specific interactions.
Small separation and reorientation of the subunits will destroy many of these interactions and lead to the dissociation of the complex. These properties are reminiscent of those for protein folding and suggest a funnel-like energy landscape.
Configurational sampling in toy models
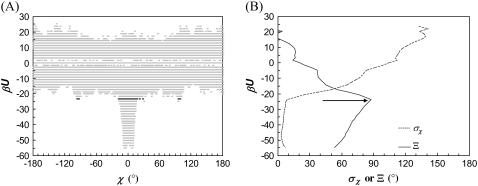
Configurations of the subunits in each model system are randomly generated, with the relative separation (r) restricted to within 10 Å. Each configuration is checked for collision between the subunits. If no collision occurs, the interaction energy is calculated. Typically energy calculations are made on 10 million configurations. Fig. 2 A displays a scatter plot of the interaction energy versus the rotation angle χ for the HL model. A striking feature of the plot is the sudden transition between the bound state in which relative rotation is restricted and interaction between the subunits is strong and the unbound state in which relative rotation is unrestricted but interprotein interaction is weak. This contrast is manifested by the standard deviation of χ (σχ) sampled at different energy levels (Fig. 2 B). The transition can be conveniently located by the parameter
 |
(18) |
which is the difference of the standard deviation of χ at energy level U from the average for all higher energy levels (U′ > U). At the start of the transition from the bound state to the unbound state, Ξ(U) is maximal. We take the corresponding energy level, U‡, as defining the outer boundary of the bound state and the transition state. For the HL model, Fig. 2 B shows βU‡ = 23.56. The corresponding  is 0.15 radians, or, 8.6° (the mean value of χ among the transition-state configurations is close to the expected value of 0). Among the four toy models
  varies from 8° to 14°. Note that the location of the outer boundary of the bound state stays the same even when the value of the energy parameter u0 is changed.
FIGURE 2.
(A) Scatter plot of the interaction energy versus the rotation angle χ for the HL model. For clarity, the full range of χ is evenly divided into 500 bins and each bin contains at most one sampled χ-value at each energy level. The total number of sampled configurations is 107 (r0 = 10 Å). The transition-state energy level is indicated by dark points. (B) The standard deviation of χ and the parameter Ξ (Eq. 18) at different energy levels. An arrow indicates the transition-state energy level, where Ξ is maximal.
Another feature of the U-versus-χ scatter plot is the profile of the lower bounds of the sampled energies at different χ-values. For example, the lower bounds at ±90° are much lower than those at ±120°. The lower bounds in U are reached when the other five coordinates are close to those in the perfectly matched configuration. Starting with the perfectly matched configuration (in which χ = 0°), as the value of χ is changed toward ±180°, the energy shows nearly the same profile as in Fig. 2 A. This profile is a reflection of the distribution of the interaction loci within the binding sites.
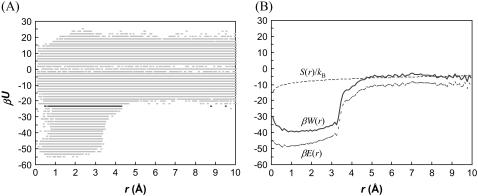
The energies and statistical distributions in χ and the other coordinates for the transition states of the four toy models are listed in Tables 1 and 2. The span of allowed values of the relative separation r experiences a sharp transition, as illustrated by a scatter plot in Fig. 3 A for the HL model, similar to the situation for the rotation angle χ. The transition also occurs at the same energy level U‡ as found in the χ-dependence. The mean values of r among the transition-state configurations of the four toy models all fall within 3 to 4 Å; the standard deviations are between 0.5 and 1 Å.
FIGURE 3.
(A) Scatter plot of the interaction energy versus the relative separation r for the HL model. The full range of r (0–10 Å) is evenly divided into 500 bins and each bin contains at most one sampled r-value at each energy level (out of a total of 107 sampled configurations). (B) The free-energy functional W(r) and its energetic and entropic components.
In contrast to χ and r, sampling along the other four coordinates shows much less variation between the bound and unbound states. Avoidance of collision forces the direction of the translation of subunit B to be away from subunit A (i.e., cosθ > 0). This is so even for the crater models, for which the lower bound of cosθ is set to −1. There are no significant differences in the ranges of cosθ and φ sampled between the bound and unbound states. Avoidance of collision also significantly restricts the direction of the body-fixed unit vector e. Only values of cosξ > 0.8 are sampled in each of the four models (freedom in cosθ and cosξ will eventually be regained when r is greater than the sum of the subunit radii), with values in the bound state restricted to ∼0.98, corresponding to a polar angle of ∼10°. Because of the restriction on cosξ, there is apparent freedom in the azimuthal angle ζ of the unit vector e (note that the value of ζ is irrelevant at cosξ = 1).
Though it is not possible to sample the full span of possible r values (0 to ∞), the regions of interest, i.e., the bound state and the transition to the unbound state, occur well below the upper bound r0 = 10 Å and hence are well sampled. To make sure that conclusions are not influenced by the specific value of r0, the configurational spaces of the four toy models are also sampled with r0 = 6 Å. All the main results presented above are confirmed, with a possible small shift in U‡ (Tables 1 and 2).
Free energy functional along r
Along the r coordinate, the interplay between interaction energy and configurational freedom in the transition from the bound state to the unbound state can be elucidated by separating the Boltzmann weight into energetic and entropic contributions. The energy function E(r) can be defined from the average Boltzmann factor among the N(r) allowed configurations in a bin [r − Δr/2, r + Δr/2]:
 |
(19a) |
Note that E(r) = 0 as r → ∞. The entropy function can be defined by scaling the number of allowed configurations with the expected number if collisions were not considered,
 |
(19b) |
where M is the total number of allowed configurations collected over the sampling volume V0 = 16π3(1 − cosθ0)r0. Note also that S(r) = 0 as r → ∞. A free energy functional can then be defined accordingly,
 |
(19c) |
Fig. 3 B displays the free energy functional and its energetic and entropic components for the HL model. Note that, even at r = 10 Å, βE(r) and S(r)/kB are still quite significant (at ∼−10 and −4, respectively). The interactions contributing to E(r) at such large separations between the centers of the binding sites come from loci on the peripheries of the binding sites. These interactions may hold the subunits together to allow them time to search for the bound state. Such an “entrapment” effect has been seen in Brownian dynamics simulations (23). The energy and entropy functions have very different dependences on r. E(r) decreases sharply as the subunits enter the bound state (at around the mean r-value, 3.4 Å, of the transition-state configurations). The change in S(r) is more gradual. The asynchronous changes in E(r) and S(r) do not seem to lead to a significant free-energy barrier, unlike what was speculated previously (5). How the change in internal degrees of freedom during the association process affects the energy and entropy functionals remains to be studied.
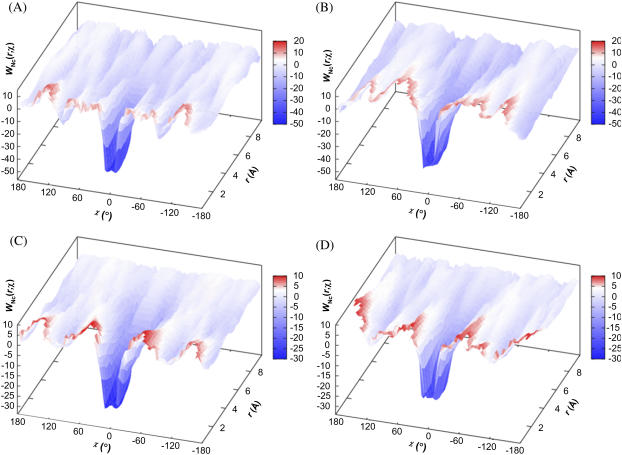
A similar free energy functional, W(r, χ), which depends both on r and χ, can also be defined. The energy component is again given by the average Boltzmann factor according to Eq. 19a, but with N(r) replaced by N(r, χ), the number of allowed configurations within a two-dimensional grid with r in [r − Δr/2, r + Δr/2] and χ in [χ − Δχ/2, χ + Δχ/2]. The entropy component is given by Eq. 19b, but with N(r) in the numerator replaced by N(r, χ) and an additional factor, 2π/Δχ, is inserted. Fig. 4, A–D, displays W(r, χ) for the four toy models. The functional presents a funnel-like energy landscape, with the deep well of the bound state surrounded by a broad shallow basin.
FIGURE 4.
The free-energy functional W(r, χ) for the (A) HL, (B) CL, (C) HS, and (D) CS models.
Number of contacts—surrogate for interaction energy
Our aim is to extend the study of protein-protein association from toy models to actual protein-protein complexes. In that case, calculation of interaction energies based on realistic molecular models becomes a formidable challenge. Therefore we have sought alternatives to the interaction energy for obtaining the energy landscape of protein-protein association.
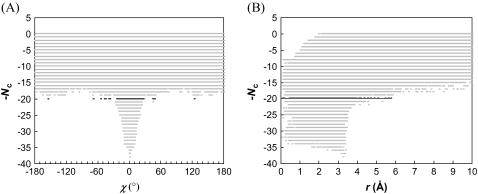
Inspired by the use of contacts in studying protein folding, we have tested different contact-based choices and found a reasonable surrogate in Nc, the sum of native contacts and nonnative contacts. The former are taken as formed by cognate pairs of interaction loci within a distance of rw = 3.5 Å whereas the latter are taken as formed by noncognate pairs of interaction loci within a shorter distance threshold rw′ = 2.5 Å. Scatter plots of Nc versus the rotation angle χ and the relative separation r are shown in Fig. 5, A and B, for the HL model. These pictures are qualitatively very similar to those found for the interaction energy (see Figs. 2 A and 3 A). In the Nc-versus-r scatter plot, a void appears at the r = 0 and Nc = 0 corner, because when the separation is small the two subunits will inevitably make at least a few contacts. The transition-state Nc level,  , can be found from the maximum of the parameter Ξ(Nc) that is defined analogous to Eq. 18. The value of
  thus found is 20, 21, 15, and 14, respectively, for the HL, CL, HS, and CS models.
FIGURE 5.
Scatter plots of the total contact number versus (A) the rotation angle χ and (B) relative separation r for the HL model. Dark points indicate  .
.
The transition-state configurations obtained with Nc are very similar to those obtained with energy. The average energies of the Nc-based transition-state configurations are 24, 25, 23, and 18, respectively, in units of kBT. These are close to the values of βU‡ listed in Tables 1 and 2. In addition, the means and standard deviations of the six coordinates in the Nc-based transition-state configurations are close to their energy-based counterparts (data not shown).
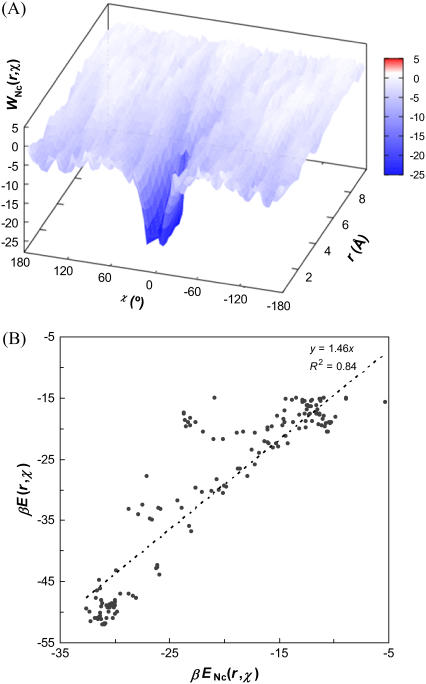
A “free-energy functional” WNc(r) can be defined analogous to W(r), with −βU in Eq. 19a replaced by Nc. Note that the entropic components of WNc(r) and W(r) are identical. The energetic component ENc(r) shows high correlation with its counterpart E(r) (e.g., with R2 = 0.97 for the HL model). Similarly, in analogy to W(r, χ), a two-dimensional free energy functional, WNc(r, χ), can be defined. Fig. 6 A displays this functional for the HL model, which presents the same funnel-like energy landscape as seen in Fig. 4 A. The correlation between ENc(r, χ) and ENc(r, χ), when the latter is <−15 kBT, is shown in Fig. 6 B for the HL model.
FIGURE 6.
(A) The free-energy functional WNc(r, χ) for the HL model. (B) Correlation of the energetic component ENc(r, χ) with its counterpart E(r, χ). The values of the latter is restricted to <−15 kBT. This range of values covers the bound state and much of the transition region to the unbound state (correlation outside this range deteriorates). The line of linear regression (with zero intercept) is shown.
Barnase-barstar complex
The formalism developed for the toy models can be directly applied to actual protein-protein complexes. For illustration, here we present the application to the barnase-barstar complex, a system that has been studied extensively (4,5,19,21,24–30). We treat each subunit as a rigid body. The binding sites on the two subunits are identified by heavy atoms making interfacial contacts which are <5 Å in the x-ray structure of the complex (Protein Data Bank entry 1brs chains C and F; Fig. 7) (25). There are a total of 109 such atoms on the barnase side and 101 on the barstar side. The geometric center of this collection of interface atoms and the normal vector of their least-square plane are used to define the coordinate systems for r and ω. The laboratory-fixed coordinate system has its origin at the geometric center and its z axis along the normal vector. Barnase is then fixed in this coordinate system. The geometric center and the normal vector is body-fixed on barstar, which is then allowed to translate and rotate. The position of the geometric center fixed on barstar defines r; the normal vector fixed on barstar becomes the body-fixed unit vector e, which together with a rotation angle χ define ω. The x-ray structure corresponds to r = 0, cosθ = cosξ = 1, and χ = 0.
FIGURE 7.
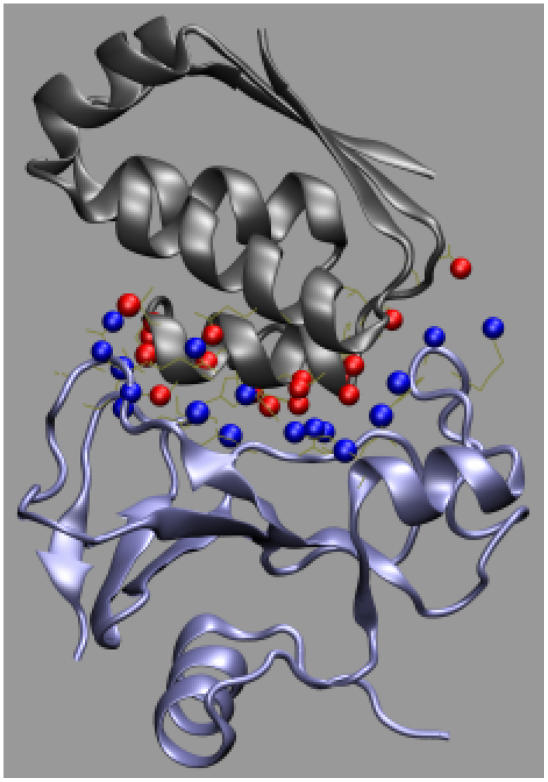
The interaction-locus atoms of the barnase-barstar complex. Barnase and barstar are shown in blue and gray, respectively; the interaction-locus atoms are shown as blue or red spheres.
Interaction loci are identified from the collection of interface atoms. For each interface atom, the shortest cross-interface contact with a heavy atom in the x-ray structure is found. All such cross-interface contacts are then sorted in ascending order of contact distances. If a contact-forming atom is within sm = 3.5 Å of an atom on the same protein which forms a shorter contact, the longer contact is eliminated from the list. In the end, a total of 17 distinct contacts are retained. Fig. 7 displays the interaction loci, i.e., atoms forming those cognate contacts. For each interaction-locus atom, a contact radius is defined as half of the contact distance with its partner.
For configurations that do not involve steric collision between the two subunits, the number of contacts, Nc, is found by summing the number of native and nonnative contacts. A native contact is formed by an interaction-locus atom with its cognate partner, with a distance that is not longer than the value found in the x-ray structure by rw = 3.5 Å. A nonnative contact is formed by a noncognate pair of interaction-locus atoms, with a distance that is not longer than the sum of their contact radii by rw′ = 2.5 Å. In particular, in their x-ray structure, there are 21 nonnative contacts in addition to the 17 native contacts, resulting in Nc = 38. Steric collision is detected whenever a pair of atoms on the two subunits is closer than a collision distance. For the purpose of detecting collision, atoms are classified into three types: hydrogen, polar (nitrogen and oxygen), and nonpolar (carbon and others). The collision distance within one type or between two types of atoms is set to the minimum distance of such contacts in the x-ray structure of the complex. The resulting collision distances are: 2.64 Å between polar atoms, 3.48 Å between nonpolar atoms, 3.11 Å between polar and nonpolar pairs, 2.14 Å between hydrogens, 1.63 Å between polar and hydrogen atoms, and 2.51 Å between nonpolar and hydrogen atoms.
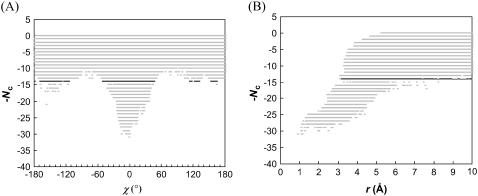
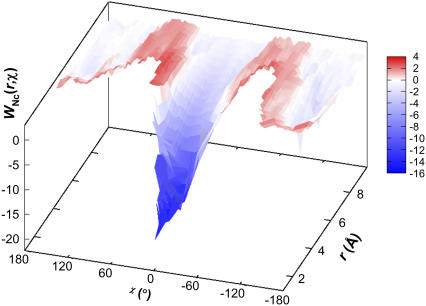
Scatter plots of Nc versus the rotation angle χ and the relative separation r are shown in Fig. 8 for the barnase-barstar complex. These plots show resemblance to corresponding plots for the toy models (see Fig. 5). The transition from the bound to the unbound state occurs at Nc = 14 for configurations sampled with r0 = 6 Å. The mean and standard deviation of χ in the transition-state configurations are 0.01 and 0.31 radians (or 0.6° and 18°), respectively. The mean and standard deviation of r in the transition state are 4.9 and 0.5 Å, respectively. These and other statistics of the transition state are collected in Table 3. Representative configurations in the transition state are shown in Fig. 9. In Fig. 10 we display the free-energy functional WNc(r, χ). Similar to the situation found in the toy models (see Fig. 6 A), this functional exhibits a funnel leading to the minimum-energy configuration (as given by the x-ray structure of the complex).
FIGURE 8.
Scatter plots of the total contact number versus (A) the rotation angle χ and (B) relative separation r for the barnase-barstar complex. Dark points indicate  . To ensure adequate sampling of the whole range of r from 0 to 10 Å, three independent runs are carried out with the upper bound of r set to 4, 6, and 10 Å, respectively. The sampled configurations are then combined.
TABLE 3.
Transition state and bound state properties of barnase-barstar complex
| r0 (Å) | 6 |
| cosθ0 | −1 |
 (Å) (Å) |
4.9 ± 0.5 |
 |
0.89 ± 0.08 |
 |
3.2 ± 2.5 |
 |
0.92 ± 0.05 |
 |
2.8 ± 1.7 |
 |
0.01 ± 0.31 |
| Nc;max | 30 |
 |
14 |
| fc | 0.101 × 10⁻³ |
| fb | 0.059 |
| 〈r2〉′b (Å2) | 19.5 |
| 𝒱b (10−3 Å3) | 8.75 |
| Interface area (Å2)* | 797 |
| Ka (1012 M−1)† | 8 |
Taken as half of the buried solvent-accessible area calculated with a 1.4 Å probe radius.
Schreiber and Fersht (24). The value listed is for an ionic strength of 125 mM.
FIGURE 9.
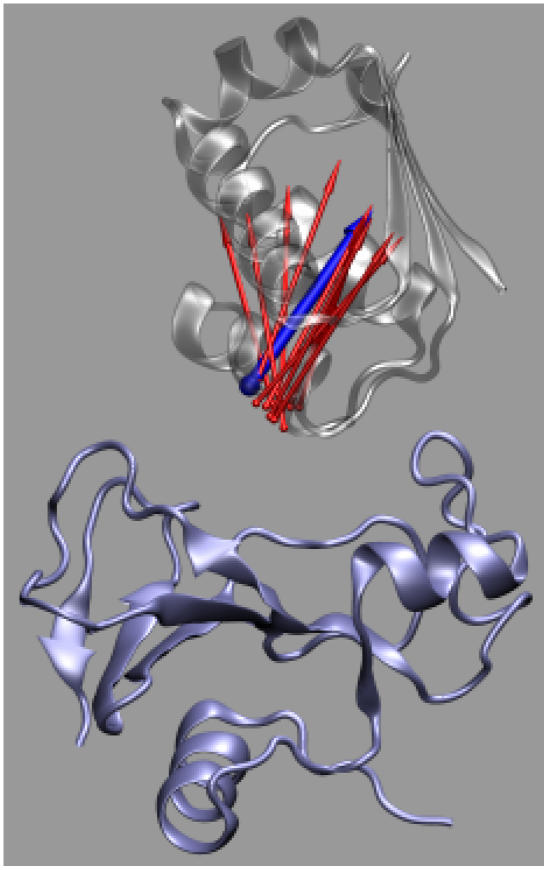
Representative transition-state configurations. Barnase, shown in blue, is fixed in the laboratory frame whereas barstar is allowed to translate and rotate. The body-fixed unit vector e on barstar in different configurations is shown as arrows. For one particular configuration, the arrow is in blue and the corresponding structure of barstar is shown in gray.
FIGURE 10.
The free-energy functional WNc(r, χ) for the barnase-barstar complex. Regions not covered by the free-energy surface are not sampled.
While the transition from the unbound to the bound state is qualitatively similar to those in the toy models, a major difference in the barnase-barstar complex is that the interface involves atomic details. Because of this, when the relative separation is small, collision between the subunits can be avoided only if they are nearly aligned for complex formation. In particular, at small r rotation around the body-fixed unit vector becomes very restricted, and only a narrow range of χ around 0° can be sampled. This explains why in Fig. 10 the WNc(r, χ) surface does not cover the full sampled range of χ.
Comparing Fig. 8 A with Fig. 5 A, it can be seen that fluctuations in the lower bounds of the sampled Nc values across the range of χ are much more prominent in the barnase-barstar complex. In the toy models, the variation of the lower bounds of Nc with χ reflects the distribution of the interaction loci within the interface. Unlike in the toy models, a change in χ in the barnase-barstar complex can lead to collision between the proteins. Avoidance of collision thus introduces additional variations in the lower bounds of Nc. Alignment of the proteins at small separations required by avoidance of collision also explains the expanded void at the r = 0 and Nc = 0 corner in the Nc-versus-r scatter plot (comparing Fig. 8 B against Fig. 5 B). As the proteins are more aligned, more contacts will also form.
EQUILIBRIUM AND KINETICS OF ASSOCIATION
As described in the previous section, the outer boundary of the bound state is specified as the transition region in translational and rotational freedom on going from the bound to the unbound state. This specification allows for an unambiguous calculation of the association constant from the integration in Eq. 6. On the other hand, the numerical value of Ka should not be sensitive to the precise specification of the outer boundary of the integration.
Determination of Ka
Tables 1 and 2 list geometric and energetic information for the bound state of the toy models. The operational definition of the bound state is given by the energetic criterion U ≤ U‡. As noted in the previous section, the relative separation and orientation between the two proteins in the bound state are severely restricted. Specifically, the separation distance r is restricted to within ∼4 Å, the direction of the body-fixed unit vector e on protein B is restricted to within ∼10°, and rotation around this vector is restricted to within ∼15°. The resulting configurational volume of the bound state is ∼10−2 Å3. The free energy of interaction in the bound state, Gint, defined in terms of the average Boltzmann factor via Eq. 14, is ∼5–10 kBT higher than the minimum-energy (Um) found from configurational sampling. The association constant is 2.8 × 10¹⁵ and 0.89 × 10¹⁵ M−1, respectively, for the HL and CL models and 8.4 × 10⁸ and 0.32 × 10⁸ M−1, respectively, for the HL and CL models.
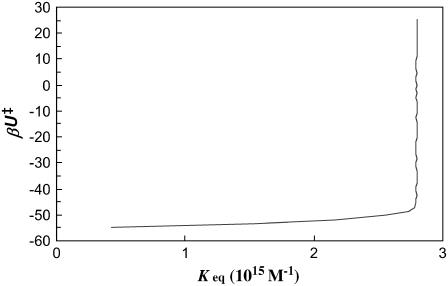
To illustrate the insensitivity of the value of Ka to the precise specification of the outer boundary of the bound state, in Fig. 11 we plot Ka for the HL model calculated at different levels of βU‡. It can be seen that essentially the same value of Ka is obtained from the sampled configurations as long as βU‡ > −48. When the bound state is located in a deep energy well, the integral of the Boltzmann factor for evaluating Ka (Eq. 6) is dominated by a small region around the energy minimum, and the precise specification of the limits of the integral has no consequence on the numerical value of Ka. This is the same reason why the method of steepest descent works so well for evaluating integrals of functions with sharp maxima. However, as the sampling volume increases, eventually the integration and the resulting Ka value go to infinity.
FIGURE 11.
Calculated value of Ka versus the energy level used to define the outer boundary of the bound state.
The values of Ka calculated with configurations sampled with r0 = 10 and 6 Å are essentially identical. This is despite the fact that in the latter configurations the collision-free fraction fc is lower by approximately threefold and the bound fraction fb is higher by approximately sixfold. Moreover, the configurational volumes of the bound state obtained from the two sets of sampling agree closely. For the HL model, the minimum interaction energy obtained from the r0 = 6 Å configurations is lower by one level, indicating that there is uncertainty in obtaining the absolute minimum interaction energy by sampling.
Configurational volume of bound state
While the calculation of the association constant using different specifications of the outer boundary of the bound state confirms that the numerical value of Ka is unequivocally determined, it does indicate that the further breakup of Ka into the average Boltzmann factor and the configurational volume (Eq. 12) is to a certain extent arbitrary. On the other hand, the diffusion-controlled rate to reach the bound state is sensitive to the size of the configurational volume, hence data on  serve as a determinant of 𝒱b.
We have carried out Brownian dynamics simulations to calculate the diffusion-controlled rate constant to reach the bound state, using an algorithm developed previously (18). With the outer boundary of the bound state as specified in Tables 1 and 2,  is found to vary from 0.6 × 10⁵ to 3.7 × 10⁵ M−1 s−1 for the four models. These values fall within the range of 105 to 106 M−1 s−1 observed experimentally for the diffusion-controlled association of proteins in the absence of long-range electrostatic enhancement (17). Thus our specification of the outer boundary of the bound state appears reasonable. Again, the configurational volume of the bound state thus obtained is ∼10−2 Å3.
In the previous section it is seen that, according to statistics of the six translational and rotational coordinates of sampled configurations, the transition state obtained with the number of contacts, Nc, closely mimics that obtained with energy. The configurational volume of the bound state calculated with the two approaches also agrees to within a factor of 3, as does  , the diffusion-controlled rate constant for reaching the bound state.
Effects of mutations
In theoretical studies of the effects of mutations on the association constant, a common practice is to calculate mutational effects on the interaction energy in the x-ray structure of the complex (28,31,32). This is equivalent to the approximation
 |
(20) |
where Ka;wt and Ka;mt are the association constants of the wild-type and mutant complex, and ΔUm is the average change, due to the mutation, in interaction energy of the minimum-energy configurations of the wild-type complex. We now have an opportunity to test this approximation.
Ten single, double, triple, quintuple, and decuple mutations each are made by deleting 1, 2, 3, 5, or 10 interaction loci on subunit A of the CL model. For the single mutations, the mutation loci are selected randomly. For the other mutations, the most closely clustered sets of loci are selected. The association constant for each mutant is then calculated in the same way as the original (“wild-type”) CL model.
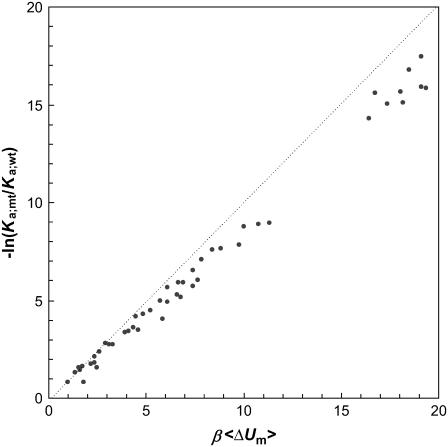
For the wild-type CL model, 38 configurations are found to have the minimum energy Um = −54.98 kBT. The mutations are applied to these configurations, and the changes in the interaction energy (from Um) are averaged to obtain 〈ΔUm〉. In Fig. 12 the results for the total of 50 mutations are compared with the corresponding values for −kBT ln(Ka;mt/Ka;wt). A good correlation is seen, but 〈ΔUm〉 overestimates the magnitude of −kBT ln(Ka;mt/Ka;wt) by 10–20%.
FIGURE 12.
Comparison of the effect of mutation on the association constant and the average change in interaction energy in the minimum-energy configurations of the wild-type CL model. The diagonal line indicated perfect agreement.
A useful approach for isolating the energetic contribution of a particular interaction to −kBT lnKa is the double mutant cycle (26). If locus X of protein A interacts with locus Y of protein B, then
 |
(21) |
approximates the contribution of the X-Y interaction. Here X → 0 represents a deletion mutation. The relation between ΔΔGint and the interaction energy between X and Y in the minimum-energy configuration is tested on the CL model. For 10 randomly selected interaction loci on subunit A, deletion mutations decrease lnKa by 0.8 −2.3 (these results are part of what is shown in Fig. 12). Deletions of their cognate partners on subunit B decrease lnKa by 0.3–2.5. When both partners are deleted, the change in lnKa ranges from −0.7 to 2.8. Applying the double mutant cycle, we obtain values of ΔΔGint with an average of −1.45 and a root mean-square deviation of 0.22. The average, multiplied kBT, is very close to the contribution of a cognate pair of interaction loci, i.e., −u0 = −1.57 kBT.
Enthalpy-entropy decomposition
Elsewhere in the article results are for a specific temperature, T = T0. Here we examine the temperature dependence of Ka. This dependence allows for the decomposition of −kBT lnKa into enthalpy and entropy. As shown by Eq. 7c, −kBT lnKa represents the standard chemical-potential change upon association. The enthalpy and entropy components of Δμ° are
 |
(22a) |
 |
(22b) |
We focus on the particular situation where the interaction potential U(r, ω) is temperature-independent. One consequence of the temperature independence is that the same specification of the outer boundary of the bound state can be used for all temperatures.
Equation 9 for the spherical model suggests that Ka can be separated into a factor with an exponential dependence on β = (kBT)−1 and a factor with a power-law dependence on β. For the more general expression of Ka, given by Eq. 6, we can write
 |
(23a) |
where Um is the minimum energy in the bound state and
 |
(23b) |
As noted earlier, the integration of Eq. 23b is dominated by a small region around the energy minimum. In this region, the harmonic approximation may be applicable. In that case, each degree of freedom contributes a factor β−1/2 (see Eq. 9). Since there are six degrees of freedom, we expect the prefactor  to depend on β as β−3.
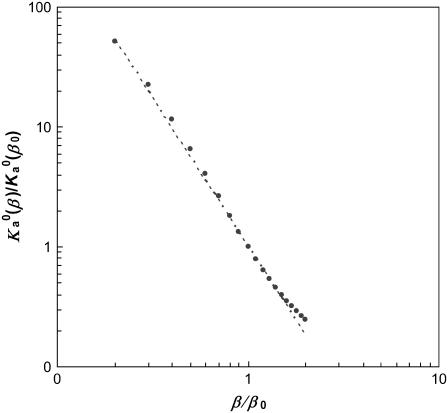
We find that  indeed has a power-law dependence on β for all the four toy models, as illustrated in Fig. 13 for the HL model. The power for all four models is ∼2.5 instead of 3, hence
 |
(23c) |
where β0 = (kBT0)−1. The enthalpy and entropy components are then given by
 |
(24a) |
 |
(24b) |
FIGURE 13.
Temperature dependence of the prefactor  of the association constant. The line shows the power-law dependence,
  .
.
When the interaction potential U(r, ω) is temperature-independent, the enthalpy component differs from the minimum energy by just a few kBT. Both solvent effects and conformational fluctuations within the protein molecules will introduce temperature dependence to the interaction potential U(r, ω). In that case, there will no longer be simple relations between the enthalpy component and the minimum interaction energy.
For the toy models, varying temperature is equivalent to changing the energy parameter u0 at a fixed temperature. We have thus also seen how Ka is affected by u0.
Test on transition state of barnase-barstar complex
As shown in Table 3, the configurational space explored by the bound state of the barnase-barstar complex is similar to those of the toy models. In particular, the configurational volume of the bound state, at 8.75 × 10⁻³ Å3, is similar to those found for the toy models. With an experimentally determined value of 8 × 10¹² M−1 (24), we may use Eq. 12 to deduce a value of 1.5 × 10¹⁸ for the average Boltzmann factor. This corresponds to a free energy of interaction of Gint = −42 kBT. Assuming a 7 kBT gap between the minimum interaction energy Um and Gint, one finds Um = −49 kBT. Since we find 38 distinct contacts between the two proteins in the x-ray structure, on average each of these contacts apparently contributes ∼1.3 kBT, or ∼0.8 kcal/mol, to the binding of the proteins. Compared to the value of 38 for Nc in the x-ray structure, the maximum value found by configurational sampling is only 31. The failure to obtain a higher Nc;max is largely due to the rigid-body treatment of the proteins.
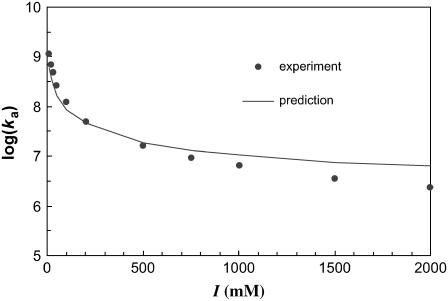
With the outer boundary of the bound state specified as the transition region in translational and rotational freedom, the diffusion-controlled rate constant for reaching the bound state in the absence of long-range electrostatic enhancement, obtained by Brownian dynamics simulations, is 1.8 × 10⁵ M−1 s−1, which falls within the expected range. We have also carried out another critical test on the transition state of the barnase-barstar complex. The electrostatic interaction free energy in the transition state is calculated over 100 representative configurations for the ionic-strength range of 10–2000 mM. Equation 17 is then used to predict the association rate constant at different ionic strengths. Fig. 14 displays the comparison between predicted results for ka and experimental data of Schreiber and Fersht (27). With  , good agreement is seen for the full range of ionic strength. That the
  value obtained from Brownian dynamics simulations is somewhat lower than what is required for fitting with the experimental data is to be expected; some of the configurations rejected due to steric collision in the rigid-body treatment of the proteins in the Brownian dynamics simulations would be allowed for real, flexible proteins, leading to a higher
  .
.
FIGURE 14.
Predicted and experimental results for the ionic-strength dependence of the barnase-barstar association rate.
DISCUSSION
We have used two types of toy models of protein-protein association to explore the configurational space in the bound state and in the transition region to the unbound state. The models are driven by two key observations: numerous specific interactions stabilize the bound state, and these interactions are lost quickly upon small translation and rotation between the partner proteins, leading to the dissociation of their complex. On going from the bound state to the unbound state, both the energy function and the sampling ranges of translational and rotational coordinates experience a sharp increase. The increase allows for the specification of the outer boundary of the bound state as well as the transition state for association. The energy landscape is funnel-like, with the deep well of the bound state surrounded by a broad shallow basin. The basin arises from the presence of one or a few loosely formed native contacts. Some of the features of this energy landscape has been seen in previous studies (16,33).
Our specification of the transition state, based on theoretical analyses, is in broad agreement with conclusions drawn from experimental data. For example, Vijyakumar et al. (4) and Frisch (34), based on effects of mutations on the association rate of barnase and barstar, have concluded that in the transition state the two proteins are prealigned and solvent-separated. Miyashita et al. (22) quantitatively analyzed mutational data for the association between cytochrome c2 and a bacterial reaction center and obtained a transition state that appears similar to our specification. In particular, they found the standard deviation of the rotation angle (corresponding to our χ-angle) to be ∼9°. We have also validated the specification of the transition state by comparing predicted and experimental effects of ionic strength on the association rate of barnase and barstar.
Dissection of association constant
It is obviously desirable to relate the association constant of a protein-protein complex to interactions in the x-ray structure of the complex. A step in bridging the two is Eq. 15, in which −kBT lnKa is separated into the free energy of interaction, Gint, in the bound state, and a term determined by the configurational volume 𝒱b of the bound state. Our study with the toy models suggest 𝒱b is of the order of 10−2 Å3. It further suggests that Gint is higher than the interaction energy in the x-ray structure of the complex by 5–10 kBT. Taken together, we conclude that, when dissecting −kBT lnKa into contributions from individual interactions found in the x-ray structure, its magnitude should be increased by 17–22 kBT (assuming that Ka is in units of M−1). This increase is to account for the fact that Ka is determined by an ensemble of configurations in the bound state, rather than just the single configuration found in the x-ray structure.
Calculations with the toy models suggest that the change of the interaction energy in the x-ray structure by mutation predicts reasonably well the effect on −kBT lnKa. The former appears to overestimates the latter by 10–20% in magnitude. The double mutant cycle is shown to be able to isolate the energetic contribution of an individual interaction.
Mechanism of protein-protein association
The outer boundary of the bound state, marked by a sharp transition in translational and rotational freedom, has been identified as the transition state for protein-protein association. There are two lines of evidence in support of this identification. First, the diffusion-controlled rate for reaching this “transition state” is in the expected range of values. Second, this identification puts the transition state in close proximity to the bound state. Such proximity was actually proposed previously (5) in explaining a common kinetic feature observed in a wide of protein-protein complexes. The association and dissociation rates have disparate ionic-strength dependences, with the former showing strong dependence whereas the latter showed relative insensitivity. The basis of that explanation was Eq. 17. Because of the proximity of the bound and transition states, Gint and 〈Uel〉‡ are expected to show similar ionic-strength dependence, hence the insensitivity of kd to and the strong dependence of ka on ionic strength. In this study we have gone one step further, quantitatively rationalizing the ionic-strength dependence of the barnase-barstar association rate.
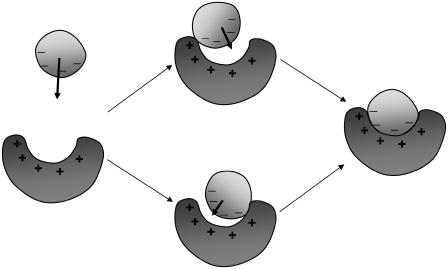
In our formalism of protein-protein association, short-range and long-range interactions have been treated separately. The former are used to specify the transition state, and the latter are then introduced for calculating association rate enhancement. In well-separated configurations, short-range interactions can be ignored; however, both in the bound state and in the broad surrounding basin, the two types of interactions are in play at the same time. The following mechanism of association emerges (Fig. 15). From afar, long-range electrostatic interactions bias the associating proteins, both in separation and in orientation, toward a broad basin around the bound state. Inside the broad basin, subsets of native contacts hold the subunits together and open parallel pathways for them to reach the transition state. After passing the transition state, the subunits undergo fine-tuning in translation and rotation and internal degrees of freedom (e.g., side-chains rotamers) rearrange to achieve stereospecific fit between the two sides. Recently Brownian dynamics and molecular dynamics simulations have provided molecular details on the pathways to reach the transition state and the bound state (35). There is ample similarity between protein-protein association and protein folding.
FIGURE 15.
Illustration of the mechanism of protein-protein association. The plus (+) and minus (–) signs indicate long-range electrostatic interactions or short-range native interactions. Arrows indicate translation toward the basin around the bound state or into the bound state (rotation is not shown). In the basin subsets of short ranges, native interactions are present.
Folding upon association
Our formalism of protein-protein association has focused on proteins that are relatively rigid, such that internal fluctuations can be separated from overall translation and rotation. The situation where one or both subunits are unstructured before association or otherwise undergo significant conformational changes is not addressed. The association kinetics of such systems will likely involve new mechanisms in which protein folding or conformational transition and association are coupled (1,36,37). As far as the association equilibrium is concerned, we can introduce a fictitious intermediate state in which the two subunits are unbound but take their conformations in the bound state. Then the overall association constant Ka is the product of the equilibrium constants between the unbound and intermediate states (Kc) and between the intermediate and bound states (Ka′). Our formalism for association applies to the latter equilibrium. The former equilibrium involves intramolecular conformational transitions. Since the proteins prefer the unbound conformations over the bound ones when separated, we must have Kc ≪ 1. Thus in general the association constants of unstructured proteins will be substantially lower than their structured counterparts.
Acknowledgments
This work was supported in part by National Institutes of Health grant No. GM58187.
References
- 1.Zhou, H.-X. 2005. How do biomolecular systems speed up and regulate rates of processes? Phys. Biol. 2:R1–R25. [DOI] [PubMed] [Google Scholar]
- 2.Chan, H. S., and K. A. Dill. 1998. Protein folding in the landscape perspective: chevron plots and non-Arrhenius kinetics. Proteins. 30:2–33. [DOI] [PubMed] [Google Scholar]
- 3.Go, N., and H. Taketomi. 1978. Respective roles of short- and long-range interactions in protein folding. Proc. Natl. Acad. Sci. USA. 75:559–563. [DOI] [PMC free article] [PubMed] [Google Scholar]
- 4.Vijayakumar, M., K.-Y. Wong, G. Schreiber, A. R. Fersht, A. Szabo, and H.-X. Zhou. 1998. Electrostatic enhancement of diffusion-controlled protein-protein association: comparison of theory and experiment on barnase and barstar. J. Mol. Biol. 278:1015–1024. [DOI] [PubMed] [Google Scholar]
- 5.Zhou, H.-X. 2001. Disparate ionic-strength dependencies of on and off rates in protein–protein association. Biopolymers. 59:427–433. [DOI] [PubMed] [Google Scholar]
- 6.Shoup, D., and A. Szabo. 1982. Role of diffusion in ligand binding to macromolecules and cell-bound receptors. Biophys. J. 40:33–39. [DOI] [PMC free article] [PubMed] [Google Scholar]
- 7.Gilson, M. K., J. A. Given, B. L. Bush, and J. A. McCammon. 1997. The statistical-thermodynamic basis for computation of binding affinities: a critical review. Biophys. J. 72:1047–1069. [DOI] [PMC free article] [PubMed] [Google Scholar]
- 8.Ben-Tal, N., B. Honig, C. K. Bagdassarian, and A. Ben-Shaul. 2000. Association entropy in adsorption processes. Biophys. J. 79:1180–1187. [DOI] [PMC free article] [PubMed] [Google Scholar]
- 9.Luo, H., and K. Sharp. 2002. On the calculation of absolute macromolecular binding free energies. Proc. Natl. Acad. Sci. USA. 99:10399–10404. [DOI] [PMC free article] [PubMed] [Google Scholar]
- 10.Swanson, J. M., R. H. Henchman, and J. A. McCammon. 2004. Revisiting free energy calculations: a theoretical connection to MM/PBSA and direct calculation of the association free energy. Biophys. J. 86:67–74. [DOI] [PMC free article] [PubMed] [Google Scholar]
- 11.Mihailescu, M., and M. K. Gilson. 2004. On the theory of noncovalent binding. Biophys. J. 87:23–36. [DOI] [PMC free article] [PubMed] [Google Scholar]
- 12.Woo, H.-J., and B. Roux. 2005. Calculation of absolute protein–ligand binding free energy from computer simulations. Proc. Natl. Acad. Sci. USA. 102:6825–6830. [DOI] [PMC free article] [PubMed] [Google Scholar]
- 13.Hill, T. L. 1986. An Introduction to Statistical Thermodynamics. Dover Publications, New York.
- 14.Lipari, G., and A. Szabo. 1982. Model-free approach to the interpretation of nuclear magnetic resonance relaxation in macromolecules. 1. Theory and range of validity. J. Am. Chem. Soc. 104:4546–4559. [Google Scholar]
- 15.Tidor, B., and M. Karplus. 1994. The contribution of vibrational entropy to molecular association: the dimerization of insulin. J. Mol. Biol. 238:405–414. [DOI] [PubMed] [Google Scholar]
- 16.Schlosshauer, M., and D. Baker. 2004. Realistic protein-protein association rates from a simple diffusional model neglecting long-range interactions, free energy barriers, and landscape ruggedness. Protein Sci. 13:1660–1669. [DOI] [PMC free article] [PubMed] [Google Scholar]
- 17.Zhou, H.-X. 1997. Enhancement of protein-protein association rate by interaction potential: accuracy of prediction based on local Boltzmann factor. Biophys. J. 73:2441–2445. [DOI] [PMC free article] [PubMed] [Google Scholar]
- 18.Zhou, H.-X., and A. Szabo. 1996. Theory and simulation of the time-dependent rate coefficients of diffusion-influenced reactions. Biophys. J. 71:2440–2457. [DOI] [PMC free article] [PubMed] [Google Scholar]
- 19.Gabdoulline, R. R., and R. C. Wade. 1997. Simulation of the diffusional association of barnase and barstar. Biophys. J. 72:1917–1929. [DOI] [PMC free article] [PubMed] [Google Scholar]
- 20.Elcock, A. H., R. R. Gabdoulline, R. C. Wade, and J. A. McCammon. 1999. Computer simulation of protein-protein association kinetics: acetylcholinesterase-fasciculin. J. Mol. Biol. 291:149–162. [DOI] [PubMed] [Google Scholar]
- 21.Gabdoulline, R. R., and R. C. Wade. 2001. Protein-protein association: investigation of factors influencing association rates by Brownian dynamics simulations. J. Mol. Biol. 306:1139–1155. [DOI] [PubMed] [Google Scholar]
- 22.Miyashita, O., J. N. Onuchic, and M. Y. Okamura. 2004. Transition state and encounter complex for fast association of cytochrome c2 with bacterial reaction center. Proc. Natl. Acad. Sci. USA. 101:16174–16179. [DOI] [PMC free article] [PubMed] [Google Scholar]
- 23.Northrup, S. H., and H. P. Erickson. 1992. Kinetics of protein-protein association explained by Brownian dynamics computer simulation. Proc. Natl. Acad. Sci. USA. 89:3338–3342. [DOI] [PMC free article] [PubMed] [Google Scholar]
- 24.Schreiber, G., and A. R. Fersht. 1993. Interaction of barnase with its polypeptide inhibitor barstar studied by protein engineering. Biochemistry. 32:5145–5150. [DOI] [PubMed] [Google Scholar]
- 25.Buckle, A. M., G. Schreiber, and A. R. Fersht. 1994. Protein-protein recognition: crystal structural analysis of a barnase-barstar complex at 2.0-Å resolution. Biochemistry. 33:8878–8889. [DOI] [PubMed] [Google Scholar]
- 26.Schreiber, G., and A. R. Fersht. 1995. Energetics of protein-protein interactions: analysis of the barnase-barstar interface by single mutations and double mutant cycles. J. Mol. Biol. 248:478–486. [DOI] [PubMed] [Google Scholar]
- 27.Schreiber, G., and A. R. Fersht. 1996. Rapid, electrostatically assisted association of proteins. Nat. Struct. Biol. 3:427–431. [DOI] [PubMed] [Google Scholar]
- 28.Dong, F., M. Vijayakumar, and H.-X. Zhou. 2003. Comparison of calculation and experiment implicates significant electrostatic contributions to the binding stability of barnase and barstar. Biophys. J. 85:49–60. [DOI] [PMC free article] [PubMed] [Google Scholar]
- 29.Wang, T., S. Tomic, R. R. Gabdoulline, and R. C. Wade. 2004. How optimal are the binding energetics of barnase and barstar? Biophys. J. 87:1618–1630. [DOI] [PMC free article] [PubMed] [Google Scholar]
- 30.Spaar, A., C. Dammer, R. R. Gabdoulline, R. C. Wade, and V. Helms. 2006. Diffusional encounter of barnase and barstar. Biophys. J. 90:1913–1924. [DOI] [PMC free article] [PubMed] [Google Scholar]
- 31.Sharp, K. A. 1996. Electrostatic interactions in hirudin-thrombin binding. Biophys. Chem. 61:37–49. [DOI] [PubMed] [Google Scholar]
- 32.Dong, F., and H.-X. Zhou. 2006. Electrostatic contribution to the binding stability of protein-protein complexes. Proteins Struct. Funct. Genetics. In press. [DOI] [PubMed]
- 33.Camacho, C. J., and S. Vajda. 2001. Protein docking along smooth association pathways. Proc. Natl. Acad. Sci. USA. 98:10636–10641. [DOI] [PMC free article] [PubMed] [Google Scholar]
- 34.Frisch, C., A. R. Fersht, and G. Schreiber. 2001. Experimental assignment of the structure of the transition state for the association of barnase and barstar. J. Mol. Biol. 308:69–77. [DOI] [PubMed] [Google Scholar]
- 35.Huang, X., F. Dong, and H.-X. Zhou. 2005. Electrostatic recognition and induced fit in the k-PVIIA toxin binding to Shaker potassium channel. J. Am. Chem. Soc. 127:6836–6849. [DOI] [PubMed] [Google Scholar]
- 36.Shoemaker, B. A., J. J. Portman, and P. G. Wolynes. 2000. Speeding molecular recognition by using the folding funnel: the fly-casting mechanism. Proc. Natl. Acad. Sci. USA. 97:8868–8873. [DOI] [PMC free article] [PubMed] [Google Scholar]
- 37.Zhou, H.-X. 2004. Polymer models of protein stability, folding, and interactions. Biochemistry. 43:2141–2154. [DOI] [PubMed] [Google Scholar]


