

Abstract
Forces applied by intact mucus-propelling cilia were measured for the first time that we know of using a combined atomic force microscopy (AFM) and electrooptic system. The AFM probe was dipped into a field of beating cilia and its time-dependent deflection was recorded as it was struck by the cilia while the electrooptic system simultaneously and colocally measured the frequency to ensure that no perturbation was induced by the AFM probe. Using cilia from frog esophagus, we measured forces of ∼0.21 nN per cilium during the effective stroke. This value, together with the known internal structure of these cilia, leads to the conclusion that most dynein arms along the length of the axoneme contribute to the effective stroke of these cilia.
INTRODUCTION
Cilia are cellular protrusions, 5–50 μm long and 0.2 μm thick, which perform biological transport, such as propulsion of water to promote protozoa swimming, food ingestion assistance in amphibians, and removal of foreign matter in vertebrate respiratory systems. To perform these tasks, cilia beat in a periodic and coordinated manner, with phase differences between them. These phase differences, which are believed to occur due to hydrodynamic interactions between the cilia (1), create a wave on the ciliary surface, often referred to as the “metachronal wave” or “metachronism” (2). Mucus-bearing ciliary systems are composed of three layers (3): an epithelial layer of ciliary cells; periciliary liquid of low viscosity, which surrounds the cilia; and the upper mucus layer, which is propelled by the cilia. The propulsion of the mucus layer by beating cilia facilitates the transport of foreign particles embedded in the mucus. Mucus-propelling cilia are considered to be highly efficient, since despite their small dimensions, 5–7 μm (4), they have been shown to propel steel beads of 1 mm in diameter at a speed of 0.5 mm/s (5). However, the forces that mucus-propelling cilia produce during their beating have never been measured directly.
The periodic beating of cilia is achieved by the function of its complex internal apparatus. Its core, the axoneme, consists of nine microtubule pairs (doublets) encircling the central pair. Adjacent doublets are linked by nexin filaments, whereas the central pair is connected to the surrounding microtubules by radial spokes. These links provide both structural stability and elasticity, allowing repetitive bending of the axoneme. The beating is powered by the activity of the microtubule-based dynein motor protein, which is attached to the outer microtubule doublets and utilizes ATP hydrolysis to produce active sliding of adjacent microtubule doublets (6,7). There are both inner and outer dynein arms on each doublet, and they occur in equal spacing along all of the doublet's lengths (8). However, it is still unclear whether all dynein arms, or only a subset, are participating in ciliary beating (9,10).
The beat pattern of mucus-propelling cilia is asymmetric. It consists of two main parts or strokes, the fast effective stroke and the slower recovery stroke. During the effective stroke, the cilia are nearly in an upright position, moving in a plane perpendicular to the cell surface (11). This enables ciliary tips to embed in the mucus and propel it. During the recovery stroke, the cilia are bent, moving in an incline to the cell surface plane and avoiding contact with the mucus layer (11). Although the asymmetric beating of cilia is believed to be important for efficient and unidirectional propulsion, the mechanisms that determine the shape of the beat and regulate the switch between the two strokes are not fully understood.
The lack of understanding of the connection between the function of inner apparatus and the resulting ciliary strokes is due, in part, to the lack of sufficient characterization of the ciliary motility and forces that cilia exert. Over the last decades, such characterizations were mainly based on light microscopy methods, attempting to describe three-dimensional movement from two-dimensional images of moving, dense cilia, smaller than the diffraction limit. The questionable accuracy of the analyses is apparent in the conflicting conclusions about the beat pattern at basal frequencies. For example, a recent study (12) concluded that the effective stroke and the recovery stroke are in the same planes, contrary to the common concept (11,13,14).
To address these issues, we performed an initial direct measurement of forces applied by intact mucus-propelling cilia using a combination of optic and force measurement systems. We used an atomic force microscope (AFM), which is particularly suitable for measuring very small forces and can operate in liquid, on biological samples. The tip of the AFM, dipped in a layer of beating cilia, experienced measurable forces as a result of collisions with the cilia. The difficulty of directly measuring forces applied by intact mucociliary tissues stems from the fact that the cilia are densely packed and beat rapidly, in synchronization. To ensure that the AFM probe dipped in the ciliary layer did not perturb their normal function, we simultaneously monitored the cilia using the well established photoelectric measurement (15). Based on our measurements, we formulated a model that allowed the estimation of forces applied by single cilia and drew conclusions regarding the number of dynein arms participating in ciliary beating.
MATERIALS AND METHODS
Tissue culture
Experiments were performed on monolayer tissue culture grown from frog esophagus of locally supplied frogs (Rana ridibunda) according to a procedure described elsewhere (16). In addition, the esophagus was bathed in ∼ 2 ml sterile medium with ATP disodium 10−5 M, for 1 h. Extracellular ATP facilitated firm attachment of the explants in the next step of culturing, most probably due to depletion of mucus. It is well known that extracellular ATP is a neurotransmitter activating numerous intracellular events via purinergic receptors. For example, in ciliated explants, extracellular ATP induces a rise in intracellular Ca2+ concentration (17–20), membrane hyperpolarization (21), membrane fluidization (22), release of mucine (23), and ciliary beat frequency enhancement (24–27). One tissue piece was then placed at the center of a sterile No. 1 glass coverslip (Marienfeld, Bad Mergentheim, Germany) placed in a plastic petri dish (35 mm, Nunc, Roskilde, Denmark) and overlaid with 0.7 ml of culture medium. Tissue cultures 4–14 days old were used for measurements. However, every effort was made to use the cultures at the youngest age possible, to minimize interference of loose tissue with AFM measurements, which increased as the cultures aged. The coverslip with the culture was placed in a customized sample holder for liquid AFM measurements. The ciliated surfaces used for measurement were free of mucus, a fact that facilitated the calculations of forces applied by a single cilium.
Chemicals and solutions
All chemicals were purchased from Sigma-Aldrich (St. Louis, MO).
During the experiments, the cultures were washed and bathed in Ringer solution containing (in mM) 120 NaCl, 2.3 KCl, 1.8 CaCl2, 1.8 MgCl2, 0.85 Na2HPO4, and 0.85 NaH2PO4, pH 7.2. The ATP disodium 10−5 M solution was freshly prepared each time it was used, from frozen ATP disodium 10−2 M. ATP disodium, an extra cellular ciliary beat frequency stimulant, was only added to the culture during the experiments aimed at characterizing the system, described in detail in the Results section.
The measurement system
The system measures forces and optical signal simultaneously, a required and unique feature. The forces applied by beating cilia are sensed by the cantilever of an atomic force microscope (AFM). The optical subsystem continuously monitors the frequency of the cilia in the same area where the AFM probe contacts them, before contact and during the measurement, to ensure that no mechanical stimulation or perturbation is induced by the contact of the AFM probe with the cilia.
The optical measurement was previously described (28). The principle is measurement of light scattered while passing through a small area of cilia. The optical signal semiperiodically fluctuates as a result of the shadows projected by the cilia, which temporally and spatially change as the cilia move. In this implementation of this method, the upper objective served as the condenser, focusing white light onto the specimen, while the lower objective collected the light scattered by the cilia. An optic fiber with a 50-μm diameter (model S56, Gamma Scientific, San Diego, CA) was mounted in the intermediate image plane of the lower microscope, thus collecting a small portion of the light, corresponding to a circle of diameter ∼5 μm in the sample plane, with a 10× objective. The output of the optic fiber was converted to voltage with a photomultiplier tube (PMT) (9635B, EMI, London, UK). High voltage to the PMT was supplied by a Fluke 415B power supply. The electrical signal from the PMT was amplified with an EG&G model 5113 preamplifier and thereon fed to real-time computer storage and analysis by a data translation card PCI 124 and program Labview (National Instruments, Austin, TX) at 250 samples/s, except for the experiment reported in Results, Noise analysis of the system, and described in Fig. 2, where the sampling frequency was 1 kHz. Acquisition and real-time fast Fourier transforms (FFT) were started before the approach of the AFM probe to the sample. The ciliary beat frequency (CBF) was monitored with the optical system for several minutes, to verify that the selected patch of cilia had a satisfactorily regular and normal CBF before contact with the AFM probe, and also to ensure that the physical contact between the AFM probe and the cilia did not stimulate or perturb the cilia.
FIGURE 2.

FFT power spectra of AFM measurements. Power is reported in arbitrary units (A.U.) (a) The AFM probe is in the Ringer solution far above the cilia, the measurement is of the noise only. There is no dominant frequency in the range of frequencies measured. (b) The AFM probe in contact with a monolayer of ciliary cells but bereft of cilia. There is a large peak at ∼150 Hz. This frequency is typical of contact between the probe and any sample in our system and originates in a mechanical resonance. (c) The AFM probe is in contact with beating cilia. The peak around frequency 150 Hz appears here, too, with similar power to that in b. The peak at 8 Hz is around eight times larger than the peak at 150 Hz, and is identified as resulting from interaction between the cilia and the AFM probe. Therefore, when measuring active cilia (8-Hz peak), the AFM probe is in direct contact with the ciliary tissue (150-Hz peak).
An AFM/NSOM 100 system (Nanonics Imaging Ltd., Jerusalem, Israel) was used for force measurement. It uses the common detection scheme consisting of a laser beam focused on the back of the cantilever, which is reflected into a four-quadrant position-sensitive detector (PSD). The special feature of this system is a flat scanner (with an xy range of 70 μm and a z range of 17 μm), which allows a free optical axis above and below the sample. Along this axis, two optical microscopes are mounted, enabling on-line observation of the AFM tip and the sample (cilia) and the simultaneous photoelectric measurements. In addition, they enable accurate positioning of the AFM probe on areas of interest of the sample. The whole system is schematically described in Fig. 1.
FIGURE 1.

Schematic view of the measurement setup. The system consists of two different subsystems, measuring simultaneously and colocally the live cilia tissue. The electrooptic subsystem consists of a halogen white lamp, concentrated by an objective to a spot on the cilia, a second objective that collects the light scattered by the cilia while passing through the tissue; a part of the light, corresponding to a round area with a diameter of ∼5 μm is subsequently collected by an optic fiber in the intermediate image plane of the second objective, converted by a photomultiplier tube, and fed to a digital data acquisition card connected to a personal computer. The AFM consists of a flat scanner, allowing a free optical axis above and below the sample, an AFM probe dipped into the field of beating cilia (imaged continuously by the microscopes); the Z motions resulting from collisions of the cilia with the AFM probe are monitored by a laser beam (680 nm) focused on the back of the AFM cantilever, which is reflected onto a position-sensitive detector (PSD). The output of the PSD is amplified and fed to the data acquisition card, on a different channel. During the measurement, a data acquisition program acquires both signals (Optic and AFM) at a sampling frequency of 250 Hz, displays them and their power spectra as calculated by an FFT routine, in real time, and saves the data for further processing and analysis on a hard disk.
The AFM probe (a pyramid with a 5 × 5-μm base and an apex angle of 70°), in a liquid chamber, was directed toward a patch of beating cilia and automatically halted when the system detected bending of the probe of ∼10 nm. The feedback loop was then disconnected and the sample was displaced in the z direction a measured distance, using a power supply. The scanner was stationary (no scanning) during AFM measurements of cilia. A supplementary movie is available (see Supplementary Material), showing active areas of cilia and the AFM probe in contact with them.
Calibration of the AFM system
Three different calibrations were performed to correctly extract forces from the indirect measurement of bending of the cantilever:
Calibration of the scanner (especially the z direction) was achieved by scanning a calibration grid (TGZ-11, Mikromasch, Tartu, Estonia), with a known step height. Once the scanner is calibrated, the distance traveled by the Z piezoelectric actuator per each voltage unit is known.
Calibration of the PSD was performed by acquiring force-distance curves with a hard sample. In this experiment, the sample is pushed against the AFM probe and the deflection in the direction normal to the cantilever (in Volts) is measured as a function of Z piezo displacement (now calibrated in nanometers). From the measurement, one extracts the voltage per displacement (in nm) of the probe, as reported by the PSD.
Calibration of the spring constant of the AFM cantilever was determined by measuring the thermal fluctuations of the cantilever (29), a nondestructive method. This method is suited especially for soft cantilevers, for which the thermal energy induces measurable vibrations of the cantilever. Briefly, the power spectrum of the thermally excited cantilever (room temperature) is acquired (with a lock-in amplifier) when the probe is not in contact with the sample. The spectrum is then compared with the thermal energy at room temperature, from which the spring coefficient can be extracted. The vibration amplitude of the cantilever has to be known in distance units (nm), for which the previous two calibrations are necessary.
The determination of the spring constant was performed for each AFM probe used. All AFM probes were commercial, rectangular contact probes, chrome/gold-coated, with a nominal spring constant k = 0.01–0.05 N/m (MLCT-AUNM, Veeco, Woodbury, NY). The spring constant for twisting (so-called “lateral force”) is estimated to be about two orders of magnitude larger than the constant for bending in the normal direction; therefore, this study relates only to the measurement of normal forces.
RESULTS
Noise analysis of the system
To characterize the basic noise of the measurement system and assess the feasibility of collecting faithful signals originating in the cilia, we performed the following experiment at a sampling frequency of 1 kHz. Ciliary active areas are easily observable in the optical microscope and the AFM probe may be positioned with high accuracy in a desired location. Fig. 2 a shows the power spectrum measured when the probe was far above the cilia. The probe was then placed in contact with the sample in an area where no ciliary activity is observed and the power spectrum measured is shown in Fig. 2 b. Although in Fig. 2 a the noise is evenly distributed across frequencies, upon contact with the sample a clear peak appears around 150 Hz, presumably caused by mechanical vibrations of the system. Measuring beating cilia (Fig. 2 c), a prominent peak appears at a frequency of ∼8 Hz, similar to the well known basal CBF. The peak at 150 Hz, characteristic only of contact, is also apparent. The signal (at ∼8 Hz) is around eight times larger than the noise at 150 Hz. In addition, this noise is easily removed by filtering in the frequency domain with a low-pass filter. In the following experiments, the signal from the PSD was low-pass filtered with a cut-off frequency of 50 Hz, and sampling frequency was reduced to 250 Hz. It is important to point out that when the 8 Hz peak appears, the 150 Hz peak appears also (Fig. 2 c), with a power similar to that in Fig. 2 b, indicating that the tip is in contact with the tissue when it measures beating cilia; therefore, the force is not transferred by the fluid, but by direct contact.
Fig. 3 depicts typical raw data and Fourier analysis of the signals acquired from the cultured cilia. We show an optical measurement in Fig. 3 a and its FFT power spectrum in Fig. 3 c, and an AFM measurement of a different sample, beating at a different frequency, in Fig. 3 b, with its FFT power spectrum in Fig. 3 d. These measurements show typical examples of the pseudoperiodic signals characteristic of cilia, and demonstrate that, despite the less than perfect periodicity, the Fourier spectrum indicates a predominant frequency and correctly reports a higher frequency in the optical signal (∼15 Hz), than in the AFM signal (∼8 Hz), acquired on a different culture.
FIGURE 3.

Optic and AFM measurement of cilia. (a and c) The optical signal, acquired on a sample beating with a relatively high-frequency (∼15 Hz) raw signal and power spectrum, respectively. (b and d) AFM signal acquired from a different sample, beating at a lower-frequency (∼8 Hz) raw signal and power spectrum, respectively. It is demonstrated that the FFT power spectrum faithfully reports the different frequencies (visually compare the raw signals in a and b), both for the optical and AFM signals, despite the fact that the raw signal is less than periodical. The fluctuations in amplitude are typical of these cilia.
The AFM probe does not perturb the cilia
To convince ourselves that the source of the AFM signal is indeed the cilia, and that the contact is delicate enough not to perturb the system, we performed the following experiment. The optical system was aligned with a patch of active cilia and the AFM probe was then positioned over the same patch of cilia. Collection of optical signal started when the AFM probe was not in contact with the cilia for ∼3 min (Fig. 4 a). Subsequently, the probe was brought into contact and the AFM signal was collected as well (Fig. 4 b). The arrows in Fig. 4 indicate the time point at which the AFM probe contacted the cilia. It is visible that the optically measured frequency after contact with the AFM probe remains unchanged from that before contact; thus, no disturbance of the ciliary beat is induced by the probe. Also, it is visible that both the optical system and the AFM measure the same frequency, 11–12 Hz, typical of the basal CBF of these cilia. After a period of ∼9 min (∼550 s), extracellular ATP, a well known stimulant of CBF (18,24),was added to the tissue and the change in beating frequency was monitored with simultaneous AFM and optical detection. Clearly, the frequency of the AFM signal closely follows the frequency of the optical signal and increases simultaneously to almost 20 Hz, followed by a gradual decrease. The inset shows a plot of the frequency of the AFM signal versus the frequency of the optic signal and demonstrates the good correlation between the simultaneously acquired signals.
FIGURE 4.

Simultaneous and colocal measurement of the optic and AFM signal frequencies before, during, and after approaching the cilia with the AFM probe. (a and b) Optic and AFM measurements of frequency, respectively. Contact of the AFM probe with the sample occurs ∼180 s after start of acquisition of the optic signal, indicated by arrows in both a and b. No change in the frequency of the optical signal (a) is observed. Extracellular ATP was added ∼550 s from the start of the experiment, causing a rapid increase in the frequency, followed by a gradual decrease, and was recorded simultaneously by the optical system and AFM. The inset shows a plot of the frequency of the AFM signal versus the frequency of the optic signal and demonstrates the good correlation between the simultaneously acquired signals. This proves unequivocally that the AFM signal originates in the cilia.
The concern about mechanical stimulation is based upon reports of high mechanical sensitivity in ciliated cells, causing an increase of CBF (30). The results of this experiment indicate that in our system, the contact of the soft AFM probe is sufficiently delicate to avoid stimulating them. Moreover, these results are consistent with our previous finding that tight-seal formation does not mechanically activate the cilia (31).
The force sensed by the AFM probe increases with decreasing probe-sample separation
Due to the pyramidal shape of the AFM probe, it is expected that the deeper the tip is dipped into the field of cilia, the larger the number of cilia that contact it, leading to a larger force measured. Measurement of the AFM signal amplitude at varying probe-cilia distances (ΔZ) is presented in Fig. 5. Zero separation is arbitrarily assigned to the point at which the automatic approach was terminated (Fig. 5, inset, left). After the automatically stopped approach, the separation was manually set using a calibrated power supply connected to the Z piezoelectric actuator. The probe was first retracted away from the cilia, a distance of ∼14 μm. Then it was gradually approached, and measurements of the signal amplitude were recorded (black squares), until a separation of −1 μm (closer to the cilia base by 1 μm than the point where the tip had originally stopped) was attained. The probe was then retracted gradually and signal amplitude was recorded (open triangles), showing negligible differences between retraction and approach. This indicates that no damage was caused to the tissue during dipping of the probe. The amplitudes measured at ΔZ that are >∼5 μm are within the noise limits of the system. Progressive increase in amplitude was measured when directing the probe into the ciliary tissue. It is important to note that the range over which the amplitude is changing is ∼5 μm (from +4 μm to −1 μm), which correlates extremely well with the reported length of these cilia, 5–7 μm.
FIGURE 5.

Measurement of force sensed by the AFM probe as a function of the distance from the ciliated culture. The AFM probe is directed into the sample and stopped automatically by the system once a small deflection is detected. This point is designated ΔZ = 0 on the x axis. From this point, the probe is retracted 14 μm away from the tissue. Then, the probe is approached stepwise until ΔZ = −1.5 μm, and the RMS amplitude of its motion, as it is being hit by cilia, is recorded at each point. The whole approach process is plotted in black squares. After completion of the approach, the tip is retracted in steps and the amplitude is recorded again and plotted as open triangles. The similarity of the results during approach and retract prove that no damage was caused to the cilia during the approach process.
Calculation of the force applied by a cilium
The dimensions of the probe (its tip is a pyramid with a base of 5 × 5 μm) compared with the length and spacing of the cilia (5–7 μm and 0.35 μm, respectively) imply that, in general, the measured AFM signal represents interaction of more than one cilium with the probe. To calculate the force applied by each cilium, a model was developed based on the putative interactions between the cilia and the probe's tip. In our model, we assume, for simplicity, that the cilia are arranged in rows and columns, their roots forming a square lattice. In addition, we assume:
The peaks of the AFM signal are from the concerted forces of all cilia close enough to reach the probe's tip.
Measured AFM signals attributed to the beatings of cilia are the result of direct contact of cilia with the probe's tip.
The cilia are straight and rigid rods, contacting the probe tip only during the effective stroke, in an elastic collision.
Point 1 might seem an overestimation of the number of cilia contacting the tip simultaneously in reality. Adjacent cilia along lines in the effective stroke direction (ESD) supposedly beat with a phase shift, creating a metachronal wave, which leads to a continuous transport of mucus. This contradicts our assumption that all cilia that can geometrically reach the tip will do so simultaneously; in fact, it is probably a smaller number. Therefore, we are likely to calculate a lower limit of the force applied by a single cilium (since the measured force is the result of fewer cilia than our model counts). However, the excellent agreement of the model with the experimental data (see Fig. 7) lends it a great deal of credibility.
FIGURE 7.

Fit of theoretical relationship to experimental results of force-distance. The only free parameter is the absolute initial distance Z where the AFM tip ended up at the end of the automatic approach. Black squares are a subset of measurements plotted in Fig. 5 (six leftmost points). The open triangles are the results of calculations from the model. The value of the parameter giving this fit is 2.5 μm, i.e., the depth to which the tip had originally penetrated into the field of cilia was 2.5 μm (see Fig. 5).
The assumption of point 2 is supported by the fact that we measure forces only over a range of distances similar to the ciliary length (Fig. 5) and that we observe mechanical vibrations typical of contact while detecting forces applied by cilia (Fig. 2).
The assumption in point 3 conforms with the commonly accepted view of the cilium form during the beat: all the cilia are straight and rigid, perpendicular to the ciliary cell surface in their effective stroke, recumbent and close to the cell surface during the recovery stroke. The collisions are most likely not elastic, so we are under-estimating yet again the force applied by one cilium (since some of its energy is not transferred to the AFM probe).
The model consists of calculating from geometry the number of cilia contacting the AFM probe at various tip-sample separations and the angle at which they do so. Fig. 6 defines the geometry and the variables used in the following description of these calculations. The cilia in Fig. 6 have an ESD parallel to the AFM cantilever, consistent with the way the measurements were done. The symbols in Fig. 6 are defined below:
α, angle between the cilium and cell surface
Ft, tangential force component of the cilium at the point of contact with the tip
Fn, component of the tangential force in a direction normal to the AFM cantilever
L, cilium length (5–7 μm for the investigated cilia)
2β, the AFM probe tip's angle, known from the probe manufacturer (70°)
P, extent to which the AFM probe tip is immersed in the cilia, estimated from measurements (see below)
D, absolute distance of the cilium's base from the point directly under the tip, on the cell surface, in the direction of ESD
D′, distance of the cilium's base from the point directly under the tip, on the cell surface, in the direction perpendicular to ESD
U, width of the tip at contact level of the cilium with the tip
FIGURE 6.

Schematic views of cilia and an AFM probe from two directions. (a) Side view, showing the AFM cantilever and tip aligned with the direction of the ESD. The dot-dashed oblique line is an imaginary continuation of the pyramid side to the cell's surface. Two cilia are also shown (wide lines), to the right and to the left of the dot-dashed line. (b) Three cilia beating in parallel with the ESD into the page and the cantilever of the AFM probe pointing out of the page (toward the reader). The symbols are explained in the text.
The distance between cilia is reported in a number of publications. The maximal distance reported is 1 μm (32), an absolutely minimal theoretical distance is 0.2 μm, equal to the axoneme diameter, and most values reported and directly measured from SEM images are in the range 0.27–0.4 μm (33–35). The reported values may or may not have been corrected for the shrinkage of tissue during fixation. We chose 0.35 μm as the spacing between cilia, for purposes of this calculation. α is also the angle between the direction of the tangential force applied by each cilium on the tip and the direction normal to the cell's surface toward the tip, as shown in Fig. 6 a.
The cilia close enough to contact the tip divide into groups: those that hit the AFM probe tip with their distal ends (Fig. 6 a, I) and those that hit the tip's end somewhere along the cilium (Fig. 6 a, II). All cilia with their base to the right of the imaginary dot-dashed line in Fig. 6 a belong to the first group (I). All these cilia meet the requirement α > (90 − β), which is the criterion used to sort them into this group. This set of cilia that are in the same row perpendicular to the ESD (Fig. 6 b), hit the tip at an identical angle α (their number varies with the extent of dipping of the tip). The angle α for this group of cilia is calculated by solving the quadratic equation:
 |
(1) |
where 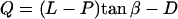 .
.
U, defined as the width of the pyramidal tip at contact level of the cilium with the tip, counts the number of cilia that hit the tip at angle α:
 |
(2) |
A value of U ≤ 0 means that no cilia hit the tip. For any particular P, the following algorithm is used: D is assigned a discrete value, which corresponds to a specific cilium. The angle α is calculated from Eq. 1 and U is calculated from Eq. 2. Values of D are scanned repeatedly, representing adjacent cilia, and  and
and  are calculated for that D, until either U < 0 (the specific cilium does not reach the tip) or 0 < α < (90 − β) (the specific cilium is not in the group of cilia hitting the tip with their edge). In this way, all the cilia in group I are counted, and their respective contact angles α are recorded.
The discrete character of the model, stemming from the discrete positions of cilia, gives rise to a significant difference in the number of cilia hitting the tip, depending on whether the point of the AFM tip is directly above a row of cilia, or between them. The results for these two positions are reported in Table 1. The number of cilia used for the extraction of the force applied by a single cilium was taken as the average of these two values.
TABLE 1.
Number of cilia hitting the tip at an identical angle α
| Width (μm) | On top of row | Between rows | Average |
|---|---|---|---|
| 0 < U < 0.35 | 1 | 0 | 0.5 |
| 0.35 < U < 0.7 | 1 | 2 | 1.5 |
| 0.7 < U < 1.05 | 3 | 2 | 2.5 |
| 1.05 < U < 1.4 | 3 | 4 | 3.5 |
| 1.4 < U < 1.75 | 5 | 4 | 4.5 |
| 1.75 < U < 2.1 | 5 | 6 | 5.5 |
| 2.1 < U < 2.45 | 7 | 6 | 6.5 |
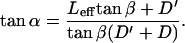
For the second group of cilia (II), with a base to the left of the dot-dashed line in Fig. 6 a, calculation of the angles  is more complex, because each cilium has its own angle α depending on: D, D′, β,
  , and P. In this group, U has no role.
For this group of cilia,
 |
(3) |
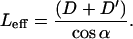
Since all these cilia hit the tip along their length, we define Leff as the effective length, the length measured from the root to the point of contact with the probe.
 |
(4) |
In this group, the cilia are tested (for a certain P, for various permutations of D, D′, as in the first group) to see whether they reach the tip and belong to the second group (0 < α < (90 − β)), and 0 < Leff < L. If Leff > L, this indicates that the cilium is too far away for contact with the tip. During this process, the angle α for each cilium is recorded.
Once the process of counting all cilia that can contact the tip (both groups) is completed, it is repeated for a different value of P (immersion of the tip into the field of cilia).
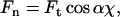
The normal force Fn, which is the force that the AFM cantilever measures, is related to the tangential force Ft according to:
 |
(5) |
where  , with χ = 1 for the first group (hitting with the distal end). Serially numbering the cilia in contact with the tip, i = 1 to m, each cilium (i) has its own values of χ(i) and angle α(i), both calculated by the algorithm as explained, and therefore contributes a normal force Fn(i) to the measured force. The total measured force
  is from Eq. 5:
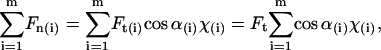 |
(6) |
since Ft is the same for all cilia, and the value we are after. We therefore have
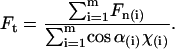 |
(7) |
Dipping the tip into the cilia not only brings more cilia into contact with the tip, but also the same cilia intercept the tip at a sharper angle α and thus apply more force to it. Therefore, the total force applied by the cilia on the tip steeply increases as the distance decreases between the cell surface and the probe tip. Comparison between the theoretical dependence of the measured force on the tip-sample distance and the experimental results, as in Fig. 5, would test the validity of the model. The only fitting parameter is the absolute Z (in Fig. 5), or the initial dip of the probe (P). Note that Z + P = L, since Z measures the distance from the cell surface to the AFM tip, whereas P measures the complementary distance, i.e., from the end of an erect cilium down to the tip of the AFM probe. The prediction of the model is fitted to the measured values by assigning the value 2.5 μm to the initial dip (P) (the automatic approach stopped when the tip penetrated 2.5 μm into the blanket of cilia). The result from one preparation is shown in Fig. 7. Here, Z measures the distance from the cell surface to the tip of the AFM probe. As is visible, our measurement didn't go deeper than ∼4 μm from the base of the cilia in this case, which justifies our assumption that the main contribution to the measured forces is from the effective stroke of the cilia, and our tip did not prevent adjacent cilia from performing their recovery stroke underneath it.
With the excellent agreement of the model with the measurements, we proceeded to take measurements of many ciliary samples. Individual measurements with various AFM probes were performed. Each AFM probe was individually calibrated and for each measurement, the extent of dipping the tip into the cilia was calculated as described above. Using Eq. 7 and the measured forces, we calculate the force applied by each cilium: 0.21 nN ± 0.08 nN, for 14 samples (nine frogs).
DISCUSSION
The main role of coordinated beating of mucociliary systems is to transport large and heavy objects over the epithelium. To the best of our knowledge, direct measurement of the forces applied by intact mucociliary explants is presented here for the first time. Moreover, integrating the AFM and optical techniques allows us to measure simultaneously, from a given cell, the forces applied by the cilia and their frequency. Thus, the combined technique can be used to assess the role of well-known pathways that control ciliary beat frequency and their influence on the forces produced by beating cilia. Despite the high sensitivity of our measurements, extrapolation of the experimental data to a single cilium is nontrivial due to the complex topology presented by a dense package of moving, slender bodies.
Based on the above suggested model, it is possible to calculate with high accuracy the minimal force applied by a single cilium. However, this may vary by a factor of two and more, for different mucociliary organs and/or species, according to the length and spacing of the cilia. It has to be emphasized that, given the actual spacing between cilia and their length, this method can provide reliable information for a single cilium.
The interaction of cilia with the AFM probe
Measurements of forces applied by various cilia have been performed in the past in various conditions, such that in some instances the cilia were stalled, and in others, they were free of obstruction. Calculations of force have also been performed, based on fast cinematography studies of various cilia and hydrodynamic considerations (36,37). In these extreme conditions, very different results were obtained. The first measurement of force applied by a stalled cilium of Mytilus edulis (38), reported a stall force of 500–3000 pN (calculated from the published torque). The same cilium was reported to apply 25–50 pN when not stalled, as derived from hydrodynamic calculations (39). This may imply that cilia can apply higher forces under load, therefore it is important to assess, when measuring the forces, to what extent they are loaded by the force sensor. In our study, the cilia in contact with the probe could not have been completely stalled. Otherwise, the AFM signal would not have presented the same frequency as before contact with the cilia (as monitored by the independent optical measurement in Fig. 4), and even accelerate in response to extracellular ATP (Fig. 4). Therefore, we are likely measuring forces lower than stall forces. On the other hand, these cilia normally propel a layer of mucus, which obviously loads them, perhaps in a manner similar to our AFM tip, so the values we extract may be more biologically relevant.
We mention a number of details that may influence the accuracy of our calculation of the force per cilium, from the directly measured forces:
The collisions between cilia and the tip are not elastic, therefore only a fraction of their kinetic energy is ultimately transformed into spring potential energy of the cantilever at its maximal deflection (which we are measuring).
Not all cilia that can reach the AFM probe hit it simultaneously. A correction is possible, based on previously reported data on these cilia. The phase difference between consecutive cilia in a row parallel to the ESD is 24° and in a row perpendicular to the ESD is 40° (40). They perform the effective stroke starting at ∼30° and swing an arc of 120° (41) during ∼25 ms; thus, the angular velocity is 4.8 deg/ms. The number of cilia expected to hit the AFM probe during one period, at a given dip of the probe can be estimated according to the model, including the angles at which they hit the probe. (For example, at a dip of 1 μm, it is calculated that only 10 cilia contact the AFM probe during one period, taking the above into consideration). This kind of estimation leads to a force per cilium approximately twice as high as the one reported above.
Our model contains one free parameter, an unknown of the measurement, which is the precise z-position of the AFM probe. This parameter was extracted by fitting the prediction of the model to the experimental measurement. We tested the sensitivity of our model to variations in the parameter P (extent of immersion). It was found that a variation of the initial distance by 1 μm above and below the value used causes an uncertainty of a factor of roughly two (up and down) in the force applied by a cilium.
In recent years, more force measurements have been published of sperm-type cilia/flagella. The results are summarized in Table 2. All these flagella are considerably longer than mucus-propelling cilia, and have a beat pattern considered rather atypical for cilia, being two-dimensional undulations. All the measurements have been performed on demembranated flagella. Therefore, the comparison with our measurements, performed on intact, shorter, and three-dimensionally beating cilia, may not be very instructive. However, the value we obtain is within the range reported, with the exception of the optical tweezers measurement (which is very different from the other, sperm-type measurements).
TABLE 2.
Measurements of forces applied by cilia and flagella
| Specimen type | Specimen treatment | Measurement method | Measured force (pN) | Reference |
|---|---|---|---|---|
| Human sperm | Excised | Optic tweezers | 44 ± 20 | (52) |
| Cilium, Mytilus edulis | Excised and constrained | Glass needles | 500–3000 | (38) |
| Bull sperm | Demembranated | Glass needles | 250 ± 90 | (50) |
| Sand dollar sperm | Demembranated | Glass needles | 100–250 | (53) |
| Sea-urchin sperm axoneme | Demembranated | AFM | Up to 500 | (54) |
| Cilium, Rana ridibunda | Intact | AFM | 210 | This study |
It is important to emphasize that various members of the flagella and cilia family should not be expected to apply precisely the same forces. Whereas it is commonly accepted that the general structure of the ciliary machinery, the axoneme, seems to be conserved throughout evolution, the pattern of ciliary beating varies considerably among flagella, single-cell organisms, and mucociliary epithelium, reflecting the unique physiological function of each group. Differences in the beat pattern also exist among single-cell organisms, indicating that differences in the mechanisms controlling the motor proteins probably exist (42). Indeed, differences of approximately one order of magnitude are observed even in measured forces from sperm flagella (bull sperm and human sperm (Table 2)). In addition, permeabilization of the ciliary membrane, as in most of the experiments reported and summarized in Table 2, may induce the loss of essential intracellular regulatory components or factors within the axoneme. This may influence the forces produced by the cilium. It was shown, for example, that permeabilization of mucociliary membranes resulted in changed controlling mechanisms of ciliary beating (43,44).
Calculation of the force applied by dynein from the study's results
The axoneme, a macrocomplex assembly of >200 different peptides and proteins, produces motion through the activity of dynein molecules (45). The force applied by one dynein molecule can be derived from the force applied per cilium, by taking into account the internal structure of these cilia. Each doublet in the axoneme contains inner-arm and outer-arm dyneins, apparently both capable of applying the same force (46). However, it seems that only the outer ones produce the applied force in the effective stroke (47–49). The dyneins are spaced 24 nm apart along the doublet (46). Based on the proposed “switching mechanism” of ciliary beating, during the effective stroke only one half of the dyneins actively produce force (10), so considering the cilium's length and the number of doublets, the number of participating dyneins is ∼1000.
Extrapolating the force per dynein molecule according to a well known model that has been verified for demembranated single sperm flagella (50), we obtain: the force per cilium, 0.21 × 10⁻⁹ N multiplied by the lever arm (length of cilium), 5 × 10⁻⁶ m, and divided by the axoneme diameter, 0.2 × 10⁻⁶ m, yields a tension of 5.25 nN. Here, we adopt the method presented in Schmitz et al. (50): the force that develops between each pair of doublets, sliding on each other, is ultimately transmitted to the doublets on the innermost and outermost extremes of a developing bend. The bend develops due to (cumulative) elongation of the outermost doublet, relative to the innermost one. The spacing between these doublets is effectively the axoneme diameter (0.2 × 10⁻⁶ m), which is used to account for the ratio between the lever arms.
If all 1000 dynein molecules are active, this yields a force of ∼5 pN per dynein molecule, which is in good agreement with forces that have been measured mostly with optical tweezers, as can be seen by comparison with the study results summarized in Table 3. On comparing those values to this study's results, we emphasize the possible effect of chemical treatment. This effect is enhanced in Table 3 results, in relation to the measurements in Table 2, as extraction and isolation of dyneins is extremely elaborate and extensive, a process that could possibly affect the proteins' properties. In addition, most results in Table 3 have been obtained for cytoplasmic dynein, not axonemal dynein, and they span a range of almost one order of magnitude.
TABLE 3.
Measurements of forces applied by dynein
| Specimen type | Measurement method | Measured force (pN) | Reference |
|---|---|---|---|
| Sea-urchin sperm dynein | Glass needles | 0.69 ± 0.21 | (55) |
| Cytoplasmic dynein | Optic tweezers | 2.6 | (56) |
| Sea-urchin sperm dynein | Optic tweezers | ∼6 | (46) |
| 22s outer arm dynein | Optic tweezers | 4.7 | (57) |
| Cytoplasmic dynein | Optic tweezers | 1.1 | (58) |
| Cytoplasmic dynein | Optic tweezers | 0.92 ± 0.31 | (59) |
| Cytoplasmic dynein | Optic tweezers | 7–8 | (60) |
| Frog palate dynein | Extrapolated | ∼5 | This study |
In our calculation, it was assumed that all dyneins (along the outer arm, on one side of the axoneme) equally contribute to the effective stroke, and that no dissipation of force was caused by restrictions of the cilium's structure, such as the stiffness. If these assumptions hold, then the closeness of the value obtained in this study to the results described in the literature seems to indicate that indeed most of the dyneins are actively producing force during the effective stroke. Another group (10) used a hydrodynamic model and recorded movements (51) of paramecium cilia to calculate the energy expenditure of the cilium during a beat cycle; they concluded that almost all of the available dynein arms in a paramecium cilium participate in generating a beat.
CONCLUSIONS
Forces applied by intact, live, mucus-bearing cilia were measured, using AFM and an electrooptical method. Assisted by simultaneous measurement of the same cilia by the optical method, it was rigorously proven that the AFM signal frequency matches the frequency of the beats of the cilia. Furthermore, direct contact takes place between the AFM probe and the cilia, in a manner delicate enough to avoid mechanical stimulation of the cilia's beats.
The method can measure with high accuracy the force applied by a field of beating cilia on a known surface. It is possible to extract the force applied by a single cilium during the effective stroke with the aid of a geometrical model, which depends on the precise cilia length and interciliary spacing. We obtain a value of 0.21 nN, for cilia 5 μm long and with 0.35-μm spacing. This value, when compared to the force applied by a dynein molecule (∼5 pN), may indicate that most of the dynein arms along the axoneme contribute to the effective stroke in mucociliary systems.
SUPPLEMENTARY MATERIAL
An online supplement to this article can be found by visiting BJ Online at http://www.biophysj.org.
References
- 1.Sleigh, M. A. 1974. Metachronism of cilia in metazoa. In Cilia and Flagella. M. A. Sleigh, editor. Academic Press, New York. 287–304 .
- 2.Gheber, L., and Z. Priel. 1990. On metachronism in ciliary systems: a model describing the dependence of the metachronal wave properties on the intrinsic ciliary parameters. Cell Motil. Cytoskeleton. 16:167–181. [DOI] [PubMed] [Google Scholar]
- 3.Lucas, A. M., and L. C. Douglas. 1934. Principles underlying ciliary activity in the respiratory tract: II. A comparison of nasal clearance in man, monkey and other mammals. Arch. Otolaryngol. 20:518–541. [Google Scholar]
- 4.Sleigh, M. A. 1982. Movement and coordination of tracheal cilia and the relation of these to mucus transport. Cell Motil Suppl. 1:19–24. [DOI] [PubMed] [Google Scholar]
- 5.King, M., A. Gilboa, F. A. Meyer, and A. Silberberg. 1974. On the transport of mucus and its rheologic stimulants in ciliated systems. Am. Rev. Respir. Dis. 110:740–745. [DOI] [PubMed] [Google Scholar]
- 6.Satir, P. 1967. Morphological aspects of ciliary motility. J. Gen. Physiol. 50:241–258. [DOI] [PMC free article] [PubMed] [Google Scholar]
- 7.Summers, K. E., and I. R. Gibbons. 1971. Adenosine triphosphate-induced sliding of microtubules in trypsin-treated flagella of sea-urchin sperm. Proc. Natl. Acad. Sci. USA. 68:3092–3096. [DOI] [PMC free article] [PubMed] [Google Scholar]
- 8.Avolio, J., A. N. Glazzard, M. E. Holwill, and P. Satir. 1986. Structures attached to doublet microtubules of cilia: computer modeling of thin-section and negative-stain stereo images. Proc. Natl. Acad. Sci. USA. 83:4804–4808. [DOI] [PMC free article] [PubMed] [Google Scholar]
- 9.Satir, P., T. Hamasaki, and M. E. J. Holwill. 1997. Modelling outer dynein arm activity and its relation to the ciliary beat cycle. In Cilia, Mucus, and Mucociliary Interactions. G. Baum, Z. Priel, Y. Roth, N. Liron, and E. D. Ostfed, editors. Marcel-Dekker, New York. 13–19.
- 10.Gueron, S., and K. Levit-Gurevich. 1999. Energetic considerations of ciliary beating and the advantage of metachronal coordination. Proc. Natl. Acad. Sci. USA. 96:12240–12245. [DOI] [PMC free article] [PubMed] [Google Scholar]
- 11.Sanderson, M. J., and M. A. Sleigh. 1981. Ciliary activity of cultured rabbit tracheal epithelium: beat pattern and metachrony. J. Cell Sci. 47:331–347. [DOI] [PubMed] [Google Scholar]
- 12.Chilvers, M. A., and C. O'Callaghan. 2000. Analysis of ciliary beat pattern and beat frequency using high speed imaging: comparison with the photomultiplier and photodiode methods. Thorax. 55:314–317. [DOI] [PMC free article] [PubMed] [Google Scholar]
- 13.Sleigh, M. A., J. R. Blake, and N. Liron. 1988. The propulsion of mucus by cilia. Am. Rev. Respir. Dis. 137:726–741. [DOI] [PubMed] [Google Scholar]
- 14.Wanner, A., M. Salathe, and T. G. O'Riordan. 1996. Mucociliary clearance in the airways. Am. J. Respir. Crit. Care Med. 154:1868–1902. [DOI] [PubMed] [Google Scholar]
- 15.Eshel, D., Y. Grossman, and Z. Priel. 1985. Spectral characterization of ciliary beating: variations in frequency with time. Am. J. Physiol. 249:C160–C165. [DOI] [PubMed] [Google Scholar]
- 16.Zagoory, O., A. Braiman, L. Gheber, and Z. Priel. 2001. Role of calcium and calmodulin in ciliary stimulation induced by acetylcholine. Am. J. Physiol. 280:C100–C109. [DOI] [PubMed] [Google Scholar]
- 17.Ma, W. Y., A. Korngreen, N. Uzlaner, Z. Priel, and S. D. Silberberg. 1999. Extracellular sodium regulates airway ciliary motility by inhibiting a P2X receptor. Nature. 400:894–897. [DOI] [PubMed] [Google Scholar]
- 18.Korngreen, A., and Z. Priel. 1996. Purinergic stimulation of rabbit ciliated airway epithelia: control by multiple Ca2+ sources. J. Physiol. 497:53–66. [DOI] [PMC free article] [PubMed] [Google Scholar]
- 19.Paradiso, A. M., S. J. Mason, E. R. Lazarowski, and R. C. Boucher. 1995. Membrane-restricted regulation of Ca2+ release and influx in polarized epithelia. Nature. 377:643–646. [DOI] [PubMed] [Google Scholar]
- 20.Levin, R., A. Braiman, and Z. Priel. 1997. Protein kinase C induced calcium influx and sustained enhancement of ciliary beating by extracellular ATP. Cell Calcium. 21:103–113. [DOI] [PubMed] [Google Scholar]
- 21.Tarasiuk, A., M. Barshimon, L. Gheber, A. Korngreen, Y. Grossman, and Z. Priel. 1995. Extracellular ATP induces hyperpolarization and motility stimulation of ciliary cells. Biophys. J. 68:1163–1169. [DOI] [PMC free article] [PubMed] [Google Scholar]
- 22.Alfahel, E., A. Korngreen, A. H. Parola, and Z. Priel. 1996. Purinergically induced membrane fluidization in ciliary cells: characterization and control by calcium and membrane potential. Biophys. J. 70:1045–1053. [DOI] [PMC free article] [PubMed] [Google Scholar]
- 23.Abdullah, L. H., S. W. Davis, L. Burch, M. Yamauchi, S. H. Randell, P. Nettesheim, and C. W. Davis. 1996. P-2u purinoceptor regulation of mucin secretion in SPOC1 cells, a goblet cell line from the airways. Biochem. J. 316:943–951. [DOI] [PMC free article] [PubMed] [Google Scholar]
- 24.Ovadyahu, D., D. Eshel, and Z. Priel. 1988. Intensification of ciliary motility by extraxcellular ATP. Biorheology. 25:489–501. [DOI] [PubMed] [Google Scholar]
- 25.Weiss, T., L. Gheber, V. Shoshan-Barmatz, and Z. Priel. 1992. Possible mechanism of ciliary stimulation by extracellular ATP: involvement of calcium-dependent potassium channels and exogenous Ca2+. J. Membr. Biol. 127:185–193. [DOI] [PubMed] [Google Scholar]
- 26.Gheber, L., Z. Priel, C. Aflalo, and V. Shoshanbarmatz. 1995. Extracellular ATP binding-proteins as potential receptors in mucociliary epithelium: characterization using [P-32] 3′-O-(4-benzoyl)benzoyl ATP, a photoaffinity label. J. Membr. Biol. 147:83–93. [DOI] [PubMed] [Google Scholar]
- 27.Uzlaner, N., and Z. Priel. 1999. Interplay between the NO pathway and elevated [Ca2+]i enhances ciliary activity in rabbit trachea. J. Physiol. 516:179–190. [DOI] [PMC free article] [PubMed] [Google Scholar]
- 28.Eshel, D., and Z. Priel. 1987. Characterization of metachronal wave of beating cilia on frog's palate epithelium in tissue-culture. J. Physiol. 388:1–8. [DOI] [PMC free article] [PubMed] [Google Scholar]
- 29.Hutter, J. L., and J. Bechhofer. 1993. Calibration of atomic force microscope tips. Rev. Sci. Instrum. 64:1868–1873. [Google Scholar]
- 30.Sanderson, M. J., A. C. Charles, and E. R. Dirksen. 1990. Mechanical stimulation and intercellular comunication increases intracellular Ca 2+ in epithelial cells. Cell Regul. 1:585–596. [DOI] [PMC free article] [PubMed] [Google Scholar]
- 31.Ma, W., S. D. Silberberg, and Z. Priel. 2002. Distinct axonemal processes underlie spontaneous and stimulated airway ciliary activity. J. Gen. Physiol. 120:875–885. [DOI] [PMC free article] [PubMed] [Google Scholar]
- 32.Aiello, E., and M. A. Sleigh. 1977. Ciliary function of the frog oro-pharyngeal epithelium. Cell Tissue Res. 178:267–278. [DOI] [PubMed] [Google Scholar]
- 33.Tarran, R., B. R. Grubb, J. T. Gatzy, C. W. Davis, and R. C. Boucher. 2001. The relative roles of passive surface fForces and active ion transport in the modulation of airway surface liquid volume and composition. J. Gen. Physiol. 18:223–236. [DOI] [PMC free article] [PubMed] [Google Scholar]
- 34.Art, T., B. C. McGorum, and P. Lekeux. 2002. Environmental control of respiratory disease. In Equine Respiratory Diseases. P. Lekeux, editor. International Veterinary Information Service. Ithaca, NY.
- 35.O'Brien, D. W., M. I. Morris, J. Ding, J. G. Zayas, S. Tai, and M. King. 2004. A mechanism of airway injury in an epithelial model of mucociliary clearance. Respir. Res. 5:10. [DOI] [PMC free article] [PubMed] [Google Scholar]
- 36.Rikmenspoel, R., and M. A. Sleigh. 1970. Bending moments and elastic cConstants in cilia. J. Theor. Biol. 28:81–100. [DOI] [PubMed] [Google Scholar]
- 37.Hiramoto, Y. 1974. Mechanics of ciliary movement. In Cilia and Flagella. M. A. Sleigh, editor. Academic Press, London.
- 38.Yoneda, M. 1960. Force exerted by a single cilium of Mytilus edulis. I. J. Exp. Biol. 37:461–469. [Google Scholar]
- 39.Yoneda, M. 1962. Force exerted by a single cilium of Mytilus edulis. II. J. Exp. Biol. 39:307–317. [Google Scholar]
- 40.Gheber, L., and Z. Priel. 1994. Metachronal activity of cultured mucociliary epithelium under normal and stimulated conditions. Cell Motil. Cytoskeleton. 28:333–345. [DOI] [PubMed] [Google Scholar]
- 41.Gheber, L., and Z. Priel. 1997. Extraction of cilium beat parameters by the combined application of photoelectric measurments and computer simulation. Biophys. J. 72:449–462. [DOI] [PMC free article] [PubMed] [Google Scholar]
- 42.Tamm, S. L., and M. Terasaki. 1994. Visualization of calcium transients controlling orientation of ciliary beat. J. Cell Biol. 125:1127–1135. [DOI] [PMC free article] [PubMed] [Google Scholar]
- 43.Lansley, A. B., M. J. Sanderson, and E. R. Dirksen. 1992. Control of the beat cycle of respiratory-tract cilia by Ca-2+ and cAMP. Am. J. Physiol. 263:L232–L242. [DOI] [PubMed] [Google Scholar]
- 44.Gertsberg, I., V. Hellman, M. Fainshtein, S. Weil, S. D. Silberberg, M. Danilenko, and Z. Priel. 2004. Intracellular Ca2+ regulates the phosphorylation and the dephosphorylation of ciliary proteins via the NO pathway. J. Gen. Physiol. 124:527–540. [DOI] [PMC free article] [PubMed] [Google Scholar]
- 45.Gibbons, I. R. 1995. Dynein family of motor proteins: present status and future questions. Cell Motil. Cytoskeleton. 32:136–144. [DOI] [PubMed] [Google Scholar]
- 46.Shingyoji, C., H. Higuchi, M. Yoshimura, E. Katayama, and T. Yanagida. 1998. Dynein arms are oscillating force generators. Nature. 393:711–714. [DOI] [PubMed] [Google Scholar]
- 47.Satir, P. 1998. Mechanisms of ciliary motility: an update. Eur. J. Protistol. 34:267–272. [Google Scholar]
- 48.Hamasaki, T. 1999. Regulation of outer-arm-dynein activity by phosphorylation and control of ciliary beat frequency. Protoplasma. 206:241–244. [Google Scholar]
- 49.Lindemann, C. B. 2002. Geometric clutch model version 3: The role of the inner and outer arm dyneins in the ciliary beat. Cell Motil. Cytoskeleton. 52:242–254. [DOI] [PubMed] [Google Scholar]
- 50.Schmitz, K. A., D. L. Holcomb-Wygle, D. J. Oberski, and C. B. Lindemann. 2000. Measurement of the force produced by an intact bull sperm flagellum in isometric arrest and estimation of the dynein stall force. Biophys. J. 79:468–478. [DOI] [PMC free article] [PubMed] [Google Scholar]
- 51.Sleigh, M. A. 1962. The Biology of Cilia and Flagella. Pergamon, Oxford, UK.
- 52.Konig, K., L. Svaasand, Y. G. Liu, G. Sonek, P. Patrizio, Y. Tadir, M. W. Berns, and B. J. Tromberg. 1996. Determination of motility forces of human spermatozoa using an 800 nm optical trap. Cell. Mol. Biol. 42:501–509. [PubMed] [Google Scholar]
- 53.Tani, T., and S. Kamimura. 1999. Dynein-ADP as a force-generating intermediate revealed by a rapid reactivation of flagellar axoneme. Biophys. J. 77:1518–1527. [DOI] [PMC free article] [PubMed] [Google Scholar]
- 54.Sakakibara, H. M., Y. Kunioka, Y. Takenori, and S. Kamimura. 2004. Diameter oscillation of axonemes in sea-urchin sperm flagella. Biophys. J. 86:346–352. [DOI] [PMC free article] [PubMed] [Google Scholar]
- 55.Kamimura, S., and K. Takahashi. 1981. Direct measurement of the force of microtubule sliding in flagella. Nature. 293:566–568. [DOI] [PubMed] [Google Scholar]
- 56.Ashkin, A., K. Schutze, J. M. Dziedzic, U. Euteneuer, and M. Schliwa. 1990. Force generation of organelle transport measured in vivo by an infrared-LASER trap. Nature. 348:346–348. [DOI] [PubMed] [Google Scholar]
- 57.Hirakawa, E., H. Higuchi, and Y. Y. Toyoshima. 2000. Processive movement of single 22S dynein molecules occurs only at low ATP concentrations. Proc. Natl. Acad. Sci. USA. 97:2533–2537. [DOI] [PMC free article] [PubMed] [Google Scholar]
- 58.Gross, S. P., M. A. Welte, S. M. Block, and E. F. Wieschaus. 2000. Dynein-mediated cargo transport in vivo: A switch controls travel distance. J. Cell Biol. 148:945–955. [DOI] [PMC free article] [PubMed] [Google Scholar]
- 59.Mallik, R., B. C. Carter, S. A. Lex, S. J. King, and S. P. Gross. 2004. Cytoplasmic dynein functions as a gear in response to load. Nature. 427:649–652. [DOI] [PubMed] [Google Scholar]
- 60.Toba, S., T. M. Watanabe, L. Yamaguchi-Okimoto, Y. Y. Toyoshima, and H. Higuchi. 2006. Overlapping hand-over-hand mechanism of single molecular motility of cytoplasmic dynein. Proc. Natl. Acad. Sci. USA. 103:5741–5745. [DOI] [PMC free article] [PubMed] [Google Scholar]