Abstract
To determine whether the antidiabetic action of troglitazone (TGZ), heretofore attributed to insulin sensitization, also involves protection of β cells from lipoapoptosis, we treated prediabetic Zucker Diabetic Fatty rats with 200 mg/kg per day of TGZ. Their plasma-free fatty acids and triacylglycerol fell to 1.3 mM and 111 mg/dl, respectively, compared with 2.0 mM and 560 mg/dl in untreated controls. Their islet triacylglycerol content was 34% below controls. In islets of control rats, β cells were reduced by 82% and the islet architecture was disrupted; β-cell glucose transporter-2 was absent, 85% of their mitochondria were altered, and they were unresponsive to glucose. In treated rats, the loss of β cells was prevented, as were the loss of β cell glucose transporter-2, the mitochondrial alterations, and the impairment of glucose-stimulated insulin secretion. We conclude that the antidiabetic effect of TGZ in prediabetic Zucker Diabetic Fatty rats involves prevention of lipotoxicity and lipoapoptosis of β cells, as well as improvement in insulin sensitivity.
Keywords: Zucker Diabetic Fatty rats, lipotoxicity, lipoapoptosis
The efficacy of troglitazone (TGZ) in improving glucose tolerance in rodents (1) and humans (2, 3) is attributed to improvement in insulin sensitivity. However, TGZ also improves insulin secretion in humans and in Zucker Diabetic Fatty (ZDF) rats with impaired glucose tolerance (2–4). In the latter, there is a striking increase in the triacylglycerol (TG) content of the pancreatic islets (5–7). Initially, the high islet TG content is accompanied by β cell hyperplasia and an increase insulin secretion (8, 9), but ultimately lipoapoptosis of β cells occurs, leaving too few uncompromised β cells to meet the increased insulin requirements of obesity (10) and thus causing diabetes.
The ZDF rat becomes obese because of homozygosity for the fatty (fa) mutation, a Glu-269 to Pro substitution in the extracellular domain of the leptin receptor (11, 12). Whereas normally, leptin action prevents overaccumulation of lipids in the islets (13), in leptin receptor-defective ZDF rats there is a progressive increase in the TG content from the normal level of 10 ng/islet to as much as 1,000 ng/islet (5). Levels above 500 ng/islet are associated with apoptosis of β cells and overt diabetes. The islet TG deposits in themselves are probably relatively harmless, merely a “parking place” for the excess fatty acids (FAs) in islets derived both from the hyperlipidemia and from de novo lipogenesis within islet cells (6), but their hydrolysis may contribute to abnormally high FA levels in the cells. The lipotoxicity and lipoapoptosis of β cells associated with the TG overload are believed to be the consequence of the FA excess, which increases de novo ceramide synthesis (14, 15) and nitric oxide formation (16), while reducing the antiapoptotic protection of β cells (17). In vitro studies indicate that TGZ lowers the TG content of leptin-unresponsive, fat-laden islets of ZDF rats and protects them from cytokine-induced apoptosis (18). The following study was designed to determine whether TGZ treatment in vivo can prevent the β cell apoptosis that occurs in ZDF rats and causes their diabetes.
METHODS
Animals and Treatments.
Homozygous obese prediabetic ZDF-drt rats (fa/fa), bred in our laboratory from ZDF/drt-fa (F10) stock, purchased from Richard Peterson (University of Indiana School of Medicine, Indianapolis), received standard rat chow (Teklad F6 8664, Madison, WI) and water ad libitum. At 7 weeks of age, half of the rats were changed to a diet of powdered standard chow with TGZ (200 mg/kg per day) (Sankyo), while the other half continued with the standard chow alone. Body weight and food intake were measured weekly. Rats were sacrificed at 14 weeks of age. Institutional guidelines for animal care and use were followed.
Plasma Measurements.
Weekly blood samples from the tail vein were collected at approximately 10 a.m. in hematocrit tubes coated with 20 mM EDTA. Plasma glucose was assayed by using a Beckman Glucose Analyzer II (Beckman Instruments, Brea, CA). Plasma free fatty acids (FFAs) were determined by using the kit from Boehringer Mannheim. Plasma TGs were measured with the Sigma TG kit (GPO-Trinder).
TG Content of Liver, Skeletal Muscle, Heart, and Islets.
Pancreatic islets were isolated according to the method of Naber et al. (19). Other tissues were dissected and placed in liquid nitrogen. About 150 mg of tissues were placed in 3 ml of homogenizing buffer containing 18 mM of tri (hydroxymethyl) aminomethane HCl (pH = 7.5), 300 mM of d-mannitol, and 5 mM of ethylene glycol-bis (β-aminoethyl ether)-N,N,N′,N′-tetraacetic acid and were homogenized by using a TR-10 polytron (Tekmar, Cincinnati) for 30 sec. Lipids were extracted by the method of Folch et al. (20). TG content of tissues was measured as described (6).
Oil Red O Staining and Quantification of Positive Muscle Fibers in Quadriceps Muscle and Diaphragm.
Tissues were immediately frozen in liquid nitrogen and cut on a cryostat microtome. Nine-micrometer thick sections were fixed in 4% formaldehyde for 10 min and stained with oil-red O, according to Lillie and Fullmer (21). Morphometric analysis was performed on 10 fields containing transverse sections of muscle fibers chosen at random in the muscles of each animal. Volume density of each oil-red O positive and negative fiber within the muscular tissue was determined by the point-counting method of Weibel (22). Data are mean ± SEM.
Light and Electron Microscope.
A fragment of the tail of each pancreas was fixed in Bouin’s solution and processed for immunohistochemistry, as described (23). The following antibodies were used: guinea pig anti-pork insulin, lot 573 (1:1,000; 2 h at 20°C), rabbit anti-pork glucagon, lot 15k (1:50; 2 h at 20°C), rabbit anti-rat glucose transporter-2 (GLUT-2), lot 1092 (1:50; 2 h at 20°C). After indirect immunofluorescence staining (FITC-conjugated IgG 1 h at 20°C), sections were photographed, and the area of insulin-positive cells was measured by planimetry (24). For electron microscopy, pancreatic fragments were fixed in 4%, cacodylate-buffered (0.2 M) glutaraldehyde, pH 7.4, for 24 h at 4°C, rinsed in Millonig’s phosphate buffer and postfixed in buffered 1% osmic acid (2 h at 20°C). The specimens then were processed for epoxy embedding (Polybed R 812, Fluka). Thin sections were stained with uranyl acetate and lead citrate and photographed in Philips (Eindhoven, The Netherlands) LS 420 electron microscope.
Perifusion of Cultured Islets.
Groups of 50–100 islets were collected under a stereoscopic microscope, washed twice with Krebs–Ringer bicarbonate/Hepes buffer (pH 7.4, 3 mM glucose), and loaded into a 13-mm chamber containing an 8-mm nylon membrane filter (Millipore). Islets were perifused with buffer containing 3 or 23 mM glucose or 20 mM arginine at a flow rate of 0.8 ml/min for 15 min each as described (25). Immunoreactive insulin was determined by using the Linco Rat Insulin Kit (Linco Research Immunoassay, St. Charles, MO).
Genotyping of ZDF Animals.
DNA was extracted from rat tails (≈8 mm) by proteinase K digestion followed by phenol/chloroform extraction and ethanol precipitation. Primers 5′-GTTTGCGTATGCAAGTCACAG-3′ and 5′-ACCAGCAGAGATTCCGAG-3′ were used to amplify products from 5 ng of genomic DNA in a 50-μl reaction mixture. A PCR protocol of 30 cycles of 94°C for 1 min, 55°C for 90 s, and 68°C for 5 min was used. PCR products were digested with the restriction enzyme MspI for 2 h at 37°C and analyzed on 2% agarose gel.
Data Analysis.
Data are expressed as the mean ± SEM, and statistical significance was analyzed by using two-tailed unpaired Student’s t test.
RESULTS
Effect of TGZ on Food Intake and Body Weight.
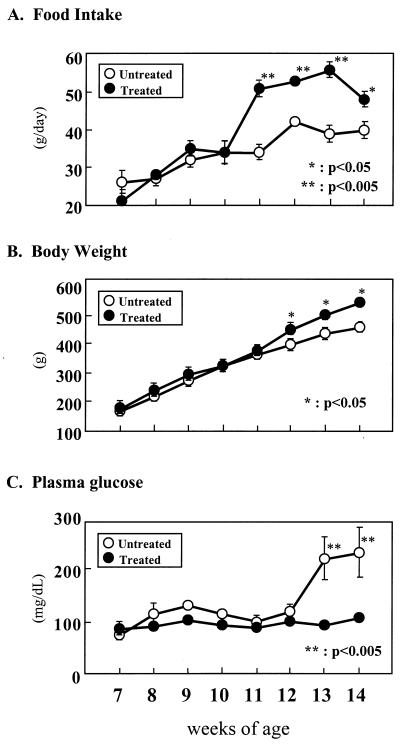
Daily TGZ administration had no effect on food intake or body weight during the first 3 weeks of the experiment. At the end of the fourth week food intake rose 45% and remained significantly above controls for the remaining weeks of the study (Fig. 1A). By the end of the fifth week the body weight of the TGZ-treated rats had risen slightly but significantly above the controls (8.4%; P < 0.05) (Fig. 1B).
Figure 1.
Effects of TGZ treatment on (A) food intake, (B) body weight, and (C) plasma glucose. Untreated obese ZDF (fa/fa) rats are compared with littermates treated with TGZ for 7 weeks. ∗, P < 0.05; ∗∗, P < 0.005.
Effect of TGZ on Plasma Glucose and Lipid Levels.
Plasma glucose levels remained within normal limits in both TGZ-treated and untreated controls through the first 5 weeks of the study. However, at the end of the sixth week (at the age of 13 weeks) all members of the control group had become hyperglycemic with a mean 10 a.m. glucose concentration of 219 ± 40 mg/dl. All six TGZ-treated rats remained normoglycemic, with glucose levels averaging 92 ± 3 mg/dl (Fig. 1C).
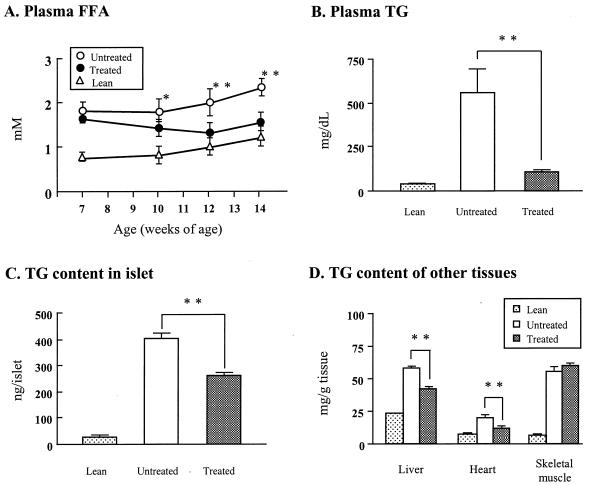
In a previous report of prediabetic ZDF rats FFA levels had risen to more than 1.5 mM at least 2 weeks before the onset of hyperglycemia (5). In the present study of prediabetic ZDF rats, FFA levels were similarly elevated at the start of the study, averaging 1.8 ± 0.3 and 1.6 ± 0.1 mM, in control and treated groups, respectively (not significant) (Fig. 2A). By the fifth week of the study, 1 week before the onset of hyperglycemia in the untreated group, FFA levels had declined to 1.3 ± 0.3 mM in the treated group while rising in the controls to 2.0 ± 0.3 mM (P < 0.005). Plasma TG levels averaged 566 ± 139 mg/dl in the controls, compared with 111 ± 9 mg/dl in the TGZ-treated rats (P < 0.005) (Fig. 2B). Clearly, TGZ treatment had reduced the elevated plasma lipid levels in these obese prediabetic rats, confirming an earlier report (4).
Figure 2.
Effects of TGZ on (A) plasma FFAs, (B) plasma TGs, and (C) TG content of pancreatic islets of TGZ-treated and untreated ZDF controls. Values in lean (+/+) rats also are provided for comparison. (D) TG content of various tissues in TGZ-treated prediabetic ZDF (fa/fa) rats and untreated ZDF controls. Values in lean (+/+) rats are provided for comparison. ∗, P < 0.05; ∗∗, P < 0.005.
Effect of TGZ Treatment on Tissue TG Content.
The lipotoxicity concept (10) assumes that the high plasma levels of FFA and TG, together with an increased lipogenic capacity of the islets (6), cause excess accumulation of FA and TG (steatosis) in nonadipocytes, which results in cellular injury. If this assumption is true, prevention of hyperglycemia by TGZ would be associated with reduced steatosis in various nonadipocyte tissues.
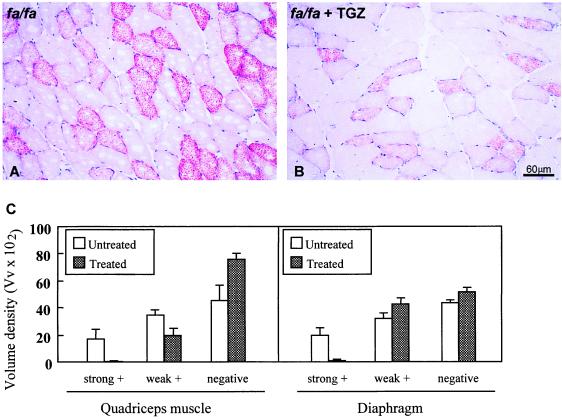
In islets of TGZ-treated rats (Fig. 2C), the TG content of 266 ± 4.8 ng/islet was 34% below untreated controls. Although this result is eight times higher than in islets of normal rats, it is in the range associated with hyperplasia of β cells (5, 9, 10) and is well below the value previously reported to cause lipoapoptosis (5, 6, 14, 15). There was also a statistically significant reduction in the TG content of liver and heart (Fig. 2D). However, the TG content was not reduced in the skeletal muscle of TGZ-treated rats. We attributed this lack of change to the fact that the “marbleized” skeletal muscle of obese rats contains many adipocytes that cannot be separated from the myocytes. To determine whether a TGZ-induced reduction of myocyte TG content might have occurred, we examined skeletal muscle (m. quadriceps and diaphragm) by light microscopy after staining with oil red O (Fig. 3). Fig. 3 A and B show the light microscope appearance of a field of quadriceps muscle in a diabetic (Fig. 3A) and a TGZ-treated (Fig. 3B) rat. The reduction in both the number of stained fibers and in the intensity of staining of the positive fibers is visible in the TGZ-treated rat. Fig. 3C shows the volume density of negative and positive fibers in both conditions and muscle type. This reduction of TG skeletal muscle fibers may have been a factor in the improved insulin sensitivity.
Figure 3.
Oil red O staining of skeletal muscle (quadriceps) for TG showing the high levels of TG in myocytes of untreated ZDF rats and a reduction in TGZ-treated ZDF rats. (A) Quadriceps muscle of an untreated ZDF rat. (B) Quadriceps muscle of a ZDF rat treated with TGZ. (C) Volume density (Vv × 102) of oil-red O positive and negative muscle fibers in the quadriceps muscle and diaphragm of untreated ZDF rats and TGZ-treated ZDF rats. Three diabetic rats and two TGZ-treated animals were evaluated.
Effect of TGZ Treatment on Islet Morphology.
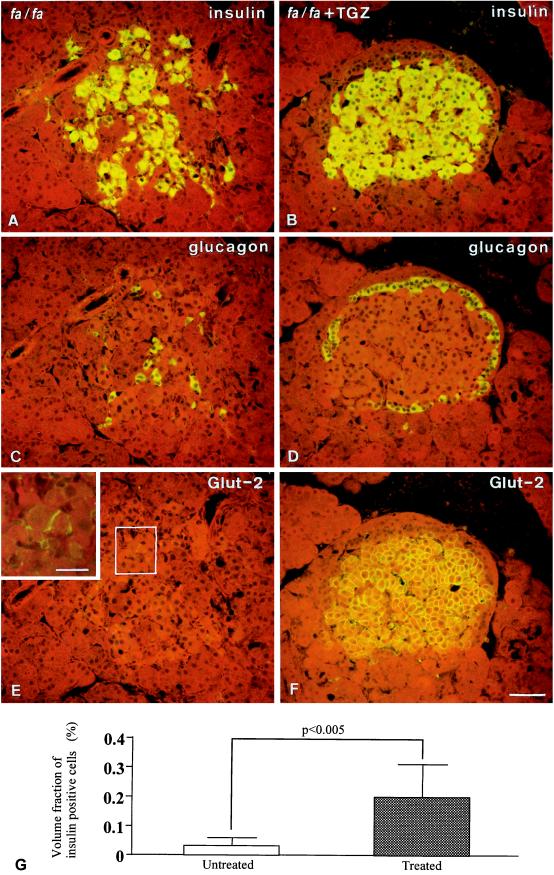
If FA excess is the cause of the previously reported 75% reduction in β cell area associated with the development of hyperglycemia (23), this consequence might be prevented by the lipopenic action on islets resulting from TGZ treatment. This was, in fact, the case. A total of 306 islets from six untreated rats and 434 islets from six treated rats were evaluated. The β cell area of TGZ-treated rats was 5.4 times larger than that of the untreated controls [20.5 × 104 μm2 (0.2 ± 0.1% of observed area) vs. 3.8 × 104 μm2 (0.04 ± 0.02% of observed area)] (P < 0.005), indicating that the phase of compensatory hyperplasia of β cells observed in the prediabetic phase of the obese ZDF rats was maintained as the result of TGZ treatment. By contrast, in the untreated controls, 82% of β cell population had disappeared during the 6 weeks of observation. β cells were replaced by fibrous tissue and the islet architecture was grossly distorted, as revealed by displacement of glucagon-containing α cells from their normal location around β cells. By contrast, the normal distribution of α cells was preserved in TGZ-treated rats (Fig. 4). β cell GLUT-2, which disappears from diabetic β cells (26), was present in β cells of treated rats (Fig. 4 E and F). Fig. 4G shows the quantitation of insulin immunoreactive β cells in diabetic rats versus TGZ-treated animals.
Figure 4.
Immunofluorescent staining for insulin (A and B), glucagon (C and D), and GLUT-2 (E and F) in consecutive sections of an islet of an untreated ZDF rat (A, C, and E) and one of a TGZ-treated (B, D, and F) ZDF rat. Compared with the treated condition, the untreated islet shows a reduced number of dispersed insulin-staining cells (A), glucagon-staining cells that have been displaced from their characteristic peripheral location in the islet by the topographical changes (C), and a marked reduction in the GLUT-2 fluorescence in β cells (E). (E, Inset) Enhancement of the staining in a few cells by confocal microscopy. (G) The quantitation of insulin immunoreactive β cells in diabetic rats versus TGZ-treated animals. (Bar in F = 50 μm; in the Inset, 20 μm.)
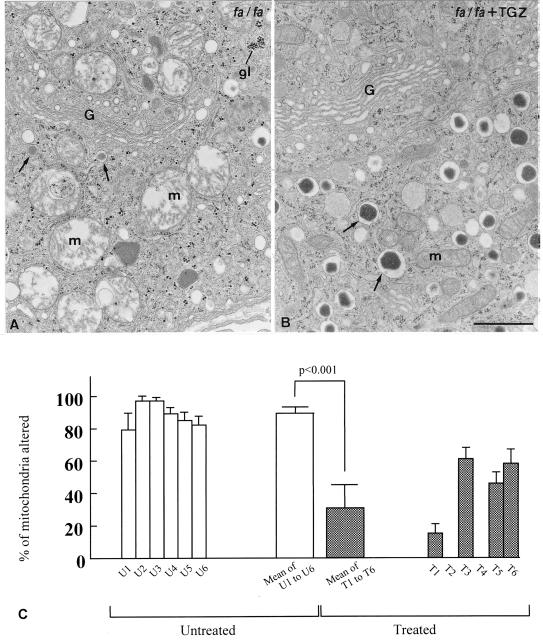
At the ultrastructural level, a striking abnormality in the β cells of untreated obese ZDF rats was the alteration of more than 85% of mitochondria (Fig. 5A), which consisted of swelling of the matrix and disruption of the cristae. In addition, there was marked degranulation of the β cells and glycogen infiltration. In the islets of TGZ-treated rats, by contrast, mitochondrial alteration was observed in only 32% of mitochondria (P < 0.001), and insulin granules were abundant (Fig. 5B). Fig. 5C shows the percentage of altered mitochondria.
Figure 5.
(A) Thin section of an insulin cell from an untreated ZDF fa/fa rat, showing alterations of mitochondria (m) and reduction in the number of dense core secretory granules; areas of dense particles representing glycogen (gl) also can be detected with high frequency. (B) Thin section of a β cell from a TGZ-treated ZDF fa/fa rat. Both mitochondria and dense core secretory granules appear normal in aspect and number. G = Golgi complex. (C) The percentage of altered mitochondria was established on the basis of the following morphologic criteria: swelling of the matrix, disruption of the cristae, or presence of myelin-like figures. The open bars to the left indicate the values for the six untreated rats (U1-U6); the closed bars to the right show the values for the six treated rats (T1-T6). The wide bars in between represent the values of each experimental category. Three islets per rat and eight β cells per islet were evaluated. (Bar = 1 μm.)
Effect of TGZ Therapy on β Cell Function.
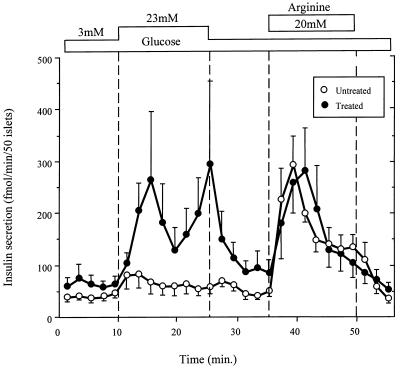
Whereas the untreated ZDF controls exhibited severe attenuation of glucose-stimulated insulin secretion, the secretory response of the TGZ-treated rats was normal (Fig. 6).
Figure 6.
Insulin response to glucose and arginine of perifused islets isolated at 14 weeks of age from TGZ-treated ZDF (fa/fa) rats and untreated controls. The treated rats were still normoglycemic whereas the untreated rats had become diabetic.
DISCUSSION
We previously have demonstrated that β cell dysfunction and diabetes in obese ZDF rats are associated with accumulation of TG (steatosis) (5, 6). We have reported that TGZ-mediated reduction in the TG content of fat-laden ZDF islets improves β cell function in vitro (25). Because in vivo treatment of such rats with TGZ during the prediabetic phase (1) improves β cell function (4), and also prevents diabetes, we attempted here to determine whether this antidiabetic efficacy in vivo is, at least in part, related to direct effects of the drug on the compensated islets, rather than entirely caused by its insulin-sensitizing action (2, 3). We find that TGZ treatment, which, in confirmation of earlier reports (1–4), prevents hyperglycemia, also prevents the loss of 82% of β cell area, and the distortion and scarring of islets that otherwise occur in these rats do not take place. The severe mitochondrial alterations and the degranulation of β cells, so striking in untreated rats, are minimized. In concert with this dramatic morphological rescue of β cells, functional rescue also was observed, reflected by the normal glucose-stimulated insulin response, which was absent in the untreated controls. Thus, the most conspicuous functional and morphologic abnormalities of this form of diabetes were completely prevented, as was the diabetes itself. Because the TG content in islets of TGZ-treated rats was well below 300 ng/islet, the apoptotic effect of the lipid overload undoubtedly was attenuated, while its stimulation of hyperplasia persisted. Lipoapoptosis occurs only after the TG content reaches 500 ng/islet (6, 10).
The association of the TGZ-induced reduction of islet steatosis with the prevention of islet pathology is consistent with, but does not prove, a cause-effect relationship between the two. However, there are other highly supportive links between the lowering of islet FA and the prevention of lipoapoptosis of β cells. First, TGZ reduces the high level of expression of lipogenic enzymes such as acyl-CoA synthetase and glycerol-3-phosphate acyl transferase (17) in islets of ZDF rats, thereby lowering islet FA. Second, triacsin C, a blocker of acyl-CoA synthetase, also prevents the accumulation of FA and blocks lipoapoptosis of β cells (14). Third, peroxisome proliferator-activated receptor-γ ligands such as TGZ, which inhibit the expression of inducible nitric oxide synthetase in macrophages (27), also inhibit nitric oxide production in islets, which is known to prevent lipoapoptosis of β cells (14). Based on the foregoing facts, it would appear that in the present study, the antidiabetic action of TGZ is a consequence, not only of improved insulin sensitivity, but also of protection of β cells from lipoapoptosis.
Not addressed in this study is the apparent paradox of catabolic, antilipogenic actions of TGZ on the fat-laden pancreatic islets. TGZ is a ligand of peroxisome proliferator-activated receptor-γ (PPARγ), which is a major regulator of fat cell-specific gene regulation and differentiation in white adipose cells (28, 29). It is unclear how TGZ might promote energy storage in adipocytes and yet promote energy dissipation in islets. Conceivably, the presence of the PPARγ coactivator, PGC-1 (30), could explain how TGZ induces up-regulation of uncoupling protein 2 in islets (25), just as its presence in brown adipose tissue explains up-regulation of uncoupling protein 1 therein (30).
Whatever the molecular mechanism, this evidence in rodents that TGZ protects β cells from lipoapoptosis implies that part of the therapeutic action of TGZ in human noninsulin-dependent diabetes may be the result of prevention of β cell loss. Although it remains to be shown that similar β cell salvage will occur at the much lower TGZ dose levels used in humans, it would seem important to determine whether early intervention with TGZ treatment in incipient obesity-related noninsulin-dependent diabetes mellitus will arrest β cell loss while controlling the hyperglycemia.
Acknowledgments
We thank Tess Perico for excellent secretarial work, Kay McCorkle for medical illustration skills, and Shirley Waggoner for technical support. Dr. Michio Shimabukuro and Dr. Lindsey Inman provided technical advice. We thank Christopher B. Newgard, Ph.D. and Abhimanyu Garg, M.D., for careful review of this manuscript. This work was supported by the National Institutes of Health (DK02700-37), National Institutes of Health/Juvenile Diabetes Foundation Diabetes Interdisciplinary Research program, Department of Veterans Affairs Institutional Support (SMI 821-109), Sankyo, Novo Nordisk, and Swiss National Science Foundation (L.O.).
ABBREVIATIONS
- TGZ
troglitazone
- ZDF
Zucker Diabetic Fatty
- TG
triacylglycerol
- FA
fatty acid
- GLUT-2
glucose transporter-2
- FFA
free fatty acid
References
- 1.Fujiwara T, Yoshioka S, Yoshioka T, Ushiyama I, Horikoshi H. Diabetes. 1988;37:1549–1558. doi: 10.2337/diab.37.11.1549. [DOI] [PubMed] [Google Scholar]
- 2.Nolan J J, Ludvik B, Beerdsen P, Joyce M, Olefsky J. N Engl J Med. 1994;331:1188–1193. doi: 10.1056/NEJM199411033311803. [DOI] [PubMed] [Google Scholar]
- 3.Cavaghan M K, Ehrmann D A, Byrne M M, Polonsky K S. J Clin Invest. 1997;100:530–537. doi: 10.1172/JCI119562. [DOI] [PMC free article] [PubMed] [Google Scholar]
- 4.Sreenan S, Sturis J, Pugh W, Burant C F, Polonsky K S. Am J Physiol. 1996;271:E742–E747. doi: 10.1152/ajpendo.1996.271.4.E742. [DOI] [PubMed] [Google Scholar]
- 5.Lee Y, Hirose H, Ohneda M, Johnson J H, McGarry J D, Unger R H. Proc Natl Acad Sci USA. 1994;91:10878–10882. doi: 10.1073/pnas.91.23.10878. [DOI] [PMC free article] [PubMed] [Google Scholar]
- 6.Lee Y, Hirose H, Zhou Y T, Esser V, McGarry J D, Unger R H. Diabetes. 1997;45:408–413. doi: 10.2337/diab.46.3.408. [DOI] [PubMed] [Google Scholar]
- 7.Unger R H, Zhou Y T, Orci L. Proc Natl Acad Sci USA. 1999;96:2327–2332. doi: 10.1073/pnas.96.5.2327. [DOI] [PMC free article] [PubMed] [Google Scholar]
- 8.Zhou Y P, Grill V E. J Clin Invest. 1994;93:870–876. doi: 10.1172/JCI117042. [DOI] [PMC free article] [PubMed] [Google Scholar]
- 9.Milburn J L, Jr, Hirose H, Lee Y, Nagasawa Y, Johnson J, Unger R H. J Biol Chem. 1995;270:1295–1299. doi: 10.1074/jbc.270.3.1295. [DOI] [PubMed] [Google Scholar]
- 10.Unger R H. Diabetes. 1995;44:863–870. doi: 10.2337/diab.44.8.863. [DOI] [PubMed] [Google Scholar]
- 11.Phillips M S, Liu Q, Hammond H, Dugan V, Hey P, Caskey C T, Hess J F. Nat Genet. 1996;13:18–19. doi: 10.1038/ng0596-18. [DOI] [PubMed] [Google Scholar]
- 12.Iida M, Murakami T, Ishida K, Mizuno A, Kuwajima M, Shima K. Biochem Biophys Res Commun. 1996;224:597–604. doi: 10.1006/bbrc.1996.1070. [DOI] [PubMed] [Google Scholar]
- 13.Shimabukuro M, Koyama K, Chen G, Wang M-Y, Trieu F, Lee Y, Newgard C B, Unger R H. Proc Natl Acad Sci USA. 1997;94:4637–4641. doi: 10.1073/pnas.94.9.4637. [DOI] [PMC free article] [PubMed] [Google Scholar]
- 14.Shimabukuro M, Zhou Y T, Levi M, Unger R H. Proc Natl Acad Sci USA. 1998;95:2498–2502. doi: 10.1073/pnas.95.5.2498. [DOI] [PMC free article] [PubMed] [Google Scholar]
- 15.Shimabukuro M, Higa M, Zhou Y T, Wang M Y, Newgard C B, Unger R H. J Biol Chem. 1998;273:32487–32490. doi: 10.1074/jbc.273.49.32487. [DOI] [PubMed] [Google Scholar]
- 16.Shimabukuro M, Ohneda M, Lee Y, Unger R H. J Clin Invest. 1997;100:290–295. doi: 10.1172/JCI119534. [DOI] [PMC free article] [PubMed] [Google Scholar]
- 17.Shimabukuro M, Wang M-Y, Zhou Y-T, Newgard C B, Unger R H. Proc Natl Acad Sci USA. 1998;95:9558–9561. doi: 10.1073/pnas.95.16.9558. [DOI] [PMC free article] [PubMed] [Google Scholar]
- 18.Shimabukuro M, Koyama K, Lee Y, Unger R H. J Clin Invest. 1997;100:1750–1754. doi: 10.1172/JCI119700. [DOI] [PMC free article] [PubMed] [Google Scholar]
- 19.Naber S P, McDonald J M, Jarett L, McDaniel M L, Ludvigsen C W, Lacy P E. Diabetologia. 1980;19:439–444. doi: 10.1007/BF00281823. [DOI] [PubMed] [Google Scholar]
- 20.Folch J M, Lees M, Stanley G H S. J Biol Chem. 1957;226:497–509. [PubMed] [Google Scholar]
- 21.Lillie R D, Fullmer H M. Histopathologic Technic and Practical Histochemistry. New York: McGraw–Hill; 1976. pp. 559–610. [Google Scholar]
- 22.Weibel E R. In: Principles and Techniques of Electronmicroscopy Biological Application. Hayat M A, editor. New York: Van Nostrand Rheinhold; 1973. pp. 237–296. [Google Scholar]
- 23.Ohneda M, Inman L, Unger R H. Diabetologia. 1995;38:173–179. doi: 10.1007/BF00400091. [DOI] [PubMed] [Google Scholar]
- 24.Orci L, Ravazzola M, Baetens D, Inman L, Amherdt M, Peterson R G, Newgard C B, Johnson J H, Unger R H. Proc Natl Acad Sci USA. 1990;87:9953–9957. doi: 10.1073/pnas.87.24.9953. [DOI] [PMC free article] [PubMed] [Google Scholar]
- 25.Shimabukuro M, Zhou Y-T, Lee Y, Unger R H. J Biol Chem. 1998;273:3547–3550. doi: 10.1074/jbc.273.6.3547. [DOI] [PubMed] [Google Scholar]
- 26.Johnson J H, Ogawa A, Chen L, Orci L, Newgard C B, Alam T, Unger R H. Science. 1990;250:546–549. doi: 10.1126/science.2237405. [DOI] [PubMed] [Google Scholar]
- 27.Ricote M, Li A C, Willson T M, Kelly C J, Glass C K. Nature (London) 1998;391:79–82. doi: 10.1038/34178. [DOI] [PubMed] [Google Scholar]
- 28.Tontonoz P, Hu E, Spiegelman B M. Cell. 1994;79:1147–1156. doi: 10.1016/0092-8674(94)90006-x. [DOI] [PubMed] [Google Scholar]
- 29.Spiegelman B M, Flier J S. Cell. 1996;87:377–389. doi: 10.1016/s0092-8674(00)81359-8. [DOI] [PubMed] [Google Scholar]
- 30.Puigserver P, Wu Z, Park C W, Graves R, Wright M, Spiegelman B M. Cell. 1998;92:829–839. doi: 10.1016/s0092-8674(00)81410-5. [DOI] [PubMed] [Google Scholar]


