

Abstract
Molecular dynamics simulations on quantum energy surfaces are carried out to study the effects of perturbing electric fields on proton transport (PT) in protonated water chains. As an idealized model of a hydrophobic cavity in the interior of a protein the water molecules are confined into a carbon nanotube (CNT). The water chain connects a hydrated hydroniumion (H3O+) at one end of the CNT and an imidazole molecule at the other end. Without perturbing electric fields PT from the hydronium proton donor to the imidazole acceptor occurs on a picosecond time scale. External perturbations to PT are created by electric fields of varying intensities, normal to the CNT axis, generated by a neutral pair of charges on the nanotube wall. For fields above ∼0.5 V/Å, the hydronium ion is effectively trapped at the CNT center, and PT blocked. Fields of comparable strength are generated inside proteins by nearby polar/charged amino acids. At lower fields the system displays a rich dynamic behavior, where the excess charge shuttles back and forth along the water chain before reaching the acceptor group on the picosecond time scale. The effects of the perturbing field on the proton movement are analyzed in terms of structural and dynamic properties of the water chain. The implications of these observations on PT in biomolecular systems and its control by external perturbing fields are discussed.
I. INTRODUCTION
Charge transfer mediated by a chain of molecules is a common process in chemistry and biochemistry, and may involve electron or proton translocation. Proton transfer occurs in bulk liquid 1-7 or in confined environments, e.g., in polymer-electrolyte membranes of fuel cells,8 or in the interior of proteins,9 where different acidic and basic functional groups may be involved in the charge transfer mechanism.10,11 For example, proton transport (PT) plays a role in the biological function of many proteins, such as bacteriorhodopsin,12 gramicidin channels,13 the family of heme-copper oxidases,14 in particular, cytochrome c oxidase,15-17 photosynthetic reaction centers,18 cytochrome P450,11,19 and green fluorescent proteins.20 Molecular dynamics simulations have recently been carried out to investigate PT in bacteriorhodopsin,21 a light-driven bacterial proton pump. Upon isomerization of retinal due to photon absorption, a proton is transferred outside the cell through a mechanism that involves PT along a short water chain connecting an aspartate (Asp96) and a deprotonated Schiff base.21 In contrast, aquaporins22 are transmembrane proteins that efficiently shuttle water molecules through the cell membrane as single-file chains,23,24 but are impermeable to charged species, in particular, protons. These observations raise the question of how chains of water molecules in some proteins appear to serve as efficient proton conductors, and in other proteins effectively block PT. In the case of aquaporins, the structural determinant of this selectivity, which is crucial for proper biological function, is a topic of current investigations.22,23,25,26 The results reported in this paper show how relatively modest changes in the local electrostatics along the PT path can have substantial effects on the PT kinetics.
In biological systems, proton movement is mediated in part by water molecules confined by the surrounding protein. The theoretical study of proton dynamics in real systems is complicated by the local structural inhomogeneity and irregular charge distributions of the surrounding medium. In this respect, carbon nanotubes (CNTs) provide an idealized hydrophobic environment that mimics nonpolar structural pores in proteins,27 such as those found in the proton uptake channels of bacteriorhodopsin,17 cytochrome c oxidase,17,28 or cytochrome P450.11,19 CNTs are fullerene-type cylindrical lattices29 composed of sp2-hybridized carbon atoms. CNT can be singlewalled or multiwalled, with diameters on the order of a nanometer. They are unique in their physical properties, characterized by their unusual elastic strength, efficient electric and thermal conductivities, and unique electronic and optical properties. CNTs have been used to confine water molecules, as in models of protein channels, and to study proton transfer in water chains.27,30,31
Proton transfer in molecular chains and clusters has been studied using a variety of quantum chemical methods.32-34 Studies on H-bonded complexes have shown that perturbation by external electric fields of up to ∼1.0 V/Å introduce significant changes in the energy profile along the reaction paths in proton transfer.35 Electric fields of comparable strength are common in solutions due to the presence of ions36 and near polar/charged residues in the interior of proteins. These fields created by inhomogeneous charge distributions are expected to affect PT in specific ways. Naturally occurring or engineered mutations in proteins are likely to change both the form and the strength of the local field in specific parts of the chain. Similar effects may be elicited by changes in the protein environment due to the binding of a ligand, changes in ionization states of nearby amino acids, structural relaxation, or local conformational fluctuations.11
In this paper, a quantitative study of the effects of perturbing external electric fields on PT along a confined protonated water chain is carried out. Electric fields of up to ∼1.0 V/Å normal to the chain are considered. The effects of the field on the behavior of the system are rationalized in terms of the structural and dynamical properties of the water chain. The paper is organized as follows. The molecular system studied is described in Sec. II, along with a brief overview of the density functional theory (DFT)-based quantum mechanics/molecular mechanics (QM/MM) method used in the simulations. Results are presented in Sec. III, for PT in the absence and in the presence of a perturbing field; the effects of atomic polarization on PT and the choice of basis set are also discussed. Conclusions are presented in Sec. IV, where the results are put in the context of other simulation studies of PT in water chains; the implication of these results on PT in biological systems is also discussed.
II. METHODS
A schematic representation of the system studied here is shown in Fig. 1; it is composed of a CNT, nine water molecules (W1-W9), and an imidazole group C3H4N2. The CNT is a (6,6)-armchair type, single-walled, open-ended carbon nanotube, with a length of ∼13.5 Å and a radius of ∼8Å, containing 144 sp2-carbon atoms with no charge. Five water molecules (W5-W9) are located in the CNT interior and define the water chain; three of the remaining water molecules (W1-W3) are located at one of the CNT ends to partially mimic the solvent effects of a hydration shell (bulk effects are not represented; see discussion in Sec. IV); W4 is positioned at the interface between the solvent and the chain and is assigned an excess proton at the beginning of the simulations (i.e., W4 forms a H O+ 3 ion). The initial coordinates of the water molecules and the CNT were obtained from a snapshot of a classical molecular dynamics simulation reported earlier.30 The basic imidazole molecule is placed at the opposite end of the nanotube, with the unprotonated N3 ring nitrogen on the CNT axis, and ∼1 Å away from the open end. Electric fields of varying intensities “normal” to the CNT axis were generated by a neutral pair of charges, placed on the nanotube wall, and diametrically opposed to one another (±Q in Fig. 1). In addition to the nonperturbed system (Q=0), which is taken as the control simulation, ten other simulations were carried out with values of Q at increments of ΔQ=0.05e, up to a maximum of Q=0.5e. This range of charges creates electric fields at the center of the nanotube in the 0.1-1.0 V/Å range.
FIG. 1.

Schematic representation of the simulation system. Imidazole and water molecules were treated quantum mechanically, and the carbon nanotube (CNT) was treated classically. External perturbations are created by electric fields generated by the charges ±Q on the CNT wall.
The molecular dynamics simulations carried out here are based on a QM/MM formalism.37-39 The imidazole and water molecules are treated quantum mechanically, while the CNT is described by a classical molecular mechanics potential. The classical treatment of the CNT is justified in light of previous results from molecular dynamics (MD) simulations in which both the water chain and the CNT were treated at a QM level.31 The method employed here38,39 makes use of an effective system Hamiltonian operator of the form , where q and c refer to the QM subsystem (8H2O+H3O++C3H4N2) and to the MM subsystem (CNT), respectively. The termĤint is the interaction Hamiltonian between the QM and MM parts; this term accounts for (i) the interactions between the nuclei of the QM subsystem and the carbon atoms of the MM subsystem (Lennard-Jones interactions that effectively confine the water chain), and (ii) the interactions between the electrons and nuclei of the QM subsystem and the external charges ±Q on the nanotube wall (bare Coulomb potential terms). Within the Born-Oppenheimer (BO) approximation the total energy, E,ofthe system is a function of the nuclear (rq) and the atomic (rc) coordinates of the QM and MM subsystems, respectively, i.e., ;Ψ is the normalized wave function of the whole system which also depends on the electron coordinates, r, of the QM part, i.e., . Thus, E is the BO-energy surface that defines the classical mechanics forces Fq and Fc on the nuclei and atoms of the QM and classical subsystems, respectively, through (x is q or c depending on whether the gradient is performed with respect to rq or rc). These forces are subsequently integrated numerically to yield the dynamic trajectories of nuclei and atoms (the Verlet integration algorithm is used here). The total energy can be written as , whereEc is the energy of the CNT, as given by the MM force field. To obtain an expression of E(rq,rc) the QM problem is first solved for fixed rq and rc and an integration on r is then performed. The calculations are carried out using DFT (Refs.40-42) with a B3LYP exchange-correlation functional43,44 and the 6-31G* basis set.45 This level of theory is computationally expensive so only one dynamic trajectory was generated for each value of the perturbing field. Therefore, no statistical analyses of the trajectories are reported and the results are interpreted in light of this limited sampling. Simpler and faster DFT-based semiempirical approaches46 can be used that may speed up the calculations significantly. Although less accurate, these methods may be useful when multiple or longer trajectories are needed to improve sampling or to extract statistical information from the dynamics (e.g., when calculating thermodynamic quantities or error estimates). In the study reported here, however, the lack of a quantitative estimation of the error bars due to limited sampling is partially mitigated by the comparative nature of the simulations and the attempted physical interpretation of the results; systematic errors are probably more important and may have a larger impact on the results, such as the choice of the basis set (addressed in Sec. III), and the QM method used (e.g., DFT versus Hartree-Fock, not discussed). The programs GAMESS (Ref. 47) and CHARMM(Ref. 48) were used here for the QM and MM calculations, respectively; both programs have been interfaced in the CHARMM-GAMESS suite.39
All simulations started with the same system coordinates obtained from a full QM/MM minimization of the nonperturbed system (Q=0). The charges ±Q were then switched on and the system energy minimized; the system was then heated up to T=300 K and an equilibration phase of 0.5 ps followed. In the equilibration phase velocities from a Maxwell-Boltzmann distribution function were reassigned every 20 fs to all the atoms and nuclei of the system. After the equilibration period terminated (i.e., when the process of reassigning velocities was interrupted) the average temperature was monitored every 50 fs for an additional period of 0.2 ps. The temperature in this free dynamics remained essentially constant, with no indication of an overall drift. During heating and equilibration a restraint was applied to the protons of the H3O+ ion on W4 to prevent PT during these phases (early PT was observed in a preliminary test study). The restraint consisted of a potential of the form V(r) =V0θ(r-r0)(r-r0)2[θ(x) is the Heaviside step function, V0=2.2 eV and r0=1.15 Å] applied to each proton of H3O+, where r is the proton-oxygen distance. With this potential the protons are unperturbed as long as their distances to the central oxygen atom are not larger than r0. Upon equilibration a production phase of ∼4 ps was generated at constant energy for each value of Q, and data were collected every 1.0 fs for analysis. In a preliminary set of simulations, the imidazole drifted into the CNT interior as the simulations proceeded, while the internal water molecules emerged from the opposite end, becoming part of the solvent that initially hydrated the excess proton. These structural changes were small for the nonperturbed system, but became noticeable as Q increased, preventing a systematic comparison of the dynamics. Therefore, harmonic restraints (force constant k =45 eV/Å2) were applied to the unprotonated N3 nitrogen of the imidazole ring and to four carbon atoms in one of the nanotube ends to hold the imidazole outside the CNT; the restraints were applied during all phases of the simulations (heating/equilibration/production), thus permitting a systematic comparison of the trajectories; all other atoms/nuclei in the system remained free of any constraint during all the phases of the simulation.
III. RESULTS
Complete proton transfer is defined here when the excess charge is transferred irreversibly (on the simulation time scale) from W4 at the beginning of the production phase (t =0) to the N3 nitrogen of the imidazole ring at t=tT(total transfer time). A water molecule is considered to have an excess charge of +1 if three protons are within 1.3 Å from its central oxygen at the same time; similarly, the imidazole molecule has an excess charge of +1 if a proton is within 1.3 Å of the N3 nitrogen. This definition permits a clear visualization of the dynamics of the charge in the system and its propagation along the chain. Transient H5O+2(dihydronium) species may be formed if a central proton is within 1.3 Å from the oxygen atoms of two water molecules; similarly, H7O+3(trihydronium) transient species occur if a central H3O+ ion shares two of its protons with two neighboring water molecules.
In the absence of solvent and the imidazole molecule complete PT does not occur (data not shown). In that case, the excess proton moves along the chain to the center of the nanotube where it is stabilized mainly as a H3O+ ion, as seen in earlier simulations of protonated water chains.49,53 The solvent and the imidazole molecule introduced at the ends of the CNT break the symmetry of the system, providing the energy gradient required for complete PT; this gradient, however, is not due to direct electrostatic interactions between the net-neutral imidazole and the positive excess charge.
A. Proton transfer in the nonperturbed system(Q=0)
The time evolution of the internuclear distances provides the simplest characterization of the system dynamics. The distance between a nucleus X (OorH) of a water molecule Wn and a nucleus Y of Wm is here denoted by dXn-Ym, and between a nucleus X of Wn and nitrogen N3 of the imidazole ring, by dXn-N. Figure 2 shows the distances dH4-O4 and dH9-N as a function of time for the first 1.8 ps of simulation (unless otherwise noted the hydrogen labels, here H4 and H9, refer to the proton being transferred). The water molecule W4 releases its excess proton to W5 within ∼0.1 ps, although fluctuations are observed that result in a transient recombination within ∼0.7 ps. The excess proton on W4 is irreversibly released to W5 at ∼0.7 ps while protonation of the imidazole ring occurs at tT∼1.2 ps, after a delay of ∼0.5 ps during which time the proton moves throughout the chain. It is of interest to analyze in detail how the excess charge propagates along the water chain. A schematic representation of the time evolution of the excess charge is shown in Fig. 3. A back-and-forth movement along the chain is apparent prior to the protonation of the imidazole; the arrows indicate the approximate point in the trajectory where the movement of the charge reverses direction. Close inspection of the dynamics shows that transient (∼20-50 fs) dihydronium ions form frequently before the proton reaches the acceptor at tT; trihydronium ions are infrequent and short lived (<10 fs). Figure 3 shows that the charge is mostly confined within the first half of the nanotube (W4-W7), with brief excursions to W8 at ∼0.5 and ∼0.9 ps (actually, these events lead to the formation of W7-W8 dihydronium species, meaning that the charge is not completely transferred to W8), only reaching W9 right before complete transfer occurs. Figure 4 shows the cascade of events that precede the fast protonation of the imidazole. At t∼1 ps the movements of the nuclei within the chain appears to “synchronize,” resulting in a fast and concerted propagation of the excess charge between adjacent water molecules and along the entire water chain; similar behavior was observed previously in the dynamics of PT in bacteriorhodopsin.21 The arrows A and B in Fig. 3 indicate the beginning and end of this fast charge movement, which occurs within ∼100 fs and spans a distance of about 14 Å (i.e., the proton is transferred from W4 to the imidazole in a concerted, fast motion that involves the entire chain). The movement of the excess charge in this time interval is displayed in the inset of Fig. 3, showing that even during this final fast-transfer motion the excess charge briefly shuttles back when it passes through the middle of the nanotube.
FIG. 2.

W4 proton-oxygen (dH4-O4) and W9 proton-nitrogen (dH9-N) distances as a function of time in the nonperturbed system (Q=0); desolvation of the excess proton occurs at tD while protonation of the imidazole ring occurs at tT(total PT time); only the first 1.8 ps of simulation are shown.
FIG. 3.
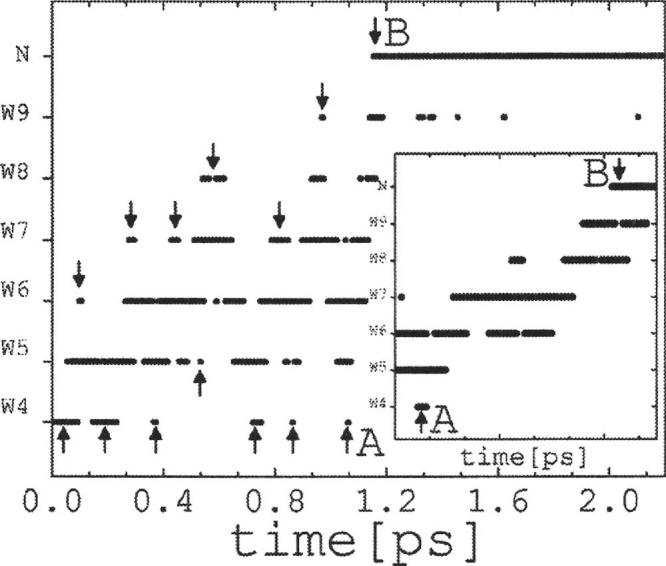
Location of the excess charge along the chain as a function of time for the unperturbed system (Q=0). Arrows mark the approximate points where the charge reverses direction of motion; A and B show the final, fast (100 fs) charge transfer between the ends of the CNT over a distance of ∼14 Å (see inset)
FIG. 4.
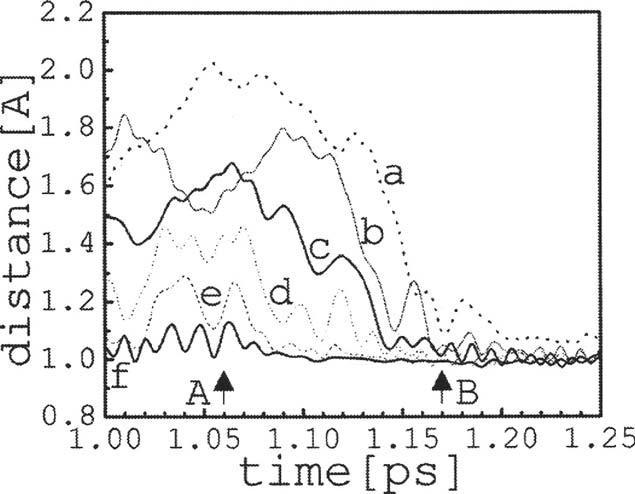
Atom-pair distances along the water chain as a function of time for the last 250 fs prior to complete PT in the nonperturbed system (see inset in Fig. 2 for definitions):(a)dH9-N, (b) dH8-O9, (c) dH7-O8, (d) dH6-O7, (e)dH5-O6, and (f) dH4-O5; arrows A and B are as in Fig. 3.
B. Proton transfer in the presence of perturbing electric fields(Q≠0)
External electric fields acting upon the water chain modify the observed dynamic behavior of the system. Figure 5 shows the propagation of the excess charge along the chain for different values of perturbing fields at the center of the CNT in the range of ∼0.1-1.0 V/Å. For electric fields lower than ∼0.4 V/Å (Q<0.2e) the charge moves back and forth, spanning the entire chain. As the field increases the excess charge becomes more localized about the middle of the CNT, although in the simulation with a field ∼0.45 V/Å (Q=0.25e) complete PT is still observed. For ∼0.55 V/Å (Q=0.3e) the charge shuttles back and forth through the central water W7, moving mainly between W6 and W8, with only a brief transfer to the imidazole at t∼2.2 ps; however, complete PT does not occur. These plots show that for fields above ∼0.5 V/Å the excess charge is effectively “trapped” in the middle of the nanotube, and PT is not observed within the duration of the simulation. In this case, the local field stabilizes the H3O+ ion formed when the proton passes through W7, as shown schematically in Fig. 6. In effect, the electric field at the center of the CNT induces a structural defect in the water chain that blocks the proton movement. The field forces the hydronium ion to move towards the negative charge (-Q), away from the positive charge (+Q). At the same time the ion is reoriented in such a way that one of the hydrogen atoms points directly toward -Q. This structural rearrangement forces the nearest water molecules (W6 and W8) to move slightly closer to +Q. Thus, for a field ∼0.55 V/Å (Q=0.3e) the distance between +Q and the O nuclei of W6 and W7 (a and b in Fig. 6) calculated from the last 3 ps of the trajectory are ∼4.8 and ∼5.0 Å, respectively, and the distance between -Q and the O in W7 (c in Fig. 6) is ∼3.8 Å; the fluctuations around these values yield standard deviations of ∼0.5 Å in all cases. These distances shorten slightly as the field increases and the fluctuations become smaller as well, although the geometrical arrangement remains the same. The average LO distances between neighboring water molecules are not strongly affected by the strength of the perturbing field, remaining at dO6-O10 ∼dO8-O10 ∼2.5 Å with fluctuations of ∼0.1 Å. (This requires W6 and W8 to come slightly closer to each other as the field increases.) The central ion is pushed closer to -Q and its positional fluctuations drop sharply as the perturbing field increases. This suggests that the central ion becomes stabilized in a narrow local potential well, which forces the rest of the chain to accommodate around it. With this configuration the protons shared between the central ion and the adjacent water molecules are unable to overcome (within the 4 ps of the simulation time) the activation energy required for PT in either direction. The energy barrier for PT from the central ion is likely to be enhanced as the electric field increases. Therefore, local electric fields in the range of 0.5-1.0 V/Å normal to the CNT define a threshold for an external perturbation to dramatically hinder (or block) the transfer of a single proton through the chain (cf. Sec. IV). For electric fields lower than ∼0.5 V/Å, PT seems to be determined by a delicate balance between (i) the magnitude of the perturbing field, which tends to orient the water molecules (dipoles) in a direction “normal” to the CNT axis, and (ii) the reorienting force exerted by the water-water interactions within the chain that tend to align the water molecules in the direction of the CNT axis. This suggests the existence of an intermediate regime where the external and internal fields in the middle of the chain are of comparable magnitude. This competition of forces may explain the variations observed in the transfer times tT for fields lower than ∼0.5 V/Å, e.g., tT is ∼1 ps for Q=0.15e, increases to ∼2 ps for Q=0.2e, and drops again to ∼1 ps for Q=0.25e. It may also explain the qualitative changes observed in the dynamics of the excess charge upon small variations of the external field, although the number of trajectories is not sufficient to draw statistically meaningful conclusions on this. As shown in Fig. 5, the charge is confined mainly to the first half of the chain, between W4 and W7; this behavior is similar to that in the nonperturbed system. For example, for Q <0.15e the charge makes brief excursions to W8 at t ∼0.3-0.6 ps and moves to W9 only just before complete PT occurs. The behavior changes, however, for Q=0.2e, in which case the charge moves back and forth along the entire chain, moving frequently between W8 and W9. At Q =0.25e the behavior changes again, whereby the charge does not cross the middle of the nanotube until the last ∼100 fs prior to PT. The charge then rapidly crosses W8 and W9 to reach the imidazole ring.
FIG. 5.

Location of the excess charge along the chain as a function of time in perturbed systems (Q≠0). See Fig. 3 for details. Complete PT occurs for Q <0.3e and proton blockage for Q >0.3e.
FIG. 6.
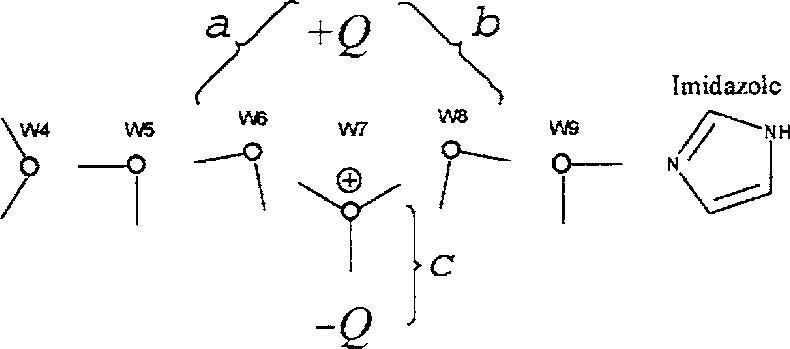
Schematic representation of the structural defect (H3O+ on W7) induced on the water chain (for Q<0.3e). The distances a, b, and c and their fluctuations decrease as the perturbing field increases.
C. Effects of atomic polarization and the choice of basis set
To assess the effect of atomic polarization on the PT process, two additional simulations were carried out in the nonperturbed system (Q=0) using the 6-31G and 6-31G** basis sets.45 As suggested by the time evolution of theLO distances between W4 and W5 (Fig. 7), the 6-31G basis set produces the strongest water-water hydrogen bonds, followed by the 6-31G** and 6-31G* basis sets. Introducing atomic polarization leads to a quite different dynamics, as shown in Fig. 8. The simulation protocols were the same in all three cases; thus, aside from statistics, the difference in the proton behavior resulted from the effects of polarization only. Although the excess charge moves between both ends of the CNT in all cases, the lack of polarization led to a more random proton movement between contiguous water molecules in the 6-31G simulations [cf. Fig. 8(a)] than when polarization was included (either at the 6-31G*[cf. Fig. 3] or 6-31G**[cf. Fig. 8(b)] levels). In addition, when the proton reaches the imidazole ring a rapid recombination with the water chain ensues, preventing complete PT within the entire ∼4 ps of the 6-31G simulation time [cf. Fig. 8(a)]. It appears that the lack of polarization renders the proton affinity of the imidazole molecule similar to that of the water chain, presumably because of the stronger interactions between the water molecules within the chain. As a result the proton bounces back and forth in a seemingly random fashion, with a high incidence of dihydronium and trihydronium species. On the other hand, introducing polarization leads to complete PT, indicating a more favorable proton affinity of the imidazole molecule with respect to the water chain. Although quantitative differences are observed in the proton transfer times, the behavior of the system with the 6-31G* and the 6-31G** basis sets is qualitatively similar. Because of the considerable reduction in computer time, however, the 6-31G* basis set was used in this study.
FIG. 7.
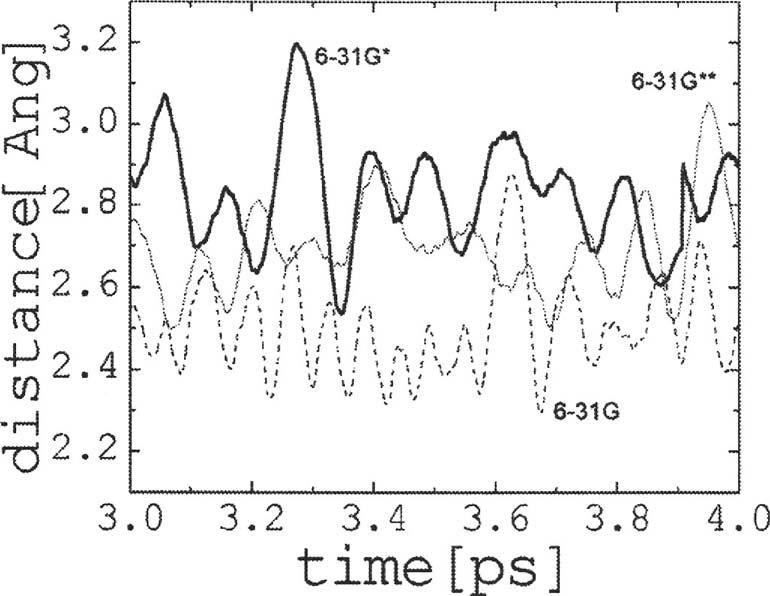
Oxygen-oxygen distance between water molecules W4 and W5 for the last 1 ps of simulation in the nonperturbed system calculated with the 6-31G, 6-31G*, and 6-31G** basis sets. Lack of polarization shortens the LO distances between contiguous water molecules, reflecting stronger water-water interactions along the chain. Introducing polarization on the hydrogen atoms and/or heavy atoms leads generally to largerLO distances.
FIG. 8.
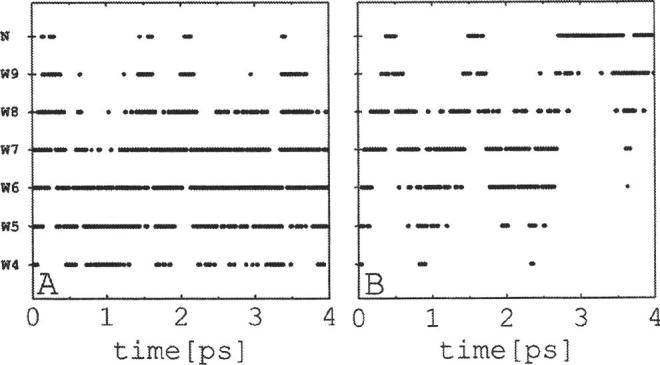
Location of the excess charge along the chain as a function of time in unperturbed systems (Q=0) for simulations using the (a) 6-31G and (b) 6-31G** basis sets. See Fig. 3 for additional details. Without polarization complete PT is not observed within the 4 ps of the simulation [6-31G basis set in panel (a)].
IV. DISCUSSION AND CONCLUSIONS
The effects of perturbing electric fields on transport of a single proton along a water chain were systematically studied through QM/MM molecular dynamics simulations. It was shown that small changes in the magnitude of the electric field normal to the PT direction of movement profoundly affect the proton dynamics and the resulting charge transfer in the system. The behavior of the excess charge along the nanotube appears to be dictated by the delicate balance of two competing effects: (i) the orienting force exerted by the water-water interactions within the chain that tends to align the dipoles in the direction of the nanotube axis (the dominant effect operating in the nonperturbed system), and (ii) the force exerted by the perturbing field, which tends to orient the dipole moments of the central water molecules in a direction “normal” to the nanotube axis, thus introducing a perturbation on the self-aligning properties of the chain. In the low electric field regime (<0.5 V/Å) this competition leads to a relatively complex dynamics of the water molecules and excess charge. A back-and-forth motion of the charge is observed in all cases, spanning the entire chain but concentrated mainly in the middle of the nanotube. PT is observed on the picosecond time scale and occurs upon a synchronization of movements of O and H nuclei (cf. Fig. 4). Fast PT occurs once the proton crosses the middle of the nanotube; after PT, the imidazole remains protonated until the end of the simulation. The final shuttling of the proton from W4 to the imidazole ring, a distance of ∼14 Å, takes place in just ∼100 fs, and involves the concerted proton transfer between neighboring water molecules (cf. Figs. 3 and 4). Similar fast PT along confined water chains was observed in simulations using classical mechanics force fields,49 and empirical valence bond50 (EVB)-based methods.31,51,52 At higher fields (>0.5 V/Å) the external perturbation induces a structural defect in the middle of the nanotube in the form of a stable hydronium ion that prevents PT in either direction. Regardless of the strength of the electric field the movement of the proton through the middle of the nanotube (charge transfer involving W7) appears to limit the transport process.
The results reported here suggest that in biological systems PT (or its blockage) may be strongly affected by modest changes in local electric fields, as required for proper biological function. External perturbations may slow down or speed up the proton transport process as determined by the environmental conditions. In the system studied here such modulation of the proton transfer rate occurs without directly modifying the proton affinities of the donor and acceptor groups. Strong perturbations may increase the activation barriers to effectively block proton movement within biologically relevant time scales. Such perturbations have recently been studied in the interior of aquaporins26 where amino acid side chains interact directly with the quasi-one-dimensional water chain by forming hydrogen bonds. The results reported here show that electrostatic perturbations (with nearby functional groups in the case of proteins) may elicit similar effects on the proton dynamics resulting in effective PT blockage.
The realistic calculation of PT in transmembrane channels requires accounting for the effects of bulk solvent (at both sides of the membrane) on the movement of the excess charge along the channel axis. When a CNT is used as a model for such systems, an external solvent force of electrostatic origin operates on the excess charge moving along the chain, in addition to the forces exerted by the water chain itself (and possibly by the acceptor/donor molecules, as studied here). Simple theoretical considerations and recent computer simulations of proton54 and ion transport55,56 suggest that the solvation/desolvation electrostatic energy has a maximum near the middle of the CNT, i.e., where the free energy of a protonated water chain (in the absence of the donor/acceptor groups) has a flat minimum, as discussed above.49,53 The resulting free energy profile is a superposition of these two opposing effects, and its critical balance determines the dynamics and kinetics of PT between the acid and base located at the CNT ends. Therefore, accurate quantitative estimates of the resulting free energy profile56 are necessary prior to determining the relative importance of the forces that control PT in systems where bulk solvation/desolvation effects cannot be neglected.
PT during the transition from the late M state to the N state of bacteriorhodopsin, more closely resembles the conditions studied here, at low electric fields. In bacteriorhodopsin, once Asp96 releases the proton to the first water molecule in the chain, PT to the Schiff base appears to be a fast, concerted process,21 similar to that in the CNT at low electric fields.
ACKNOWLEDGMENTS
The authors thank Dr. Milan Hodoscek for valuable discussions on the CHARMM-GAMESS interface and the QM/MM method used in this study. One of the authors (G.H.) thanks Professor Jayendran Rasaiah and Professor Christoph Dellago for many helpful and stimulating discussions. This study utilized the high-performance computational capabilities of the Beowulf PC/LINUX clusters at the NIH (http://biowulf.nih.gov) and at the Center for Molecular Modeling of the NIH (http://cmm.cit.nih.gov). This research was supported by the Intramural Research Program of the NIH, through the Center for Information Technology, and the National Institute of Diabetes and Digestive and Kidney Diseases, U.S. Department of Health and Human Services, Bethesda, Maryland.
References
- 1.Kreuer K-D. Chem. Mater. 1996;8:610. [Google Scholar]
- 2.Geissler PL, Dellago C, Chandler D, Hutter J, Parrinello M. Science. 2001;291:2121. doi: 10.1126/science.1056991. [DOI] [PubMed] [Google Scholar]
- 3.Asthagiri D, Pratt LR, Kress JD, Gomez MA. Proc. Natl. Acad. Sci. U.S.A. 2004;101:7229. doi: 10.1073/pnas.0401696101. [DOI] [PMC free article] [PubMed] [Google Scholar]
- 4.Bakker HJ, Nienhuys H-K. Science. 2002;297:587. doi: 10.1126/science.1073298. [DOI] [PubMed] [Google Scholar]
- 5.Marx D, Tuckerman ME. J. Hutter, and M. Parrinello, Nature (London) 1999;397:601. [Google Scholar]
- 6.Tuckerman ME, Laasonen K, Sprik M. J. Chem. Phys. 1995;103:150. [Google Scholar]
- 7.Agmon N. Isr. J. Chem. 1999;39:493. [Google Scholar]
- 8.Kreuer KD, Paddison SJ, Spohr E, Schuster M. Chem. Rev. (Washington, D.C.) P. L. Geissler. 2004;104:4637. doi: 10.1021/cr020715f. [DOI] [PubMed] [Google Scholar]
- 9.DeCoursey T. Physiol. Rev. 2003;83:475. doi: 10.1152/physrev.00028.2002. [DOI] [PubMed] [Google Scholar]
- 10.Mohammed OF, Pines D, Dreyer J, Pines E, Nibbering ETJ , Science. 2005;310:83. doi: 10.1126/science.1117756. [DOI] [PubMed] [Google Scholar]
- 11.Taraphder S, Hummer G. J. Am. Chem. Soc. 2003;125:3931. doi: 10.1021/ja016860c. [DOI] [PubMed] [Google Scholar]
- 12.Luecke H, Schobert B, Richter HT, Cartailler JP, Lanyi JK. Science. 1999;286:255. doi: 10.1126/science.286.5438.255. [DOI] [PubMed] [Google Scholar]
- 13.Arseniev AS, Barsukov IL, Bystrov VF, Lomize AL, Ovchinnikov YA. FEBS Lett. 1985;186:168. doi: 10.1016/0014-5793(85)80702-x. [DOI] [PubMed] [Google Scholar]
- 14.Ferguson-Miller S, Babcock GT. Chem. Rev. (Washington, D.C.) 1996;96:2889. doi: 10.1021/cr950051s. [DOI] [PubMed] [Google Scholar]
- 15.Ostermeier C, Iwata S, Michel H. Curr. Opin. Struct. Biol. 1996;6:460. doi: 10.1016/s0959-440x(96)80110-2. [DOI] [PubMed] [Google Scholar]
- 16.Wikstrom MK. Nature (London) 1977;266:271. doi: 10.1038/266271a0. [DOI] [PubMed] [Google Scholar]
- 17.Wikstrom M, Ribacka C, Molin M, Laakkonen L, Verkhovsky M, Puustinen A. Proc. Natl. Acad. Sci. U.S.A. 2005;102:10478. doi: 10.1073/pnas.0502873102. [DOI] [PMC free article] [PubMed] [Google Scholar]
- 18.Ermler U, Fritzsch G, Buchanan SK, Michel H. Structure (London) 1994;2:925. doi: 10.1016/s0969-2126(94)00094-8. [DOI] [PubMed] [Google Scholar]
- 19.Oprea TI, Hummer G, Garcia AE. Proc. Natl. Acad. Sci. U.S.A. 1997;94:2133. doi: 10.1073/pnas.94.6.2133. [DOI] [PMC free article] [PubMed] [Google Scholar]
- 20.Stoner-Ma D, Jaye AA, Matousek P, Towrie M, Meech SR, Tonge PJ. J. Am. Chem. Soc. 2005;127:2864. doi: 10.1021/ja042466d. [DOI] [PubMed] [Google Scholar]
- 21.Lee YS, Krauss M. J. Am. Chem. Soc. 2004;126:2225. doi: 10.1021/ja036115v. [DOI] [PubMed] [Google Scholar]
- 22.Ilan B, Takjkhorshid E, Schulten K, Voth GA. Proteins. 2004;55:223. doi: 10.1002/prot.20038. [DOI] [PubMed] [Google Scholar]
- 23.Tajkhorshid E, Nollert P, Jensen MO, Miercke LJW, O’Connell J, Stroud RM, Schulten K. Science. 2002;296:525. doi: 10.1126/science.1067778. [DOI] [PubMed] [Google Scholar]
- 24.de Groot BL, Grubnuller H. Science. 2001;294:2353. doi: 10.1126/science.1066115. [DOI] [PubMed] [Google Scholar]
- 25.Burykin A, Warshel A. Biophys. J. 2003;85:3696. doi: 10.1016/S0006-3495(03)74786-9. [DOI] [PMC free article] [PubMed] [Google Scholar]
- 26.Jensen MO, Rothlisberger U, Rovira C. Biophys. J. 2005;89:1744. doi: 10.1529/biophysj.104.058206. [DOI] [PMC free article] [PubMed] [Google Scholar]
- 27.Zhu F, Schulten K. Biophys. J. 2003;85:236. doi: 10.1016/S0006-3495(03)74469-5. [DOI] [PMC free article] [PubMed] [Google Scholar]
- 28.Vuilleumier R, Borgis D. J. Chem. Phys. 1999;111:4251. [Google Scholar]
- 29.Iijima S. Nature (London) 1991;354:56. [Google Scholar]
- 30.Hummer G, Rasaiah JC, Noworyta JP. Nature (London) 2001;414:188. doi: 10.1038/35102535. [DOI] [PubMed] [Google Scholar]
- 31.Dellago C, Naor MM, Hummer G. Phys. Rev. Lett. 2003;90:105902. doi: 10.1103/PhysRevLett.90.105902. [DOI] [PubMed] [Google Scholar]
- 32.Cheng HP. J. Chem. Phys. 1996;105:6844. [Google Scholar]
- 33.Sadeghi RR, Cheng HP. J. Chem. Phys. 1999;111:2086. [Google Scholar]
- 34.Nemukhin AV, Grigorenko BL, Topol IA, Burt SK. J. Phys. Chem. B. 2003;107:2958. doi: 10.1002/jcc.10309. [DOI] [PubMed] [Google Scholar]
- 35.Ramos M, Alkorta I, Elguero J, Golubev NS, Denisov GS, Benedict H, Limbach H-H. J. Phys. Chem. A. 1997;101:9791. [Google Scholar]
- 36.Hirschfelder JO, Curtiss CF, Bird RB. Molecular Theory of Gases and Liquids. Wiley; New York: 1967. [Google Scholar]
- 37.Warshel A, Levitt M. J. Mol. Biol. 1976;103:227. doi: 10.1016/0022-2836(76)90311-9. [DOI] [PubMed] [Google Scholar]
- 38.Field MJ, Bash PA, Karplus M. J. Comput. Chem. 1990;11:700. [Google Scholar]
- 39.Eurenius KP, Chatfield DC, Brooks BR, Hodoscek M. Int. J. Quantum Chem. 1996;60:1189. [Google Scholar]
- 40.Hohenberg P, Kohn W. Phys. Rev. 1964;136:B864. [Google Scholar]
- 41.Kohn W, Sham LJ. Phys. Rev. 1965;140:A1133. [Google Scholar]
- 42.Parr RG, Yang W. Density-Functional Theory of Atoms and Molecules. Oxford University Press; New York: 1989. [Google Scholar]
- 43.Becke AD. J. Chem. Phys. 1993;98:5648. [Google Scholar]
- 44.Lee C, Yang W, Parr RG. Phys. Rev. B. 1988;37:785. doi: 10.1103/physrevb.37.785. [DOI] [PubMed] [Google Scholar]
- 45.Hehre WJ, Radom L, von Schleyer P, Pople JA. Ab Initio Molecular Orbital Theory. Wiley; New York: 1986. [Google Scholar]
- 46.Cui Q, Elstner M, Kaxiras E, Frauenheim T, Karplus M. J. Phys. Chem. B. 2001;105:569. [Google Scholar]
- 47.Schmidt MW, Baldridge KK, Boatz JA, et al. J. Comput. Chem. 1993;14:1347. [Google Scholar]
- 48.Brooks BR, Bruccoleri RE, Olafson BD, States DJ, Swami-nathan S, Karplus M. J. Comput. Chem. 1983;4:187. [Google Scholar]
- 49.Pomes R, Roux B. Biophys. J. 1998;75:33. doi: 10.1016/S0006-3495(98)77492-2. [DOI] [PMC free article] [PubMed] [Google Scholar]
- 50.Warshel A, Weiss RM. J. Am. Chem. Soc. 1980;102:6218. [Google Scholar]
- 51.Schmitt UW, Voth GA. J. Phys. Chem. B. 1998;102:5547. [Google Scholar]
- 52.Brewer M, Schmitt UW, Voth GA. Biophys. J. 2001;80:1691. doi: 10.1016/S0006-3495(01)76140-1. [DOI] [PMC free article] [PubMed] [Google Scholar]
- 53.Mann DJ, Halls MD. Phys. Rev. Lett. 2003;90:195503. doi: 10.1103/PhysRevLett.90.195503. [DOI] [PubMed] [Google Scholar]
- 54.Burykin A, Warshel A. J. Comput. Theor. Nanosci. 2006;2:1. [Google Scholar]
- 55.Beckstein O, Tai K, Sansom MSP. J. Am. Chem. Soc. 2004;126:14694. doi: 10.1021/ja045271e. [DOI] [PubMed] [Google Scholar]
- 56.Peter C, Hummer G. Biophys. J. 2005;89:2222. doi: 10.1529/biophysj.105.065946. [DOI] [PMC free article] [PubMed] [Google Scholar]