Abstract
The objective of this study was to investigate if oligoclonality of the Ig repertoire post-haematopoietic stem cell transplantation (HSCT) is restricted to memory B lymphocytes or if it is a general property among B lymphocytes. As a measure of B lymphocyte repertoire diversity, we have analysed size distribution of polymerase chain reaction (PCR) amplified Ig H complementarity determining region 3 (CDR3) in naive and memory B lymphocytes isolated from patients before HSCT and at 3, 6 and 12 months after HSCT as well as from healthy controls. We demonstrate a limited variation of the IgH CDR3 repertoire in the memory B lymphocyte population compared to the naive B cell population. This difference was significant at 3 and 6 months post-HSCT. Compared to healthy controls there is a significant restriction of the memory B lymphocyte repertoire at 3 months after HSCT, but not of the naive B lymphocyte repertoire. Twelve months after HSCT, the IgH CDR3 repertoire in both memory and naive B lymphocytes are as diverse as in healthy controls. Thus, our findings suggest a role for memory B cells in the restriction of the oligoclonal B cell repertoire observed early after HSCT, which may be of importance when considering reimmunization of transplanted patients.
Keywords: B lymphocyte repertoire, haematopoietic stem cell transplantation, IgH gene expression, immune reconstitution
INTRODUCTION
Reconstitution of the immune system after haematopoietic stem cell transplantation (HSCT) is dependent on the conditioning regimen, the effect and treatment of graft-versus-host disease (GVHD) and time after HSCT [1]. Components of the non-specific immune system, such as granulocytes, monocytes/macrophages and NK cells, recover within 2–6 months after HSCT whereas functional recovery of B and T lymphocytes can take from 1 to several years [2]. Patients who develop chronic GVHD might never regain normal immune function [3]. Remaining dysfunction of the immune system after HSCT results in increased susceptibility to infections. In a study of mononuclear cell subsets the importance of B lymphocytes in the stem cell recipient's susceptibility to infections was demonstrated. Agematsu et al. used surface markers to separate subpopulations of B lymphocytes and demonstrated that CD27+ B lymphocytes were absent in cord blood and increased with age [4]. It was also demonstrated that CD27+ B cells produce large amounts of Ig upon stimulation, whereas no Ig production was found in CD27– B cells under the same conditions. Thus, CD27 molecule expression on the surface of B lymphocytes is a marker of memory B cells [5–7]. Using the CD27 memory B cell surface marker in combination with the B lymphocyte surface marker CD19, naive (CD19+ CD27–) and memory (CD19+ CD27+) B lymphocytes can be separated.
The most variable part of the IgH is the third complementarity determining region (CDR3), which is formed by the junctions between the VH–D–JH gene segments. We have previously demonstrated an oligoclonal pattern in the Ig gene expression after HSCT using nucleotide sequence analysis [8,9]. A more global, but less detailed, view of clonal diversity in the B lymphocyte repertoires post-HSCT can be achieved by analysis of the CDR3 region with CDR3 spectratyping [10,11]. CDR3 spectratyping has been used frequently in the study of the T lymphocyte repertoire [12,13]. Using this technique, Gokmen et al. demonstrated oligoclonal repertoire among IgM+ and IgG+ B cells early after HSCT. Näsman and Lundkvist demonstrated clonal dominance by different CDR3 regions at different time-points after HSCT and this property was supposed to be shared by both naive as well as activated B lymphocytes [9]. No studies have been performed previously to investigate the Ig repertoire in subpopulations of peripheral B lymphocytes after HSCT.
To investigate further the mechanisms of B lymphocyte reconstitution after HSCT, we have analysed size distribution of the Ig H CDR3 region in naive and memory B lymphocytes isolated from peripheral blood of patients undergoing HSCT. With this approach we address the question if oligoclonality of the Ig repertoire is restricted to memory B lymphocytes or if it is a general property among all B lymphocytes.
MATERIALS AND METHODS
Patients and donors
Ten consecutive patients who were treated with HSCT at Huddinge University hospital between February 1998 and December 1998, and five healthy age-matched volunteers were included in the study (ethical permission 329/97 from the Ethical Committee at Huddinge University Hospital, Stockholm, Sweden). The patient characteristics are described in Table 1. Three patients received bone marrow (BM)/peripheral blood stem cells (PBSC) from human leucocyte antigen (HLA)-identical siblings, one patient was grafted with PBSC from his twin brother and six patients received stem cells from HLA-matched unrelated donors. The conditioning regimen was cyclophosphamide (60 mg/kg/day × 2) and 10 Gy of total body irradiation (TBI). In addition antithymocyte globulin (ATG) was given to 4/10 patients [14]. Three of the patients were treated with fractionated TBI (3·6 Gy × 4). Busulphan (4 mg/kg/day × 4) and cyclophosphamide (60 mg/kg/day × 2) were used as conditioning in two of the cases [15]. Eight patients were given methotrexate and cyclosporin A as GVHD prophylaxis [16]. In one of the patients methotrexate was replaced by prednisolone. The patient transplanted with PBSC from his twin brother did not receive any GVHD prophylaxis. Additional details about the transplantation procedure and supportive care have been published elsewhere [17,18]. GVHD was diagnosed on the basis of clinical symptoms and biopsy.
Table 1.
Patient characteristics
| Infections | |||||||||||
|---|---|---|---|---|---|---|---|---|---|---|---|
| Patient no. | Age/sex | Diagnosis | Donors | Source of stem cells | Conditioning | aGVHD/cGVHD | GVHD prophylaxis | G-CSF | relapse | viral | bacterial |
| 1 | 31/M | CML | MUD | PBSC | Cy/TBI/ATG | grade II/severe | MTX/Cs A | Yes | No | 1T | 1T |
| 2 | 29/M | Fanconi anaemia | HLA-id sibling | PBSC | Flud/Cy/ATG | 0/0 | MTX/Cs A | Yes | No | 0 | 0 |
| 3 | 34/M | CML | HLA-id sibling | PBSC | Bu/Cy | grade I/mild | MTX/Cs A | No | No | 1T, 1 A | 4T |
| 4 | 38/M | AML | MUD | BM | Bu/Cy | grade I/0 | MTX/Cs A | Yes | No | 0 | 0 |
| 5 | 53/M | Non-Hodgkin | HLA-id twin | PBSC | Cy/fTBI/Eto | 0/0 | 0 | Yes | No | 0 | 0 |
| 6 | 45/M | FCL | HLA-id sibling | BM | Cy/fTBI | grade I/mild | MTX/Cs A | No | No | 2T | 1T |
| 7 | 54/F | AML | MUD | BM | Ifo/fTBI | grade I/0 | MTX/Cs A | Yes | No | 0 | 0 |
| 8 | 20/F | ALL | MUD | BM | Cy/TBI/ATG | 0/moderate | Pred/Cs A | No | No | 1T | 1T |
| 9 | 51/F | CML | MUD | BM | Cy/TBI/ATG | grade I/mild | MTX/Cs A | Yes | No | 0 | 0 |
| 10 | 39/F | CML | MUD | BM | Cy/TBI/ATG | grade IV/* | MTX/Cs A | Yes | * | 0 | 3T |
M = male, F = female, CML = chronic myeloid leukaemia, AML = acute myeloid leukaemia, non-Hodgkin = non-Hodgkin lymphoma, FCL = follicle cell lymphoma, ALL = acute lymphoblastic leukaemia, PBSC = peripheral blood stem cell, BM = bone marrow, MUD = matched unrelated donor, Cy = cyclophoshamide, TBI = total body irradiation, fTBI = fractionated TBI, ATG = antithymocyte globulin, Bu = busulfan, Ifo = Ifosfamide, Eto = etoposid, Flu = fludarabine monophosphate, MTX = methotrexate, Pred = prednisolone, Cs A = cyclosporin A.
The patient died before cGVHD or relapse developed; T = symptomatic infection resulting in treatment of the infection; A = CMV detection with PCR, asymptomatic, untreated infection.
Isolation of mononuclear cells from peripheral blood
Peripheral blood samples were collected from the patients before HSCT and at 3, 6 and 12 months after HSCT. Peripheral blood mononuclear cells (PBMC) were separated from peripheral blood by gradient centrifugation on Lymphoprep™ (Nycomed-Pharma AS, Oslo, Norway). The cells were frozen in fetal calf serum (FCS) containing 10% DMSO in liquid nitrogen until sorting and DNA extraction was performed.
Enrichment of memory B and naive B lymphocytes
PBMCs were separated into memory B lymphocytes and naive lymphocytes using the CELLection Dynabeads™ system according to the protocol supplied by the manufacturer. In brief, PBMCs were thawed suspended in RPMI-1640 medium containing 10% FCS and incubated with Biotin Binder Dynabeads (Dynal, Oslo, Norway) coated with biotinylated mouse antihuman CD27 monoclonal antibody (MoAb) (PharMingen, San Diego, CA, USA) for 20 min at + 4°C during rotation. The cells were separated on a magnetic particle concentrator (MPC) according to the manufacturer's recommendations and CD27+ and CD27– fractions were collected. The cell fractions were washed twice and incubated with Pan Mouse IgG Dynabeads (Dynal, Oslo, Norway) coated with fluorescein (FITC)-labelled mouse antihuman CD19 MoAb (Becton Dickinson, San Jose, CA, USA) for 20 min at + 4°C during rotation. The cells were separated on a MPC and cell fractions containing CD19+ CD27+ (memory) B lymphocytes and CD19+ CD27– (naive) B lymphocytes were collected.
Flow cytometry
Flow cytometry was used to verify the purity of the bead-sorting procedure. PBMC before and after enrichment with immunomagnetic beads, were stained with fluorescein-conjugated monoclonal antibodies. The cell fractions were incubated with biotin-conjugated anti-CD27 MoAb (PharMingen, San Diego, CA, USA) for 20 min at room temperature (RT). The cells were washed twice and incubated with FITC-conjugated anti-CD20 MoAb (Becton Dickinson, San Jose, CS, USA) and RPE-conjugated streptavidin for 20 min at RT. A second washing step was performed and the cells were analysed on a Becton Dickinson FACSort (Becton Dickinson, San Jose, CA, USA). Data were analysed using the software Cellquest™ (Becton Dickinson).
Preparation of genomic DNA
DNA was prepared with the QIAamp DNA Blood Mini Kit (Qiagen, Hilden, Germany), according to the protocol supplied by the manufacturer. The concentration and purity of the preparation was determined by measuring the absorbance at 260 and 280 nm (UV4 Unicam UV/Vis Spectrometer, ATIUnicam, Cambridge, UK).
Polymerase chain reaction (PCR) and PCR primers
PCR was performed in a total volume of 10 µl 1×PCR buffer [1·5 mm MgCl2, 50 mm KCl, 10 mm Tris-HCl pH 8·3, 0·2 mm of dNTPs, 0·5 µm of the forward primer and 0·5 µm of the reverse primer, 5% glycerol, 0·03 U/µl Taq polymerase (AmpliTaq, Perkin Elmer, Roche Molecular System, Branchburg, USA)] containing 30–60 ng DNA. The PCR was performed using a thermal cycler (PTC-200 Peltier Thermal Cycler, MJ Research Inc., CA, USA) and the PCR programme was as follows: preheating at 94°C for 3 min followed by 37 cycles of denaturation at 94°C for 30 s, annealing at 58°C for 1 minute, extension at 72°C for 1 min and a final elongation step at 72°C for 4 min. The VH-FR3 primer was labelled at the 5′ position with a fluorescent dye, 6-fluorescein phosphor amidite (6-FAM). The following primers, synthesized by CyberGene AB (Huddinge, Sweden), were used: VH-FR3 (VH-consensus), 5′-ACACGGCCGTGTATTACTGT-3′, Jpst (JH-consensus), 5′-AACTGCAGAGGAGACGGTGACC-3′.
CDR3 fragment size analysis
The size distributions of the PCR products were analysed with ABI Prism GeneScan™ by Cybergene AB (Huddinge, Sweden). In the ABI Prism GeneScan™ analysis the PCR products were separated by size on a 4·5% polyacrylamid gel allowing a 1 base pair (bp) resolution. The GeneScan™ software was used to quantify the fluorescein labelled PCR products by the fluorescence intensity.
Chimerism analysis
Chimerism analysis was performed as described previously [19,20]. Briefly, pretransplant recipient and donor DNA samples were amplified with six different minisatellite pairs to obtain at least one informative locus. PCR analysis was performed with the chosen primer pair on sequential patient samples. PCR samples were separated on 12,5% non-denaturating polyacrylamid gels in a ready-to-use system from Pharmacia Biotech (Pharmacia Biotech, Uppsala, Sweden). The gels were analysed after automated silver staining (Pharmacia Biotech).
Statistical analysis
Differences between the groups were compared using the Wilcoxon rank-sum test. Significance was achieved when P < 0·05. Calculations were performed using the software jmp(SAS Institute Inc., Cary, NC, USA).
RESULTS
Patient outcome
The median follow-up time was 9 months. The main clinical data of the patients are listed in Table 1. Seven patients developed acute GVHD, five with grade I, one with grade II and one with grade IV. The patient with grade IV aGVHD died during the follow-up period. None of the patients relapsed during the time of the study. The most common viral infections were cytomegalovirus (CMV) infections. Patients 3 and 6 suffered from symptomatic reactivated CMV infection at 6 weeks after HSCT and were treated with ganciclovir. Bacterial infections were caused predominantly by Staphylococcus epidermidis. In patients number 3 and 9 low variability in the CDR3 of memory B lymphocytes was detected at 12 months post-HSCT. The clinical outcome of these patients did not differ from the others, except that patient 3 had more infections than the other patients.
Enrichment of naive and memory B lymphocytes
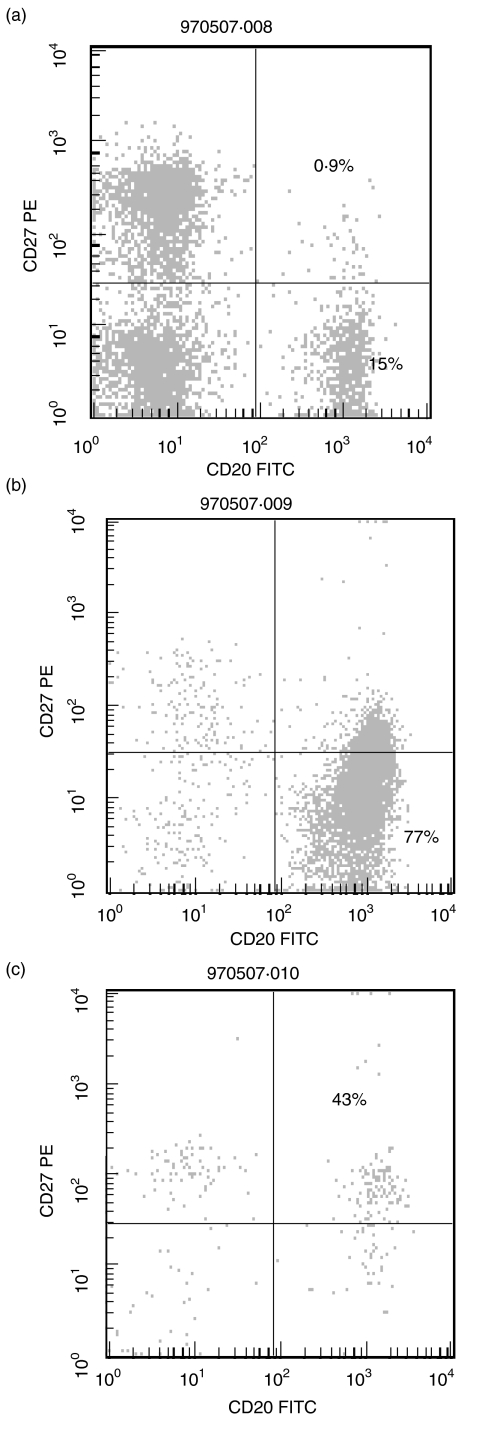
To evaluate the enrichment procedure for naive and memory B lymphocytes, flow cytometric analysis of the separated cell fractions was performed. Figure 1 demonstrates the quality of the enrichment for CD19+ CD27+ (memory) B cells and CD19+ CD27– (naive) B cells in a sample from a donor. Because CD19 was used for separation of memory and naive B cell subpopulations, CD20 was used as B cell marker in the flow cytometric analysis. In Fig. 1a, the cell distribution before the sorting is displayed. After the sorting procedure is completed there is a 40-fold enrichment of the memory B cells (Fig. 1c) and a fivefold enrichment of the naive B cells (Fig. 1b). Some T lymphocytes and natural killer cells (CD27+ CD19–) were present in the sorted populations but because they do not express complete IgH rearrangements, the PCR reaction is not affected. The cell counts for CD19, CD4 and CD8 positive cells are given in Table 2.
Fig. 1.
Enrichment of naive and memory B lymphocytes. B cell subsets separated by flow cytometry, according to CD19/CD20 and CD27 expression as described in Methods. (a) PBMC from a donor before enrichment with immunomagnetic beads; (b) CD19+ CD27– (naive) B lymphocytes; and (c) CD19+ CD27+ (memory) B lymphocytes after enrichment with immunomagnetic beads.
Table 2.
Cell counts in peripheral blood from patients undergoing HSCT
| Number of cells | ||
|---|---|---|
| Time after HSCT | Range (106/l) | Mean (106/l) |
| 3 months | ||
| CD19 positive cells | 0–140 | 30 |
| CD4 positive cells | 0–410 | 90 |
| CD8 positive cells | 0–1300 | 400 |
| 6 months | ||
| CD19 positive cells | 0–50 | 30 |
| CD4 positive cells | 0–360 | 50 |
| CD8 positive cells | 0–1290 | 165 |
| 12 months | ||
| CD19 positive cells | 0–180 | 30 |
| CD4 positive cells | 0–300 | 60 |
| CD8 positive cells | 0–1440 | 210 |
Reconstitution of the CDR3 repertoire in naive and memory B lymphocytes
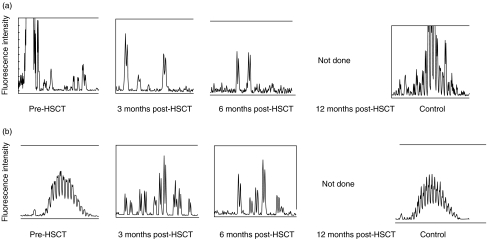
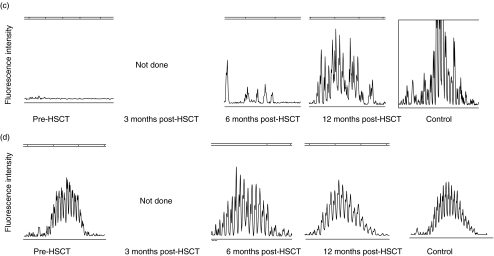
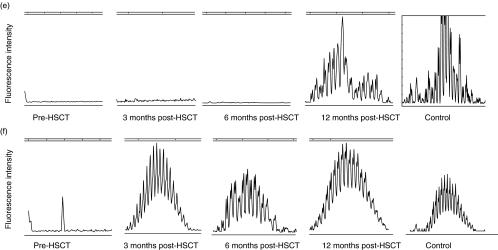
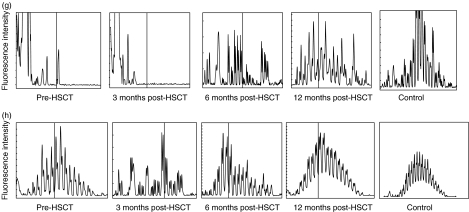
The pattern of CDR3 size distribution in memory and naive B cell repertoires was analysed. CDR3s were amplified with PCR and the products were separated by size on a polyacrylamid gel as described in Methods. The high resolution of the gel allows separation of the PCR product by 1 bp. The fluorescence intensity of each band was quantified with the GeneScan™ software and translated into a histogram displaying the length and intensity of each CDR3 fragment. Figure 2 demonstrates the distribution of CDR3s in memory (A, C, E, G) and naive (B, D, F, H) B cells in patients 1, 6, 7 and 8 before HSCT and at 3, 6 and 12 months post-HSCT, compared to four healthy controls. Each peak represents CDR3 fragments of the same length, also called CDR3 spectratypes. Fragments of different sequences may be of the same size.
Fig. 2.
CDR3 spectratype repertoire in four representative patients compared to a normal control. Size distribution of CDR3 fragments, also called CDR3 spectratypes, in memory (upper panels) and naive (lower panels) B lymphocytes from patient 1 (A + B), patient 6 (C + D), patient 7 (E + F) and patient 8 (G + H) before HSCT and at 3, 6 and 12 months post-HSCT. The vertical line in (g) and (h) indicates 100 bp. The peaks between 75 bp and 140 bp were counted from the datasheet generated by the computerized GeneScan analysis.
In samples collected from the recipients before HSCT, the variation in the CDR3 distribution spans between no detectable peaks to a complete repertoire. This variation depends on the given conditioning regimen, the sampling time-point (before or after conditioning) and the underlying disease. We found no correlation between low peak numbers in the samples collected before HSCT and the reconstitution of the CDR3 repertoire after HSCT. As all patients in this study had B lymphocytes of full donor origin at 3 months after HSCT the results from samples collected from the recipients before HSCT will not be discussed further.
In the healthy controls, there is a pattern of normal CDR3 distribution in the naive B lymphocyte population that is absent in the memory B lymphocytes. At 3 months post-HSCT, the B lymphocyte CDR3 repertoire is strongly restricted. At 6 months post-HSCT diversity increases and at 12 months post-HSCT the pattern of distribution is as varied as in the healthy control. The naive B cell population displays a varied pattern of distribution at all time-points and regains the pattern of normal distribution at 12 months.
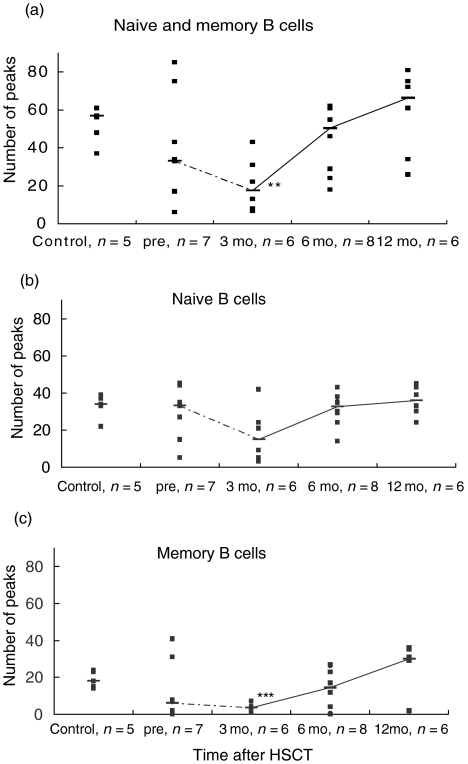
To investigate if there were differences in the CDR3 repertoire between the memory and the naive B lymphocyte population we counted the number of peaks in the histograms obtained from the GeneScan™ analysis. This count was used as a measure of the variation in the CDR3. Each peak in the spectratype profile represents CDR3 fragments of one size and the intensity of the peak corresponds to the amount of fragments.
Figure 3 demonstrates the peak numbers for all controls and patients at all time-points after HSCT in memory and naive B lymphocytes together (a), in naive B cells (b) and in memory B cells (c). In Fig. 3a there is a significant (P < 0·01) decrease in the number of CDR3 spectratypes at 3 months after HSCT compared to the control group. This difference between the controls and the samples at 3 months post-HSCT cannot be detected in the naive B lymphocyte population (Fig. 3b), but it is significant (P < 0·001) in the memory B cell population (Fig. 3c).
Fig. 3.
CDR3 spectratype repertoire in memory and naive B lymphocytes in patients and controls. The number of peaks in the CDR3 spectratype profile for total (a), naive (b) and memory (c) B lymphocytes for all samples are plotted (▪). The median for each group is represented by a horizontal bar and the medians are connected with a line. The number of individuals in each group is indicated under the plot. **P < 0·01, ***P < 0·001 versus healthy controls.
When comparing the naive B cell population (Fig. 3b) with the memory B cell population (Fig. 3c) there is a significant difference in the number of CDR3 spectratypes at 3 months (P < 0·05) and 6 months (P < 0·01) post-HSCT. This indicates a restricted repertoire in the memory B cell population compared to the naive B cells at these time-points. In the pre-HSCT group and at 12 months post-HSCT there is no significant difference between the B cell populations.
CDR3 fragment length analysis
Length of the CDR3 can be used as a marker of B lymphocyte development, e.g. one of the characteristics of a fetal repertoire is the small size of IgH CDR3 [21,22]. The longest spectratype of the CDR3 in our study is 22 triplet codons. Comparing the length of the CDR3 between the memory and naive B lymphocytes, the CDR3s of the naive B cells were significantly longer than the memory B cells in the control group (25 bp versus 32 bp, P < 0·001) and at 12 months post-HSCT (24 bp versus 34 bp, P < 0·01). In the memory B cell population there was no significant difference in the CDR3 size distribution when different time-points were compared. In the naive B cell population, CDR3 was significantly shorter at 3 months compared to CDR3 length at 12 months post-HSCT (26 bp versus 34 bp, P < 0·05).
Determination of chimerism
Chimerism analysis was performed in seven of the 10 patients in samples taken at the same time-points as for the CDR3 spectratyping analysis. All analysed samples were of full donor origin in the CD19 positive cell fraction (data not shown).
DISCUSSION
In this study, the CDR3 spectratype repertoires of naive and memory B lymphocytes in peripheral blood have been analysed. At 3 and 6 months after HSCT there is a statistically significant restriction of the IgH CDR3 repertoire in the memory B lymphocyte subpopulation compared to the naive B lymphocyte population. Three months after HSCT, there is a restriction of the total B lymphocyte repertoire compared to the healthy controls. This restriction is statistically significant in the memory B lymphocytes but it cannot be detected in the naive B lymphocyte population. Thus, we suggest a role of the memory B lymphocytes in the restriction of the B lymphocyte repertoire early after HSCT.
It has been demonstrated previously that the reconstitution of the B lymphocyte repertoire after HSCT follows an oligoclonal pattern [8,9,11]. Oligoclonality of the antibody repertoire can remain for years after HSCT [23,24]. Analysing the RNA expression of CDR3 in B lymphocytes using CDR3 spectratyping, Gokmen et al. demonstrated that the IgG repertoire remains restricted for 9 months. The IgM repertoire, on the other hand, regained an adult repertoire diversity at 3–4 months [11]. Näsman-Björk et al. demonstrated a restricted serum IgM reactivity in 60% of HSCT patients during and after the first year post-HSCT and revealed a polyclonal serum IgG repertoire in the majority of the patients during the same period of time [25]. Taken together, these different results indicate a functional defect among serum antibodies that cannot be detected when measuring the total number of B cells, circulating antibody levels or genetic analysis of the B lymphocytes.
Even though the recovery of B lymphocytes numbers often is completed at 1 year post-HSCT, the fact remains that some patients suffer from infections with encapsulated bacteria [26]. Low serum levels of IgG2 and IgG4 in stem cell recipients have been associated with an increased number of late infections and failure to respond to polysaccharide antigens [27,28]. The inability of T lymphocytes to support the antigen driven B lymphocyte response has also been questioned. Suzuki et al. demonstrated a lack of somatic mutations in Ig gene rearrangements consistent with a defect in the T lymphocyte dependent antigen-driven B lymphocyte response detectable from 3 to 12 months after HSCT [26]. Recently, Glas et al. co-cultured B lymphocytes from patients 1 year post-HSCT with T lymphocytes from healthy subjects and found that the inability of naive B lymphocytes to accumulate somatic mutations was independent of T lymphocyte function. They also demonstrated that this defect was not correlated with the inability to differentiate in culture as isotype switch did occur [29]. At 3 months after HSCT there are not enough CD4+ T lymphocytes to support the antigen driven B lymphocyte response but a T cell independent pathway cannot be ruled out because there is a remaining inability of the B lymphocytes to respond to polysaccharide antigens at 1 year after HSCT.
We found a difference in the variation of the CDR3 repertoire between naive and memory B cells in a normal population of healthy control subjects. This difference can be expected, as the repertoire of naive cells is the source of endless variation in B lymphocytes whereas the memory B lymphocyte population has been selected by antigens. Because this difference between naive and memory B lymphocytes is seen in a normal population, it is not surprising that we found it in patients after HSCT as well. Storek showed a delayed recovery of the number of membrane IgD-negative B lymphocytes after HSCT and suggested a very slow recovery of memory B lymphocytes [30]. This may suggest a role for memory B lymphocytes in the long-time recovery of B lymphocytes but further studies must be conducted. The results of this study suggest that the memory B lymphocyte population contributes to the restriction of the total Ig repertoire early after HSCT but the underlying mechanism is unclear. A possible explanation can be the lack of CD4+ cells early after HSCT resulting in failure to support activation of naive B lymphocytes. Another explanation involves the data from Nasman et al. that demonstrated clonal dominance by different CDR3 regions at different time-points after HSCT suggesting a clonal expansion of B lymphocytes similar to that of T lymphocytes after HSCT. This kind of expansion could result in oligoclonality of the B lymphocyte repertoire. The main difference between B and T lymphocytes is that the B lymphocytes do not expand from transferred mature cells but from cells developed from the donated stem cells [8,9].
Considering our finding that the genetic variation of the memory B lymphocyte repertoire often is recovered at 12 months post-HSCT, active reimmunization of transplanted patients is possible at this time-point. Today, 95% of the European centres performing HSCT re-immunize their patients [31,32] and recommendations from the European Group for Blood and Marrow Transplantation (EBMT) include a reimmunization programme that starts at 6 months post-HSCT. According to our data, the recovery of the memory B lymphocytes at this time-point varies among patients. This variation may explain why some re-immunized patients do not gain long-term immunity.
In addition, the fragment size of the CDR3 spectratypes was analysed. We demonstrate significantly shorter CDR3 fragments in the CD19+ CD27+ (memory) B lymphocyte population compared to the CD19+ CD27– (naive) B lymphocytes in the control group and at 12 months post-HSCT. Even though differences between the populations could be spotted, the size distribution of the CDR3 fragments was within the normal range (7–24 triplet nucleotide codons) [10] for mature B cells in healthy adults, in all samples. Taken together, there was no sign of a fetal CDR3 distribution in memory or naive B lymphocytes post-HSCT. This confirms the results of others, as they conclude that the reconstitution of the B lymphocyte repertoire after HSCT does not recapitulate human fetal development [1,10,11].
In conclusion, our findings suggest a memory B lymphocyte specific restriction, important to the forming of an oligoclonal B cell repertoire early post-HSCT. Total genetic recovery of CDR3 polyclonality, however, does not exclude remaining functional defects among memory B lymphocytes due to cGVHD or immunosuppressive treatment.
Acknowledgments
We are grateful to Professor O. Ringdén, S. Öman and C. Tammik for providing us with the sample material and to M. Uzunel for providing us with the IgH primer sequence. This work was supported by grants from the Swedish Medical Research Council (K99–06X-11599), the Tobias Foundation, the Åke Wiberg Foundation, the Selma and Fritz Ringtröm Foundation and Karolinska Institutet.
REFERENCES
- 1.Raaphorst FM. Reconstitution of the B cell repertoire after bone marrow transplantation does not recapitulate human fetal development. Bone Marrow Transplant. 1999;24:1267–72. doi: 10.1038/sj.bmt.1702074. [DOI] [PubMed] [Google Scholar]
- 2.Storek J, Saxon A. Reconstitution of B cell immunity following bone marrow transplantation. Bone Marrow Transplant. 1992;9:395–408. [PubMed] [Google Scholar]
- 3.Atkinson K. Reconstruction of the haemopoietic and immune systems after marrow transplantation. Bone Marrow Transplant. 1990;5:209–26. [PubMed] [Google Scholar]
- 4.Storek J, Espino G, Dawson MA, et al. Low B-cell and monocyte counts on day 80 are associated with high infection rates between days 100 and 365 after allogeneic marrow transplantation. Blood. 2000;96:3290–3. [PubMed] [Google Scholar]
- 5.Agematsu K, Nagumo H, Yang FC, et al. B cell subpopulations separated by CD27 and crucial collaboration of CD27+ B cells and helper T cells in immunoglobulin production. Eur J Immunol. 1997;27:2073–9. doi: 10.1002/eji.1830270835. [DOI] [PubMed] [Google Scholar]
- 6.Agematsu K, Hokibara S, Nagumo H, et al. CD27: a memory B-cell marker. Immunol Today. 2000;21:204–6. doi: 10.1016/s0167-5699(00)01605-4. [DOI] [PubMed] [Google Scholar]
- 7.Klein U, Rajewsky K, Kuppers R. Human immunoglobulin (Ig) M+IgD+ peripheral blood B cells expressing the CD27 cell surface antigen carry somatically mutated variable region genes: CD27 as a general marker for somatically mutated (memory) B cells. J Exp Med. 1998;188:1679–89. doi: 10.1084/jem.188.9.1679. [DOI] [PMC free article] [PubMed] [Google Scholar]
- 8.Nasman I, Lundkvist I. Evidence for oligoclonal diversification of the VH6-containing immunoglobulin repertoire during reconstitution after bone marrow transplantation. Blood. 1996;87:2795–804. [PubMed] [Google Scholar]
- 9.Näsman-Björk I, Lundkvist I. Oligoclonal dominance of immunoglobulin VH3 rearrangements following allogeneic bone marrow transplantation. Bone Marrow Transplant. 1998;21:1223–30. doi: 10.1038/sj.bmt.1701261. [DOI] [PubMed] [Google Scholar]
- 10.Raaphorst FM, Raman CS, Tami J, et al. Human Ig heavy chain CDR3 regions in adult bone marrow pre-B cells display an adult phenotype of diversity: evidence for structural selection of DH amino acid sequences. Int Immunol. 1997;9:1503–15. doi: 10.1093/intimm/9.10.1503. [DOI] [PubMed] [Google Scholar]
- 11.Gokmen E, Raaphorst FM, Boldt DH, et al. Ig heavy chain third complementarity determining regions (H CDR3s) after stem cell transplantation do not resemble the developing human fetal H CDR3s in size distribution and Ig gene utilization. Blood. 1998;92:2802–14. [PubMed] [Google Scholar]
- 12.Gorski J, Yassai M, Zhu X, et al. Circulating T cell repertoire complexity in normal individuals and bone marrow recipients analyzed by CDR3 size spectratyping. Correlation with immune status. J Immunol. 1994;152:5109–19. [PubMed] [Google Scholar]
- 13.Wu CJ, Chillemi A, Alyea EP, et al. Reconstitution of T-cell receptor repertoire diversity following T-cell depleted allogeneic bone marrow transplantation is related to hematopoietic chimerism. Blood. 2000;95:352–9. [PubMed] [Google Scholar]
- 14.Remberger M, Svahn BM, Hentschke P, et al. Effect on cytokine release and graft-versus-host disease of different anti-T cell antibodies during conditioning for unrelated haematopoietic stem cell transplantation. Bone Marrow Transplant. 1999;24:823–30. doi: 10.1038/sj.bmt.1701991. [DOI] [PubMed] [Google Scholar]
- 15.Ringden O, Ruutu T, Remberger M, et al. A randomized trial comparing busulfan with total body irradiation as conditioning in allogeneic marrow transplant recipients with leukemia: a report from the Nordic Bone Marrow Transplantation Group. Blood. 1994;83:2723–30. [PubMed] [Google Scholar]
- 16.Storb R, Deeg HJ, Whitehead J, et al. Methotrexate and cyclosporine compared with cyclosporine alone for prophylaxis of acute graft versus host disease after marrow transplantation for leukemia. N Engl J Med. 1986;314:729–35. doi: 10.1056/NEJM198603203141201. [DOI] [PubMed] [Google Scholar]
- 17.Ringden O, Pihlstedt P, Markling L, et al. Prevention of graft-versus-host disease with T cell depletion or cyclosporin and methotrexate. A randomized trial in adult leukemic marrow recipients. Bone Marrow Transplant. 1991;7:221–6. [PubMed] [Google Scholar]
- 18.Ringden O, Remberger M, Persson U, et al. Similar incidence of graft-versus-host disease using HLA-A, -B and -DR identical unrelated bone marrow donors as with HLA-identical siblings. Bone Marrow Transplant. 1995;15:619–25. [PubMed] [Google Scholar]
- 19.Mattsson J, Uzunel M, Remberger M, et al. Minimal residual disease is common after allogeneic stem cell transplantation in patients with B cell chronic lymphocytic leukemia and may be controlled by graft-versus-host disease. Leukemia. 2000;14:247–54. doi: 10.1038/sj.leu.2401669. [DOI] [PubMed] [Google Scholar]
- 20.Zetterquist H, Mattsson J, Uzunel M, et al. Mixed chimerism in the B cell lineage is a rapid and sensitive indicator of minimal residual disease in bone marrow transplant recipients with pre-B cell acute lymphoblastic leukemia. Bone Marrow Transplant. 2000;25:843–51. doi: 10.1038/sj.bmt.1702337. [DOI] [PubMed] [Google Scholar]
- 21.Raaphorst FM, Timmers E, Kenter MJ, et al. Restricted utilization of germ-line VH3 genes and short diverse third complementarity-determining regions (CDR3) in human fetal B lymphocyte immunoglobulin heavy chain rearrangements. Eur J Immunol. 1992;22:247–51. doi: 10.1002/eji.1830220136. [DOI] [PubMed] [Google Scholar]
- 22.Sanz I. Multiple mechanisms participate in the generation of diversity of human H chain CDR3 regions. J Immunol. 1991;147:1720–9. [PubMed] [Google Scholar]
- 23.Gerritsen EJ, van Tol MJ, Lankester AC, et al. Immunoglobulin levels and monoclonal gammopathies in children after bone marrow transplantation. Blood. 1993;82:3493–502. [PubMed] [Google Scholar]
- 24.Fumoux F, Guigou V, Blaise D, et al. Reconstitution of human immunoglobulin VH repertoire after bone marrow transplantation mimics B-cell ontogeny. Blood. 1993;81:3153–7. [PubMed] [Google Scholar]
- 25.Bjork IN, Brissac C, Remberger M, et al. Long-term persistence of oligoclonal serum IgM repertoires in patients treated with allogeneic bone marrow transplantation (BMT) Clin Exp Immunol. 2000;119:240–9. doi: 10.1046/j.1365-2249.2000.01118.x. [DOI] [PMC free article] [PubMed] [Google Scholar]
- 26.Suzuki I, Milner EC, Glas AM, et al. Immunoglobulin heavy chain variable region gene usage in bone marrow transplant recipients: lack of somatic mutation indicates a maturational arrest [see comments] Blood. 1996;87:1873–80. [PubMed] [Google Scholar]
- 27.Ambrosino DM. Impaired polysaccharide responses in immunodeficient patients: relevance to bone marrow transplant patients. Bone Marrow Transplant. 1991;7:48–51. [PubMed] [Google Scholar]
- 28.Sheridan JF, Tutschka PJ, Sedmak DD, et al. Immunoglobulin G subclass deficiency and pneumococcal infection after allogeneic bone marrow transplantation. Blood. 1990;75:1583–6. [PubMed] [Google Scholar]
- 29.Glas AM, van Montfort EH, Storek J, et al. B-cell-autonomous somatic mutation deficit following bone marrow transplant. Blood. 2000;96:1064–9. [PubMed] [Google Scholar]
- 30.Storek J, Witherspoon RP, Storb R. Reconstitution of membrane IgD-(mIgD-) B cells after marrow transplantation lags behind the reconstitution of mIgD+ B cells [letter; comment] Blood. 1997;89:350–1. [PubMed] [Google Scholar]
- 31.Singhal S, Mehta J. Reimmunization after blood or marrow stem cell transplantation [see comments] Bone Marrow Transplant. 1999;23:637–46. doi: 10.1038/sj.bmt.1701640. [DOI] [PubMed] [Google Scholar]
- 32.Ljungman P. Immunization of transplant recipients [editorial; comment] Bone Marrow Transplant. 1999. pp. 635–6. 23: [DOI] [PubMed]


