Abstract
We employ fully quantum-mechanical molecular dynamics simulations to evaluate the force between two methanes dissolved in water, as a model for hydrophobic association. A stable configuration is found near the methane–methane contact separation, while a shallow second potential minimum occurs for the solvent-separated configuration. The strength and shape of the potential of mean force are in conflict with earlier classical force-field simulations but agree well with a simple hydrophobic burial model which is based on solubility experiments. Examination of solvent dynamics reveals stable water cages at several specific methane–methane separations.
Keywords: hydrophobicity, molecular dynamics
Hydrophobicity is the molecular driving force behind numerous important biological processes, including protein folding and the formation of biological membranes (1–3). A quantitative understanding of hydrophobic interactions is crucial for modeling protein structures, protein functions, or manipulation of hydrophobic nanoparticles in aqueous solutions (4).
Experimentally, the strength of the hydrophobic effect (hydration potential) can be measured by the solubility of hydrocarbons (5, 6). However, the detailed shape of the potential of mean force (PMF) between two hydrocarbon molecules has only been probed indirectly (7, 8). Considerable effort has been expended in studying hydrophobic interactions and hydration by using classical Lennard–Jones potentials and various water models (9–11). The model parameters were typically chosen for consistency with bulk thermodynamic quantities. However, the hydrophobic effect for dissolved molecules originates largely from the hydrogen-bond network in the first solvation shell (12), and the properties of interfacial water differ substantially from those of bulk water. Indeed, hydrogen bonding remains quite difficult to represent effectively with simple (atom–atom) molecular-mechanics force fields (13).
In first-principles molecular dynamics (FPMD) (14), interatomic forces are derived directly from quantum-mechanical calculations. FPMD has been successfully applied to ice (15), water clusters (16), bulk liquid water (17), and water in the solvation shell of a dissolved ion (18) or methane (19). Here, we report determination of the PMF between a pair of methane molecules in water by FPMD. In classical simulations, the general features of the PMF are a stable free-energy minimum at contact separation, with a second but pronounced free-energy minimum at a distance where the two methanes are separated by a single layer of solvent (20). However, rather small changes in the classical methane–water interaction parameters can lead to reordering of the stability of these two minima (21). Our quantum-mechanical simulation reveals an effective hydrophobic surface tension. The result is a stable configuration of two methanes near contact separation with only a shallow potential minimum for the solvent-separated configuration. The depth of the stable potential minimum is roughly in accord with solubility measurement (5) but is much deeper than the potential minimum found in previous classical force-field MD simulations.
Our simulations also allowed us to examine the dynamics of water surrounding a hydrophobic solute. We found stable water cages at several specific methane–methane separations. These clathrate-like cages illustrate the effects of solute size on the local water structure.
Overview of Approaches
If one simulates Brownian motion of two methanes in water, each methane is in constant collision with water molecules, so naively the two methanes should drift away from each other. Instead, even though there is hardly any direct attractive force between two methane molecules at distances >4.5 Å, they are bound together by the surrounding water during the simulation time. To quantify the effect of solvent, we can define an effective potential W(r) between the two solute molecules. For a given separation r between the two molecules of interest, the (thermal ensemble) mean effective force acting on them is
where T and V are the temperature and volume of the system, and N is the number of particles. We shall call W(r) the potential of mean effective force (PMEF), and the corresponding Helmholtz free energy is denoted by F(r; T, V, N). A related and more widely used quantity to describe interactions in fluids is the PMF. The PMF is defined through the equilibrium probability of finding two molecules a certain distance apart in the solvent. Specifically, the PMF is given by
where g(r) is the radial distribution function of the solute molecules. The normalization is chosen such that g(r) tends to unity as r → ∞. The average effective force is related to the PMF by
We shall refer to the extra term, 2kBT/r, as the volume-entropy force. It is due to changes in the free volume of the spherical shell available to the solutes. A derivation of Eq. 2 is provided in the supporting information (SI).
Various methods have been used to compute the PMF between two methane molecules in water: free-energy perturbation (22), thermodynamic integration (23), and umbrella sampling (11, 24). In the present study, we used a constrained-molecular-dynamics method (25, 26) in which a holonomic constraint fixes the methane-pair separation. To this end, we introduced a Lagrange multiplier λ to fix the distance between the two methane molecules. The new Lagrangian  ′ and the constraint force f are
where  is the original Lagrangian of the N-particle system, and r1 and r2 are the positions of the two methanes. The time average of the constraint force, Eq. 3, is equivalent to the average effective force f̄(r). A simple integration of f̄(r) over constrained variable r gives the free-energy difference ΔW(r). Finally, the PMF (up to a constant) is (see the SI)
The distinction between w(r) and W(r) is critical when comparing with experiments and relating various approaches.
Results
Potential of Mean Force.
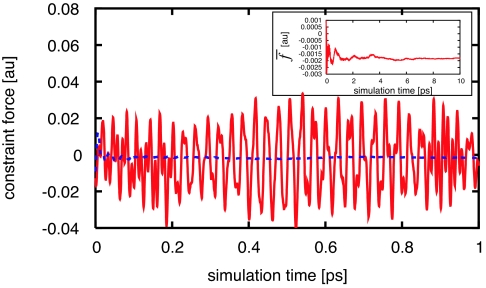
For each methane–methane separation, the constraint force is recorded at each MD time step, and the average is taken over the simulation time (6–10 ps). An example of data collection is shown in Fig. 1. Because of the methane C–H stretch modes, the constraint force between two methane molecules switches directions from repulsive to attractive roughly every 27 fs. As shown in Fig. 1, the time average of the constraint force converges in a few picoseconds. In previous, classical mechanics studies, using a Lennard–Jones potential and water models, the simulation time was 500 ps for each 0.5-Å window to converge the PMF within 0.1 kcal·mol−1 (11). Run-time considerations for our fully quantum-mechanical MD method induced us to use shorter simulation times, typically 6 ps for each methane–methane separation. We tested the convergence of the average constraint force for several separations between 3.8 and 5.8 Å using a longer MD simulation time (10 ps). We also checked the difference between using a smaller unit cell with 63 waters, versus a larger unit cell with 139 waters, for methane–methane separations of r = 4.4 and 6.0 Å. The resulting differences were typically of the order of 10−4 a.u. in the constraint force (see the SI for details of data collection and error analysis). Forces are expressed in atomic units: 1 a.u. = 8.2353 × 10⁻⁸ J/m.
Fig. 1.
The fluctuating constraint force (solid line) between two methane molecules separated by 5.6 Å in water. We start data collection after equilibrating the system for 3 ps. In this example, the cumulative average constraint force (dashed line) stabilizes in about 1 ps. In general, it requires several picoseconds to sample enough local water structures to obtain the average force, as shown in the Inset.
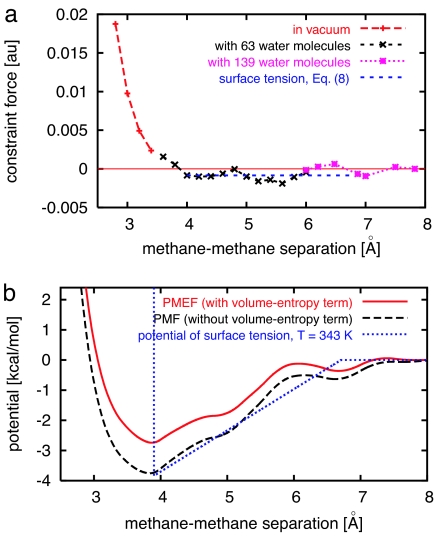
Fig. 2a shows the results of mean-effective-force calculations from r = 2.8 to 7.8 Å. When the methane–methane separation is less than the contact distance (≈3.9 Å), the overlap of methane electronic orbitals results in a strong repulsive force, which dominates effects from the surrounding water. To save computing time, we used the repulsive force between two methane molecules in vacuum when r is <3.6 Å. For methane–methane separations between 4.2 and 7.8 Å, we found a net attractive force, except near 6.5 Å. The PMEF, obtained by integrating the mean effective force, is shown in Fig. 2b. A small potential barrier around 6.2 Å separates the contact potential minimum from the second potential minimum near 6.7 Å. The PMF in Fig. 2b is obtained by subtracting the volume-entropy term, 2kBT ln r, from the PMEF.
Fig. 2.
Calculations of the PMF. (a) Mean effective force between two methanes in water as a function of their separation. When the methane–methane separation is <3.6 Å, the repulsive force between two methane molecules in vacuum is used. For methane–methane separations >6.0 Å, we use a larger unit cell containing 139 water molecules, instead of 63. A constant force derived from the surface-tension model (5) is also shown. (b) The PMEF (with volume-entropy term), the PMF (without volume-entropy term), and the potential of surface tension between two methane molecules as functions of methane–methane separation.
Hydration Structure.
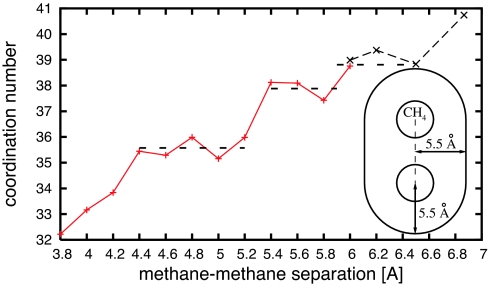
Our quantum-mechanical simulations allow us to study in detail the hydration structure around a methane pair. Near the pair, water forms a clathrate-like cage structure with a thickness of ≈5.5 Å (27). In Fig. 3, we plot the number of water molecules within the first solvation shell (coordination number) versus the methane–methane separation. Interestingly, the coordination number shows plateaus at several methane–methane separations.
Fig. 3.
Number of waters within the first solvation shell of a methane pair. (The Inset shows the volume included in the first solvation shell.) Dashed lines indicate a major plateau, between 4.4 and 5.4 Å, and two minor plateaus, between 5.4 and 5.8 Å, and between 6.0 and 6.5 Å. For methane–methane separations larger than 6.0 Å, a larger unit cell (with 139 waters) is used.
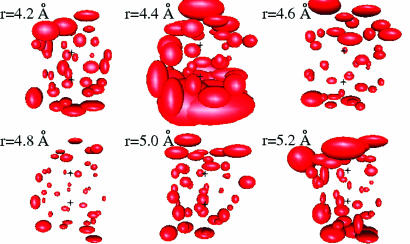
The presence of plateaus in Fig. 3 suggests the existence of stable well structured hydration shells at particular methane–methane separations. The dynamic behavior of water in the solvation shell can be visualized by plotting the rms displacement of each water molecule. For each MD step, we transform (translation plus rotation) the coordinate frame to the one where the two carbon atoms are stationary. Fig. 4 shows the rms displacement over simulation times of 6 ps for several methane–methane separations. The rms displacements are smallest at r = 4.8 Å, which is in the center of the first plateau in the coordination number plot.
Fig. 4.
Dynamics of water molecules near a methane pair, for 6-ps MD simulations after 3 ps of equilibration. The size of each ellipsoid is proportional to the rms displacement of a particular water molecule. (Upper) Methane–methane separations r = 4.2, 4.4, and 4.6 Å. (Lower) r = 4.8, 5.0, and 5.2 Å. The carbon atoms, denoted by two crosses, are stationary in the coordinate frame.
Discussion
Experimental Determination of the PMF.
An important motivation for computing PMFs is to obtain accurate solvation parameters for molecular modeling studies. Solvation free energies have been obtained from measurements of partition coefficients of hydrocarbons between aqueous and nonpolar phases (5, 28). The transfer of a hydrophobic solute into water is accompanied by an increase in free energy, part of which results from structural changes in the water around each solute molecule. At equilibrium, this transfer free energy is balanced by an increase in volume entropy. Experimentally, the transfer free energy for liquid n-alkanes to water is highly linear with respect to the solvent-accessible area (29). So to a good approximation, when the solvent-accessible area changes, the corresponding free-energy change ΔG can be described via a surface-tension parameter σ,
where ΔA is the change in the solvent-accessible area.** Before the transfer of the solute, the solvent-accessible area A is buried within the nonpolar solute liquid; after the transfer, the area A is immersed in liquid water. The surface-tension parameter, σ, is estimated from experiment to be 47 cal·mol−1·Å−2, valid for all n-alkanes in the series from methane up to decane (5, 30).††
The surface-tension model can be used to estimate the PMF between two methanes (31).‡‡ The solvent-accessible area of a methane molecule is defined as a sphere with radius ρ0 = (1.95 + 1.40) Å, the sum of methane and water radii. As illustrated schematically in Fig. 5, the solvent-accessible area of a methane pair is smaller when the two are in contact than when they are separated. In the contact configuration, the “buried” surface area is 20.8955% of the total available solvent-accessible area, 8πρ02. Thus, the depth of the PMF should be roughly ΔG = σ·0.2·8πρ02 ≈ 2.7 kcal·mol−1. Within the surface-tension model, the hydrophobic force between two methanes is
where r is the separation between the two methane molecules. So surface tension gives rise to a constant attractive force (0.00083 a.u., or 0.98 kcal·mol−1·Å−1) for r between 3.9 Å (contact separation) and 6.7 Å (separated by a water diameter).
Fig. 5.
Illustration of two methane molecules with their solvent-accessible area. ρ0 spans the solvent-accessible area of methane, and r denotes the distance between two methanes. (Left) Two methanes are well separated. (Right) Two methanes are in contact, and roughly 20% of the total available solvent-accessible area is buried inside.
To compare the estimated PMF from the surface tension model with our calculated PMF, we need to correct for the temperature difference between the experiment (room temperature) and the simulation (T = 343 K). The free-energy change in Eq. 4 is determined by the molar volume partition coefficient KM between liquid hydrocarbons and water,
where R is the gas constant and Vs (Vw) is the molar volume of solute (water) (32). The hydrophobic free energy increases rapidly above room temperature. In addition to the explicit temperature dependence in RT, the solubility (measured by KM) of hydrocarbons in water decreases with increasing temperature. Because of the low boiling temperatures of small n-alkanes (from methane to butane), temperature-dependent solubility data are only available for partitioning between gas phase and water (33, 34). From these gas/water partition coefficients, we obtained a linear relation between the transfer free energy and the solvent-accessible area which shows the transfer free energy per solvent-accessible area increases by ≈40% between room temperature and T = 343 K (details of this analysis can be found in the SI). Therefore, we estimate that the adjusted potential depth of the PMF at room temperature is around ≈2.8 kcal·mol−1 from our simulation, in good agreement with the estimate from the surface-tension model. Indeed, the shape of our calculated PMF is also in good agreement with the surface-tension model [using σ(T = 343 K) = 65 cal·mol−1·Å−2 in Fig. 2b].
Comparison of Quantum-Mechanical Versus Classical PMF.
The PMF we obtained from a fully quantum-mechanical simulation reasonably resembles the surface-tension potential but is distinctly different from earlier classical results. The PMF in Fig. 2b has a characteristic contact minimum at 3.9 Å with potential depth of ≈3.9 kcal·mol−1, which is much deeper than all previous studies [usually between 0.5 kcal·mol−1 (10) and 0.9 kcal·mol−1 (11)]. Even after adjusting to room temperature, we predict the potential depth of the PMF to be around −2.8 kcal·mol−1.§§
The question is whether and why classical force-field simulations underestimate the hydrophobic effect. Not unexpectedly, there are many differences between quantum and classical MD simulations in the methane/water system, such as the angular distribution of waters and hydrogen-bond-ring statistics (19). More studies comparing the two approaches remain to be done. However, we expect that the qualitative feature of the PMF in Fig. 2b, a small barrier separating the first and second potential minima, should be a rather robust feature of the density-functional theory calculations. This is in contrast to the occurrence of a pronounced solvent-separated minimum in classical simulations, which resembles the feature of hard-sphere liquids and may result from overly repulsive short-distance forces of Lennard–Jones potentials.
Stability of the Hydration Shell.
For a more stable aqueous solvation shell (like the one at r = 4.8 Å in Fig. 4), one would expect a fewer exchanges of water between the solvation shell and bulk water, less variation of the coordination number, and a higher ratio of pentagon to hexagon rings in the non-short-circuited hydrogen-bonded network distribution (35). Indeed, the mean-squared deviation of the coordination number recorded during a 6-ps MD run is 3.7 at r = 4.4 Å but decreases to 1.6 at r = 4.8 Å.
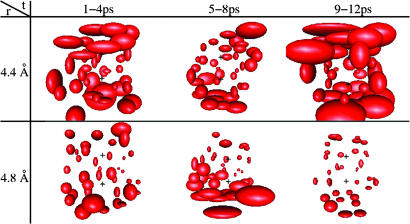
To make sure that the results in Fig. 4 were reproducible, we computed rms displacements at methane–methane separations of r = 4.4 and 4.8 Å starting from new initial configurations. Each frame in Fig. 6 represents the rms displacements over a 4-ps MD simulation. The rms displacements at r = 4.8 Å are consistently smaller than the rms displacements at r = 4.4 Å. For both r = 4.4 and 4.8 Å, the water in the cap regions is typically more fluid (larger rms displacements) than the water in the equatorial plane between the methanes.
Fig. 6.
Consecutive 12-ps MD simulation at r = 4.4 and 4.8 Å. The rms displacement is comparatively larger at r = 4.4 Å. The two carbon atoms are similarly located as in Fig. 4. The rms displacement is separately calculated in each 4-ps frame.
Given the small rms displacements of the waters in the solvation shell at r = 4.8 Å in both Figs. 4 and 6, one might conjecture that the waters assume a unique stable structure near the methanes. To test this idea, we determined the average water positions for two independent MD simulations at r = 4.8 Å. Even after applying all possible symmetry operations with respect to the methane–methane axis, we found that the two water structures could not be overlaid on each other. The hydrogen-bonded rings near the equator of the hydration shell coincided well between the two simulations, but there remained considerable mismatch between water locations in the cap regions.
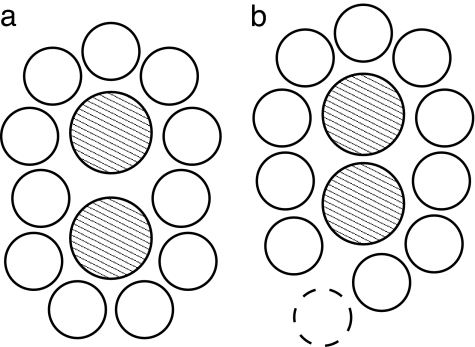
The stability of the solvation shell at r = 4.8 Å, even in the absence of a unique water structure, can be understood as follows. For a particular methane–methane separation, the surrounding water may be able to form a well packed cage, as shown schematically in Fig. 7a. For a larger or smaller methane separation, the surrounding water will not pack well, as indicated in Fig. 7b. Poor water packing will allow competing configurations with different numbers of waters in the solvation shell, leading to large rms displacements and rapid exchange of waters with the bulk. In contrast, for the well packed cage, rms displacements of water will be small and there will be relatively little exchange of waters with the bulk, even though the detailed packing in the solvation shell may not be unique.
Fig. 7.
Two-dimensional illustrative configuration of water surrounding a methane pair. In a, when the separation between the methane pair is favorable for the formation of a well packed cage, each water molecule can comfortably sit in its respective position. In b, a water (represented by a dashed circle) at the bottom cannot maintain a contact minimum with the methane dimer while keeping an optimal separation (≈2.8 Å) from its neighbors.
Conclusion
The PMF for two methane molecules in water was calculated by using a constrained FPMD method, where the effective force between two methanes is directly computed by a Lagrange multiplier. We highlighted the importance of a volume entropy term which leads to a distinction between the PMF (free energy due to the intermolecular interaction) and the PMEF (total free energy).
The PMF has a deep stable minimum near contact and a shallow solvent-separated minimum. The magnitude of the hydrophobic force agrees well with measurements of the solubility of hydrocarbons in water. Our results therefore provide a good starting point to parameterize hydrophobic association in large-scale simulations. There is a considerable difference between the PMF in the current study (based on quantum-mechanical density-functional theory) and previous results (based on classical Lennard–Jones potentials and water models). The stability of local water structures near a methane pair depends on the methane–methane separation. We analyzed the dynamic behavior of water in the solvation shell and found well structured solvation shells for particular methane–methane separations.
Methods
In our FPMD simulations, the interatomic forces were calculated in the Born–Oppenheimer approximation within density-functional theory. We used the PBE-GGA exchange-correlation functional (36) and ultra-soft pseudopotentials (37). The electronic Kohn–Sham orbitals were expanded in a plane-wave basis set with a cutoff energy of 25 Ryd. The details of the density-functional theory in the simulation of water/methane systems (cutoffs, exchange-correlation functionals, pseudopotentials, etc.) were considered in several earlier studies (38–40). The time step for MD was 0.24 fs. Two methane molecules and a number of waters were put in a cubic unit cell with periodic boundary conditions. For methane–methane separation smaller than 6.0 Å, a unit cell of side length 12.5 Å containing 63 waters was used. For methane–methane separation larger than 6.0 Å, a unit cell of side length 16.2 Å with 139 waters was used. We started data collection after an equilibration time of 3 ps. Throughout the simulation, the temperature was thermostated at 343 K. The water structure has been checked carefully at this temperature (41, 42). The simulation temperature is chosen to ensure that the system is in a liquid phase; although a complete phase diagram of the ab initio water (17) has not been mapped out, the freezing temperature is likely to be >273 K (40).
Supplementary Material
Acknowledgments
We are grateful to Frank Stillinger, and to David Chandler for pointing out to us the role of hydrophobicity at extended surfaces. This work was supported by National Science Foundation Grants CHE-0121432 and DMR-0313129. J.-L.L. is a Kenda Foundation Golden Jaden Fellow.
Abbreviations
- FPMD
first-principles molecular dynamics
- PMEF
potential of mean effective force
- PMF
potential of mean force.
Footnotes
The authors declare no conflict of interest.
See Commentary on page 2557.
This article contains supporting information online at www.pnas.org/cgi/content/full/0610945104/DC1.
For a linear hydrocarbon chain such as an alkane, its solvent-accessible area scales linearly with volume. Indeed, the free energy of the creation of a small cavity in water can be shown to be approximately linear in excluded volume. Therefore, the “cavity volume” free-energy contribution can be absorbed into the surface tension parameter σ in Eq. 4.
The value σ = 47 cal·mol−1·Å−2 is obtained by adopting Flory–Huggins theory (32), whereas Chan and Dill (6) deduced the value 34 cal·mol−1·Å−2 from “classical theory” and cyclohexane–water transfer data (see discussion in ref. 30).
Different surface measures may be more adequate for different thermodynamic properties (see, for example, discussions in ref. 31).
Had we used σ = 34 cal·mol−1·Å−2 for the surface tension parameter (30), ΔG is ≈1.9 kcal·mol−1, still considerably larger than classical force-field MD results. The difference between the two estimated ΔG values, 1.9 and 2.7 cal·mol−1·Å−2, may well be within the uncertainties of current density-functional theory approximations.
References
- 1.Scheraga HA. J Biomol Struct Dyn. 1998;16:447–460. doi: 10.1080/07391102.1998.10508260. [DOI] [PubMed] [Google Scholar]
- 2.Pratt LR. Annu Rev Phys Chem. 2002;53:409–436. doi: 10.1146/annurev.physchem.53.090401.093500. [DOI] [PubMed] [Google Scholar]
- 3.Widom B, Bhimalapuram P, Koga K. Phys Chem Chem Phys. 2003;5:3085–3093. [Google Scholar]
- 4.Wang S, Humphreys ES, Chung SY, Delduco DF, Lustig SR, Wang H, Parker KN, Rizzo NW, Subramoney S, Chiang Y-M, Jagota A. Nat Mater. 2003;2:196–200. doi: 10.1038/nmat833. [DOI] [PubMed] [Google Scholar]
- 5.Sharp KA, Nicholls A, Fine RF, Honig B. Science. 1991;252:106–109. doi: 10.1126/science.2011744. [DOI] [PubMed] [Google Scholar]
- 6.Chan HS, Dill KA. Annu Rev Biophys Biomol Struct. 1997;26:425–459. doi: 10.1146/annurev.biophys.26.1.425. [DOI] [PubMed] [Google Scholar]
- 7.Thompson PT, Davis CB, Wood RH. J Phys Chem. 1988;92:6386–6399. [Google Scholar]
- 8.Wood RH, Thompson PT. Proc Natl Acad Sci USA. 1990;87:946–949. doi: 10.1073/pnas.87.3.946. [DOI] [PMC free article] [PubMed] [Google Scholar]
- 9.Pratt LR, Chandler D. J Chem Phys. 1977;67:3683–3704. [Google Scholar]
- 10.Young WS, Brooks CL., III J Chem Phys. 1997;106:9265–9269. [Google Scholar]
- 11.Czaplewski C, Rodziewica-Motowidlo S, Liwo A, Ripoll DR, Wawak RJ, Scheraga HA. Protein Sci. 2000;9:1235–1245. doi: 10.1110/ps.9.6.1235. [DOI] [PMC free article] [PubMed] [Google Scholar]
- 11.Bromberg S, Dill KA. Molecular Driving Forces: Statistical Thermodynamics in Chemistry and Biology. New York: Routledge; 2002. [Google Scholar]
- 13.Morozov AV, Kortemme T, Tsemekhman K, Baker D. Proc Natl Acad Sci USA. 2004;101:6946–6951. doi: 10.1073/pnas.0307578101. [DOI] [PMC free article] [PubMed] [Google Scholar]
- 14.Car R, Parrinello M. Phys Rev Lett. 1985;55:2471–2474. doi: 10.1103/PhysRevLett.55.2471. [DOI] [PubMed] [Google Scholar]
- 15.Lee C, Vanderbilt D, Car R, Parrinello M. Phys Rev Lett. 1992;69:462–465. doi: 10.1103/PhysRevLett.69.462. [DOI] [PubMed] [Google Scholar]
- 16.Laasonen K, Csajka F, Parrinello M. Chem Phys Lett. 1992;194:172–174. [Google Scholar]
- 17.Laasonen K, Sprik MJ, Parrinello M, Car R. J Chem Phys. 1993;99:9080–9089. [Google Scholar]
- 18.Yarne DA, Tuckerman ME, Klein ML. Chem Phys. 2000;258:163–169. [Google Scholar]
- 19.Grossman JC, Schwegler E, Galli G. J Phys Chem B. 2004;108:15865–15872. [Google Scholar]
- 20.Pratt LR, Chandler D. J Chem Phys. 1980;73:3434–3441. [Google Scholar]
- 21.Smith DE, Haymet ADJ. J Chem Phys. 1993;98:6445–6454. [Google Scholar]
- 22.Tembe BB, McCammon JA. Comput Chem. 1984;8:281–283. [Google Scholar]
- 23.Pearlman DA. J Chem Phys. 1993;98:8946–8956. [Google Scholar]
- 24.Torrie GM, Valleau JP. J Comp Phys. 1977;23:187–199. [Google Scholar]
- 25.Ciccotti G, Ferrario M, Hynes JT, Kapral R. Chem Phys. 1989;129:241–251. [Google Scholar]
- 26.Sprik M, Ciccotti G. J Chem Phys. 1998;109:7737–7744. [Google Scholar]
- 27.Head-Gordon T. Proc Natl Acad Sci USA. 1995;92:8308–8312. doi: 10.1073/pnas.92.18.8308. [DOI] [PMC free article] [PubMed] [Google Scholar]
- 28.McAuliffe C. J Phys C. 1966;70:1267–1275. [Google Scholar]
- 29.Lee B, Richards FM. J Mol Biol. 1971;55:379–380. doi: 10.1016/0022-2836(71)90324-x. [DOI] [PubMed] [Google Scholar]
- 30.Shimizu S, Chan HS. J Chem Phys. 2001;115:1414–1421. [Google Scholar]
- 31.Shimizu S, Chan HS. Proteins. 2002;48:15–30. doi: 10.1002/prot.10108. [DOI] [PubMed] [Google Scholar]
- 32.Sharp KA, Nicholls A, Friedman R, Honig B. Biochemistry. 1991;30:9686–9697. doi: 10.1021/bi00104a017. [DOI] [PubMed] [Google Scholar]
- 33.Battino R. In: IUPAC Solubility Data Series. Clever HL, Young CL, editors. Vol 27/28. Oxford: Pergamon; 1987. pp. 1–97. [Google Scholar]
- 34.Gevantman LH. In: CRC Handbook of Chemistry and Physics. 84th Ed. Lide DR, editor. Boca Raton, FL: CRC; 2003. pp. 8-86–8-89. [Google Scholar]
- 35.Rahman A, Stillinger FH. J Am Chem Soc. 1973;95:7943–7948. [Google Scholar]
- 36.Perdew JP, Burke K, Ernzerhof M. Phys Rev Lett. 1996;77:3865–3868. doi: 10.1103/PhysRevLett.77.3865. [DOI] [PubMed] [Google Scholar]
- 37.Vanderbilt D. Phys Rev B. 1990;41:7892–7895. doi: 10.1103/physrevb.41.7892. [DOI] [PubMed] [Google Scholar]
- 38.Ikeda T, Terakura K. J Chem Phys. 2003;119:6784–6788. [Google Scholar]
- 39.Xu X, Goddard WA., III J Phys Chem A. 2004;108:2305–2313. [Google Scholar]
- 40.Sit PH-L, Marzari N. J Chem Phys. 2005;122:2045101–2045109. doi: 10.1063/1.1908913. [DOI] [PubMed] [Google Scholar]
- 41.Pasquarello A, Petri I, Salmon PS, Parisel O, Car R, Tóth É, Powell DH, Fischer HE, Helm L, Merbach AE. Science. 2001;291:856–859. doi: 10.1126/science.291.5505.856. [DOI] [PubMed] [Google Scholar]
- 42.Hetényi B, Angelis FD, Giannozzi P, Car R. J Chem Phys. 2004;120:8632–8637. doi: 10.1063/1.1703526. [DOI] [PubMed] [Google Scholar]
Associated Data
This section collects any data citations, data availability statements, or supplementary materials included in this article.


