

Abstract
UTP is a potent full agonist at both the human P2Y4 (hP2Y4) and rat P2Y4 (rP2Y4) receptor. In contrast, ATP is a potent full agonist at the rP2Y4 receptor but is a similarly potent competitive antagonist at the hP2Y4 receptor. To delineate the structural determinants of agonism versus antagonism in these species homologues, we expressed a series of human/rat P2Y4 receptor chimeras in 1321N1 human astrocytoma cells and assessed the capacity of ATP and UTP to mobilize intra-cellular Ca2+. Replacement of the NH2 terminus of the hP2Y4 receptor with the corresponding region of the rP2Y4 receptor resulted in a receptor that was activated weakly by ATP, whereas replacement of the second extracellular loop (EL2) of the hP2Y4 receptor with that of the rP2Y4 receptor yielded a chimeric receptor that was activated fully by UTP and near fully by ATP, albeit with lower potencies than those observed at the rP2Y4 receptor. These potencies were increased, and ATP was converted to a full agonist by replacing both the NH2 terminus and EL2 in the hP2Y4 receptor with the corresponding regions from the rP2Y4 receptor. Mutational analysis of the five divergent amino acids in EL2 between the two receptors revealed that three amino acids, Asn-177, Ile-183, and Leu-190, contribute to the capacity of EL2 to impart ATP agonism. Taken together, these results suggest that the second extracellular loop and the NH2 terminus form a functional motif that plays a key role in determining whether ATP functions as an agonist or antagonist at mammalian P2Y4 receptors.
Extracellular nucleotides elicit diverse physiological effects by activating G protein-coupled P2Y receptors (1, 2). Molecular cloning and heterologous receptor expression studies have led to the identification and characterization of eight human P2Y (hP2Y)1 receptor subtypes (hP2Y1,2,4,6,11–14). hP2Y1, hP2Y2, hP2Y4, hP2Y6, and hP2Y11 receptors display 27–52% amino acid identity and couple via heterotrimeric G proteins of the Gq family to the activation of phospholipase C, generation of inositol phosphates, and mobilization of intracellular Ca2+ stores (2–4). In addition to coupling to phospholipase C, the hP2Y11 receptor also couples to Gs to activate adenylyl cyclase and promotes cyclic AMP accumulation (5–7). The recently identified P2Y12, P2Y13, and P2Y14 receptors, which are encoded on a short segment of chromosome 3, have high sequence identity with each other (40–48%) but share relatively little sequence identity (22–25%) with the other hP2Y receptors. The P2Y12 receptor has been shown to be the Gi-coupled receptor in platelets that, together with the P2Y1 receptor, mediate ADP-promoted platelet aggregation (8–11). P2Y13 and P2Y14 receptors are also coupled to Gi and are activated by ADP and UDP-glucose, respectively (12, 13).
Differences in nucleotide selectivity have been observed between species orthologues of P2Y receptors. For example, the avian p2y3 and rat P2Y6 receptor are species homologues with ~65% identity that differ in their capacity to mediate adenine nucleotide-promoted inositol phosphate accumulation (14). Whereas UDP and UTP have similar potencies at the two receptors, ADP and ATP are considerably more potent and efficacious at the avian p2y3 receptor than at the rat P2Y6 receptor. Human and canine P2Y11 receptors, which share ~70% amino acid identity (15), also differ in their ability to be activated by adenine nucleotides. ATP nucleotides are more potent and efficacious than their corresponding diphosphate nucleotides at the human P2Y11 receptor for promotion of both inositol phosphate and cAMP accumulation, whereas ADP nucleotides are considerably more potent than their corresponding triphosphates at the canine P2Y11 receptor (16).
We have also observed a remarkable difference in the nucleotide selectivities and agonism versus antagonism between rat and human P2Y4 receptors, which exhibit 83% sequence identity (17). Under conditions that minimized confounding factors such as nucleotide metabolism, bioconversion, and endogenous nucleotide release, UTP, ATP, diadenosine tetraphosphate, ITP, GTP, CTP, and XTP were all full agonists at the rP2Y4 receptor, whereas only UTP, GTP, and ITP activated the hP2Y4 receptor. Moreover, whereas ATP acted as a potent, full agonist at the rP2Y4 receptor, it was a similarly potent competitive antagonist at the hP2Y4 receptor.
The capacity of ATP to bind with relatively high affinity to both species homologues of the P2Y4 receptor, but to act as an agonist at one receptor and an antagonist at the other, provides an ideal signaling system to pursue the structural basis of agonism versus antagonism. A series of hP2Y4/rP2Y4 receptor chimeras was constructed, and we report here that the second extracellular loop (EL2) of the P2Y4 receptor is a major determinant of agonist versus antagonist activity of ATP, whereas the NH2 terminus plays a lesser role. Moreover, 3 amino acids from EL2 of the hP2Y4 receptor, when replaced with the corresponding residues from the rP2Y4 receptor, are sufficient to convert ATP from an antagonist to nearly a full agonist at the hP2Y4 receptor. These studies implicate the EL2 of the P2Y4 receptor, and possibly other P2Y receptors, as a major mediator of receptor activation.
EXPERIMENTAL PROCEDURES
Materials
All tissue culture reagents and Hanks’ balanced salt solution (HBSS) were supplied by either Mediatech, Inc. (Herndon, VA) or the Lineberger Comprehensive Cancer Center tissue culture facility (University of North Carolina, Chapel Hill, NC). ATP and UTP (AP Biotech, Piscataway, NJ) were at least 99% pure and contained no other contaminating nucleotides. Fura-2/AM was from Molecular Probes (Eugene, OR). Polybrene and sodium butyrate were from Sigma Chemical (St. Louis, MO). Mouse HA.11 monoclonal antibody was from BAbCO (Richmond, CA). [125I]Rabbit anti-mouse IgG (0.1 μCi/ml) was from PerkinElmer Life Sciences (Boston, MA). Pfu polymerase was from Stratagene (La Jolla, CA).
Site-directed Mutagenesis and Construction of Chimeric Receptors
hP2Y4/rP2Y4 chimeras and receptors harboring point mutations were generated by four primer PCR (18). PCR amplification with overlapping primers was carried out with Pfu DNA polymerase from 1 ng of template. The amplification conditions were: 94 °C for 5 min; 35 cycles of 94 °C for 30 s, 56 °C for 30 s, and 72 °C for 75 s; and a final extension for 7 min at 72 °C. To generate chimera 1/EL2, chimera 1 DNA was used as a template along with specific primer pairs.
Chimeric and mutant receptor DNA constructs created as described above were digested with EcoRI and XhoI and ligated into similarly digested pLXSN vector (19). Receptors harboring the influenza virus hemagglutinin (HA) epitope tag at their NH2 termini were constructed by amplifying the coding sequence of receptors with an upstream primer containing an MluI site just preceding the second codon. The amplified fragments were digested with MluI and XhoI and used to replace the coding sequence of the human P2Y1 receptor in the plasmid pLXSN-HA-hP2Y1, which contained 15 bp of 5′-untranslated sequence, the initiating ATG codon, and the HA tag sequence followed by an MluI site at the start of the human P2Y1 receptor coding sequence. Addition of an HA tag at the NH2 terminus of a G protein-coupled receptor has been shown to have no effect on its pharmacological selectivity (20, 21). Receptor constructs were sequenced at the University of North Carolina, Chapel Hill Automated DNA Sequencing Facility.
Expression of Receptors in 1321N1 Human Astrocytoma Cells
Receptors were expressed in 1321N1 cells by using the retroviral expression system described by Comstock et al. (22). Briefly, pLXSN retroviral plasmids containing the appropriate receptor sequence were transfected into the murine packaging cell line PA317 by calcium phosphate precipitation. Following a 2-day incubation at 32 °C in the presence of 5 mM sodium butyrate, the virus-containing medium was collected, filtered, and incubated with 1321N1 human astrocytoma cells for 2 h in the presence of 8 μg/ml Polybrene. Infected 1321N1 cells were selected for Geneticin resistance for 10–14 days in the presence of 1 mg/ml G-418.
Cell Culture
PA317 cells were grown in DMEM-H, 10% fetal bovine serum, 100 units/ml penicillin, and 0.1 mg/ml streptomycin. 1321N1 cells stably expressing receptors were grown in DMEM-H, 5% fetal bovine serum, 0.4 mg/ml G-418, 100 units/ml penicillin, 0.1 mg/ml streptomycin, and 0.25 μg/ml amphotericin B. Cells were grown in monolayer and maintained at 37 °C in a humidified atmosphere of 5% CO2/95% air.
Intracellular [Ca2+] Measurements
Intracellular [Ca2+] was determined as described previously (16, 17). Briefly, cells were grown on 22-mm glass coverslips to ~20% confluence and then were loaded with 750 nM Fura-2/AM for 30 min. Coverslips were encased in a Plexiglas flowthrough chamber (0.2-ml volume) and continuously superfused at ~1.4 ml/min with buffer (HBSS plus Ca2+/Mg2+) with or without ligands. The chamber was secured to the stage of a Nikon inverted fluorescence microscope, and data were recorded and processed with an InCyt Im2 imaging system (Intracellular Imaging Inc., Cincinnati, OH). Ligands were applied for 30 s, and intracellular [Ca2+] was monitored in 6–15 individual cells per coverslip. A small number of unresponsive cells that were not activated by a maximal dose of UTP (100–300 μM) were not included for analysis. To generate concentration-response curves, each concentration of nucleotide was applied only once to each coverslip to avoid receptor desensitization, and the area under the curve (AUC) was determined by using National Institutes of Health Image software. The values from at least three coverslips were averaged and plotted as a function of nucleotide concentration.
Radioimmunoassay
Cells were seeded in 24-well plates at 5 × 10⁴ cells/well 3 days prior to assay. Cells were fixed with 0.2 ml of 4% paraformaldehyde for 30 min at room temperature, washed twice with 1 ml of HBSS plus Ca2+/Mg2+, and blocked for 30 min at room temperature with 0.2 ml of DMEM-H plus 50 mM HEPES, pH 7.1, and 10% fetal bovine serum. Cells were incubated with mouse HA.11 monoclonal antibody at a 1:1000 dilution in 0.2 ml of medium for 1 h at room temperature. Following two washes with 1 ml of HBSS plus Ca2+/Mg2+, cells were incubated with [125I]rabbit anti-mouse IgG antibody diluted to 1:500 in 0.2 ml of medium for 2 h at room temperature. Following another series of washing steps, cells were solubilized in 0.4 ml of 1 M NaOH overnight and transferred to glass tubes for quantitation in a gamma counter.
Data Analysis and Statistics
EC50 values and 95% confidence limits for EC50 values were calculated by non-linear regression with Graph-Pad Prism 3.0 software (GraphPad, San Diego, CA). Data were compared using one-way analysis of variance and Tukey’s post-test comparison, with p < 0.05 considered to be statistically significant.
RESULTS
Construction of Chimeric hP2Y4 and rP2Y4 Receptors
We previously reported that ATP is a potent full agonist at the rP2Y4 but is a similarly potent competitive antagonist at the hP2Y4 (17). To ascertain the structural basis for this difference in agonism versus antagonism, we generated a series of chimeric receptors between these similar species orthologues (83% identity; see Fig. 1A). As illustrated in Fig. 1B, these chimeras were constructed by systematic replacement of small regions of the hP2Y4 with the corresponding regions from the rP2Y4 receptor. The replacements were made in the hP2Y4 receptor so we could identify one or more domains from the rP2Y4 receptor that conferred a change of ATP from a potent antagonist to a potent agonist when inserted into the hP2Y4 receptor. Thus, these experiments were designed to identify a “gain of function” by analyzing the responsiveness of the chimeric receptors to ATP. The receptors were stably expressed in 1321N1 human astrocytoma cells, which do not exhibit functional responses to extracellular nucleotides (23), and nucleotide-promoted intra-cellular Ca2+ mobilization was quantitated under conditions that minimized the potential confounding effects of nucleotide metabolism, bioconversion, and accumulation of released nucleotides (17).
Fig. 1. Alignment of hP2Y4 and rP2Y4 receptor sequences and schematic representation of hP2Y4/rP2Y4 chimeras.
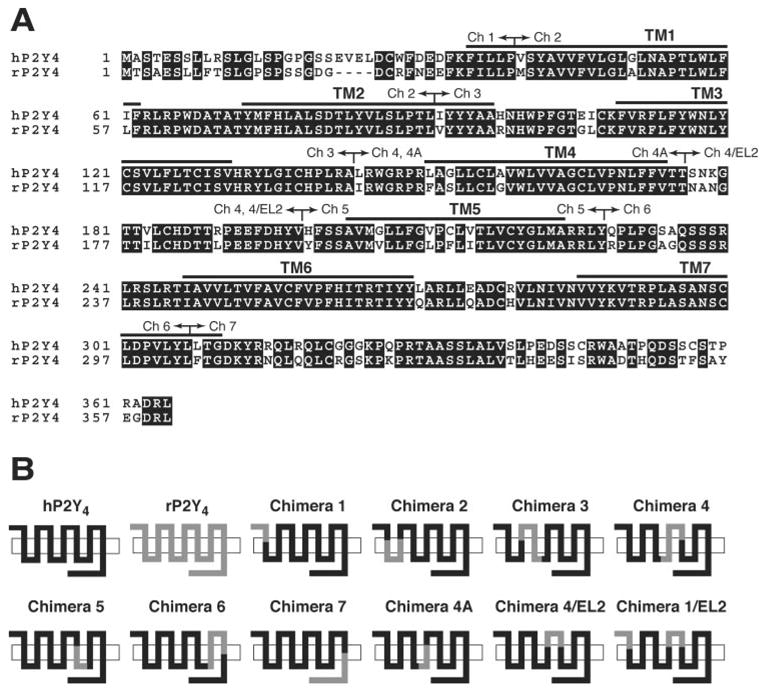
A, Boxshade (available on the World Wide Web) representation of a ClustalX alignment of human and rat P2Y4 receptors. Gaps (−) were introduced to improve the alignment. The arrows represent the specific locations of sequence exchange in each chimera. B, schematic representation of receptor chimeras.
As previously studied in detail (17), 100 μM ATP failed to activate the hP2Y4 receptor, whereas application of 100 μM UTP to hP2Y4-1321N1 cells induced a rapid, reversible rise in intracellular Ca2+ levels (Fig. 2A, right panel). This profile was clearly different from that of the rP2Y4 receptor, which displayed robust responses to both ATP and UTP (Fig. 2B, right panel). The lower apparent maximum effect of UTP compared with ATP illustrated in the right panel in Fig. 2B was due to desensitization of the rP2Y4, because the maximum increase in intracellular [Ca2+] evoked by a single application of 100 μM ATP or UTP applied to separate coverslips was identical (Fig. 2B, left panel and data not shown).
Fig. 2. Nucleotide-promoted intracellular Ca2+ mobilization in 1321N1 cells expressing either the hP2Y4 (A) or rP2Y4 (B) receptor.
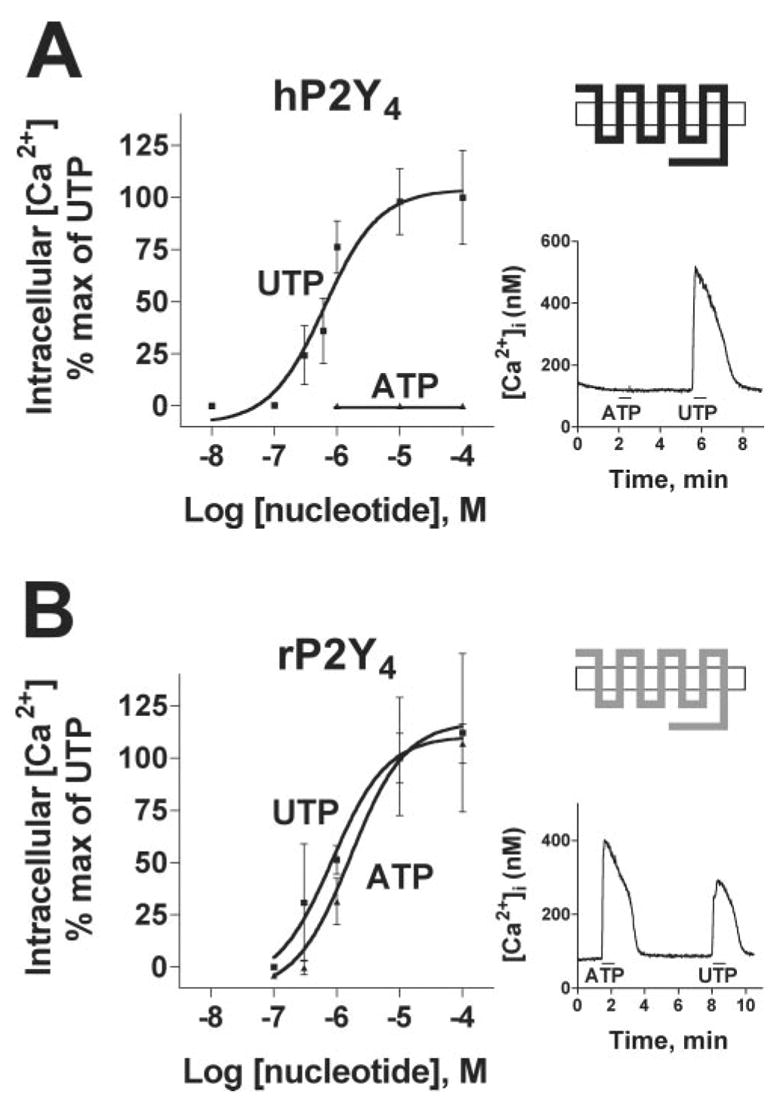
The left panels are concentration-response curves for UTP and ATP, and the right panels show Ca2+ traces to each nucleotide. To generate the concentration-response curves, individual coverslips of cells were exposed to a single concentration of nucleotide in buffer for 30 s. Traces of intracellular Ca2+ concentrations were recorded from 6–15 individual responding cells/coverslip and averaged. Data points represent the mean ± S.D. of the AUC from the averaged Ca2+ trace from a minimum of three coverslips and are presented as percentages of the maximal response to UTP. The Ca2+ traces in the right panels showing the responses to 100 μM ATP and 100 μM UTP are averages of at least six cells. Nucleotides were applied for 30 s as indicated by the bars below the traces. These results are representative of at least six similar experiments. The receptor schematics are identical to those in Fig. 1B.
Concentration-response curves for nucleotides were generated by integrating the area under the curve (AUC) of the Ca2+ response averaged from 6–15 cells on a coverslip, with at least three coverslips assayed for each concentration. To avoid concerns about desensitization, each coverslip was exposed only once to a single nucleotide concentration. AUC values for each agonist concentration reflect both the time and magnitude of the Ca2+ mobilization response and the number of responding cells in the imaging field. UTP increased intracellular Ca2+ levels in 1321N1-hP2Y4 cells with an EC50 of 530 ± 220 nM, whereas ATP was without agonist effect at all concentrations tested (Fig. 2A, left panel, and Table I). Moreover, ATP competitively antagonized the stimulatory effects of UTP at the hP2Y4 with a Kb value (antagonist dissociation constant) of 700 nM that is very similar to the potency of UTP for activation (Ref. 17 and data not shown). In contrast, both UTP and ATP promoted intracellular Ca2+ mobilization in 1321N1-rP2Y4 cells with EC50 values of 600 ± 220 and 890 ± 460 nM, respectively (Fig. 2B, left panel, and Table I). Thus, UTP activated both the hP2Y4 and rP2Y4 receptor with comparable potencies, whereas ATP was a full agonist at the rP2Y4 receptor and an antagonist at the hP2Y4 receptor.
Table I. Potencies of UTP and ATP for mobilization of intracellular [Ca2+] at the various P2Y4 receptors described in this study.
Dose-response curves were generated as described under “Experimental Procedures.” EC50 values (μM) are presented as mean values ± S.D. for wild type hP2Y4 and rP2Y4 receptors (n ≥ 5) or as values (95% confidence intervals) calculated by nonlinear regression for all of the chimeric and mutant receptors.
| Receptor | UTP | ATP |
|---|---|---|
| hP2Y4 | 0.53 ± 0.22 (n = 5) | NEa (n = 7) |
| rP2Y4 | 0.60 ± 0.22 (n = 6) | 0.89 ± 0.46 (n = 7) |
| Chimera 1 | 1.5 (0.64–3.3) | NDb |
| Chimera 2 | 1.0 (0.47–2.2) | NE |
| Chimera 3 | 0.66 (0.17–2.5) | NE |
| Chimera 4 | 13 (3.1–54) | 95 (28–320) |
| Chimera 5 | 0.9 (0.3–2.7) | NE |
| Chimera 6 | 0.55 (0.16–3.5) | NE |
| Chimera 7 | 0.80 (0.22–2.9) | NE |
| Chimera 4A | 1.3 (0.58–2.9) | NE |
| Chimera 4/EL2 | 6.0 (3.4–11) | 51 (19–140) |
| Chimera 1/EL2 | 1.9 (0.50–7.2) | 12 (2.4–58) |
| hP2Y4 S177N | 1.0 (0.38–2.7) | ND |
| hP2Y4 N178A | 1.0 (0.40–2.6) | NE |
| hP2Y4 K179N | 0.50 (0.20–1.2) | NE |
| hP2Y4 V183I | 0.69 (0.24–2.0) | ND |
| hP2Y4 R190L | 0.45 (0.25–0.81) | ND |
| Triple mutant | 5.6 (2.1–16) | 48 (7.2–320) |
NE, no effect.
ND, not determined; the response to ATP did not reach maximum at the highest concentration tested (300 μM).
Characterization of the hP2Y4/rP2Y4 Receptor Chimeras
Each of the seven first-generation chimeras (Fig. 1B) was fully functional when expressed in 1321N1 cells, with UTP promoting robust intracellular Ca2+ mobilization responses (Fig. 3 and Table I). The EC50 values for UTP ranged from 0.55 to 13 μM for the various constructs (Table I). However, marked differences in the response to ATP were observed among the chimeras. Similar to the hP2Y4 receptor, no responses to 100 μM ATP were observed in 1321N1 cells expressing chimeras 2, 3, 5, 6, or 7 (Fig. 3B and data not shown). A weak but reproducible response to ATP was observed with chimera 1 (Fig. 3A). However, a nearly full agonist response to ATP was observed in cells expressing chimera 4, which contained the second intra-cellular loop (IL2), transmembrane 4 (TM4), and the second extracellular loop (EL2) of the rP2Y4 receptor (Fig. 3C). The EC50 values of UTP and ATP at chimera 4 were 13 and 95 μM, respectively (Table I). The reason(s) for the shift to the right of the agonist activation curves in chimera 4 but not in the other chimeras has not been fully pursued, but it is unlikely that it is due to differences in receptor expression at the cell surface (as discussed below). These data demonstrate that the region encompassing the second intracellular loop and second extracellular loop of the hP2Y4 and rP2Y4 receptors is a uniquely important determinant of ATP agonism at the P2Y4 receptor.
Fig. 3. Nucleotide-promoted intracellular Ca2+ mobilization in 1321N1 cells expressing hP2Y4/rP2Y4 receptor chimeras.
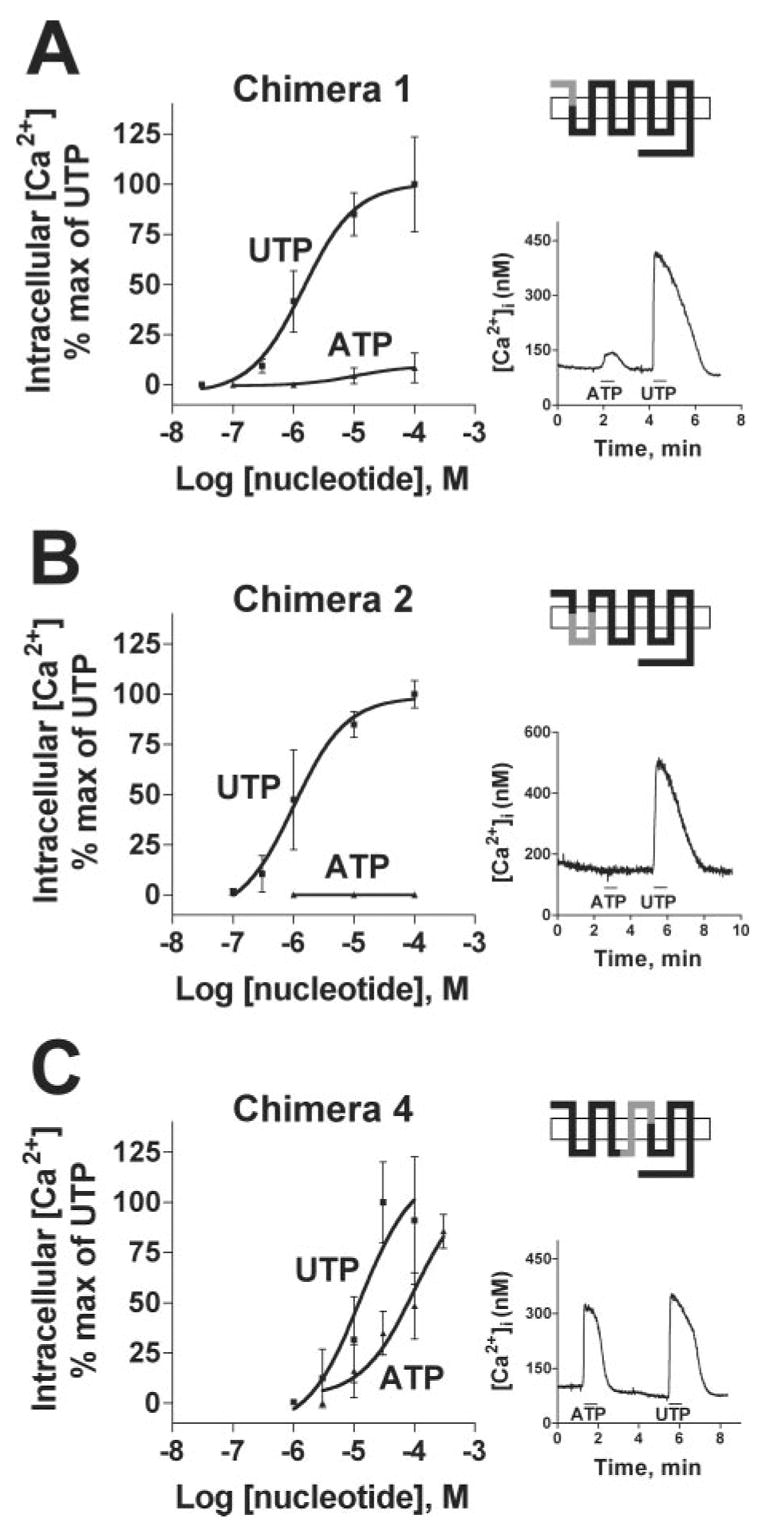
A–E, the hP2Y4 receptor with the single point mutations S177N, N178A, K179N, V183I, and R190L, respectively. F, the human P2Y4 receptor with three point mutations, S177N, V183I, and R190L. See the legend to Fig. 2 for details. Chimeras 3, 5, 6, and 7 showed identical responses as chimera 2.
Roles of IL2, TM4, and EL2 from the rat P2Y4 Receptor in Imparting ATP Agonist Activity to the Human P2Y4 Receptor
The results with chimera 4 suggested the existence of identifiable sequence in the P2Y4 receptor responsible for agonist versus antagonist action of ATP. Thus, we generated two additional chimeras, in which IL2 and TM4 (chimera 4A) or EL2 (chimera 4/EL2) of the hP2Y4 receptor were replaced individually with their cognate sequences from the rP2Y4 receptor (see Fig. 1A). As was observed with chimeras 1–7, UTP was a potent agonist at these chimeric P2Y4 receptors (Fig. 4 and Table I). Replacement of IL2 and TM4 of the hP2Y4 receptor with the corresponding region from the rP2Y4 receptor failed to alter the phenotype of the hP2Y4 receptor (Fig. 4A), whereas replacement of EL2 of the hP2Y4 receptor with the corresponding domain from the rP2Y4 receptor resulted in a near full agonist response to ATP (Fig 4B). Moreover, the agonist profile of chimera 4/EL2 was essentially identical to that of chimera 4 (Table I). These data indicate that EL2 specifies the ability of ATP to act as an agonist or antagonist at the P2Y4 receptor.
Fig. 4. Identification of the region in chimera 4 responsible for ATP-promoted intracellular Ca2+ mobilization.
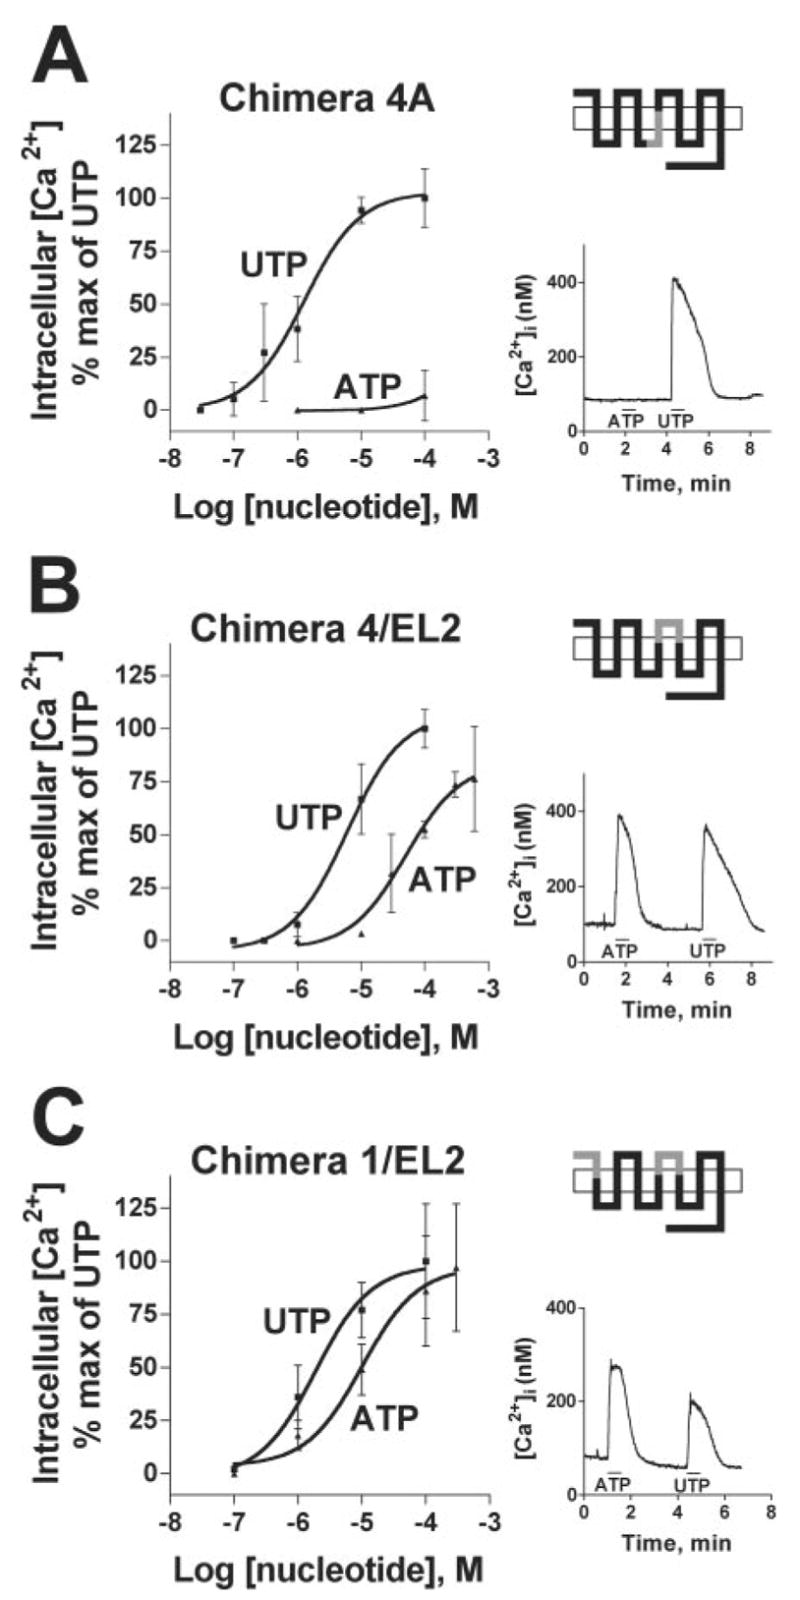
A, chimera 4A, the hP2Y4 receptor containing IL2 and TM4 from the rP2Y4 receptor. B, chimera 4/EL2, the hP2Y4 receptor containing the EL2 from the rP2Y4 receptor. C, chimera 1/EL2, the hP2Y4 receptor containing the NH2 terminus and EL2 from the rP2Y4 receptor. See the legend to Fig. 2 for details.
As illustrated earlier, replacement of the hP2Y4 receptor NH2 terminus with the corresponding sequence from the rP2Y4 receptor (chimera 1) resulted in a receptor that was activated, albeit weakly, by 100 μM ATP (Fig. 3A). Therefore, we constructed an additional chimera of the hP2Y4 receptor (chimera 1/EL2), in which both the NH2 terminus and EL2 of the hP2Y4 receptor were replaced by the cognate regions from the rP2Y4 receptor, with the goal of generating a P2Y4 receptor exhibiting potencies for UTP and ATP more closely resembling those of the wild type rP2Y4 receptor. Indeed, the EC50 values of UTP and ATP for promotion of intracellular Ca2+ mobilization at chimera 1/EL2 were 1.9 and 12 μM, respectively (Fig. 4C and Table I). Moreover, ATP became an apparent full agonist at chimera 1/EL2, compared with the partial agonism of ATP in chimera 4/EL2 (Fig. 4, compare B with C). Thus, the incorporation of the rP2Y4 NH2 terminus onto chimera 4 increased the potencies of UTP and ATP 4- to 5-fold and converted ATP to an apparent full agonist, suggesting that the rP2Y4 NH2 terminus is a minor determinant of the agonist activity of ATP at the rP2Y4 receptor.
Roles of Individual Amino Acids in EL2 of the Rat P2Y4 Receptor in Imparting Agonist Activity to ATP
Because EL2 was a major determinant of agonist versus antagonist activity at the two P2Y4 receptor homologues, we individually mutated each of the 5 divergent amino acids (Fig. 1A) in EL2 of the hP2Y4 receptor to the corresponding residue of the rP2Y4 receptor. Cells stably expressing these hP2Y4 receptor point mutants exhibited robust Ca2+ responses to UTP (Fig. 5), and the potencies of UTP at the mutant hP2Y4 receptors were very similar to that at the wild type hP2Y4 receptor (Table I). ATP was not an agonist in cells expressing the hP2Y4-N178A and hP2Y4-K179N mutants. In contrast, introduction of single point mutations at Ser-177 (S177N), Val-183 (V183I), and Arg-190 (R190L) resulted in P2Y4 receptors at which ATP was active, albeit with much lower efficacies and potencies than those observed in chimera 4/EL2 (Fig. 5). The EC50 values for ATP-promoted intracellular Ca2+ mobilization at these hP2Y4 mutant receptors could not be determined, because the concentration-response curves for ATP did not reach a maximum at less than millimolar concentrations. To determine if these three residues were the only determinants of ATP agonism in EL2, we mutated Ser-177, Val-183, and Arg-190 together to the corresponding residues of the rP2Y4 receptor (triple mutant) and generated concentration-response curves to ATP. The triple mutant receptor had essentially identical EC50 values for both UTP and ATP as chimera 4/EL2 (Table I), suggesting that these 3 residues act in concert to promote ATP agonism. The lack of activity of ATP at all concentrations tested at hP2Y4-N178A and hP2Y4-K179N receptors, together with the effects of the triple mutation, demonstrates that these residues have no role in ATP agonism in the P2Y4 receptor.
Fig. 5. Nucleotide-promoted intracellular Ca2+ mobilization in 1321N1 cells expressing single point mutants within EL2 of the hP2Y4 receptor.

A, chimera 1, the hP2Y4 receptor containing the NH2 terminus from the rP2Y4 receptor. B, chimera 2, the hP2Y4 receptor containing TM1, IL1, and TM2 from the rP2Y4 receptor. C, chimera 4, the hP2Y4 receptor containing IL2, TM4, and EL2 from the rP2Y4 receptor. The concentration-response curves from the five individual point mutants of the hP2Y4 receptor and a receptor containing the S177N, V183I, and R190L mutations (triple mutant) are shown.
Antagonist Effects of ATP at P2Y4 Receptor Chimeras and Point Mutants
The antagonist activity of ATP was also tested with the hP2Y4/rP2Y4 chimeras and point mutants. In each case, the capacity of ATP to inhibit UTP-promoted intracellular Ca2+ mobilization was determined in 1321N1 cells expressing these receptor constructs. Cells were superfused with increasing concentrations of ATP in the presence of a concentration of UTP (1 μM) similar to the EC50 values at the various P2Y4 constructs (Table I). As demonstrated previously (17), ATP inhibited UTP-promoted Ca2+ mobilization in a concentration-dependent manner in cells expressing the hP2Y4 receptor (Fig. 6). Similarly, ATP retained its antagonist properties at chimeras 2, 3, 5, and 6 (data not shown). These results are consistent with the observation that ATP failed to activate these same receptors, thus providing additional evidence that the receptor domains exchanged in these chimeras are not determinants of agonism/antagonism of ATP at the P2Y4 receptor. In contrast, ATP had no antagonist activity at chimeras 1 (Fig. 6) and 7 (data not shown). Thus, in addition to EL2, the NH2 and COOH termini of the hP2Y4 receptor also appear to contribute to the capacity of ATP to act as an antagonist.
Fig. 6. ATP antagonism of UTP-promoted intracellular Ca2+ mobilization in 1321N1 cells expressing either the hP2Y4 receptor chimeras and point mutants.
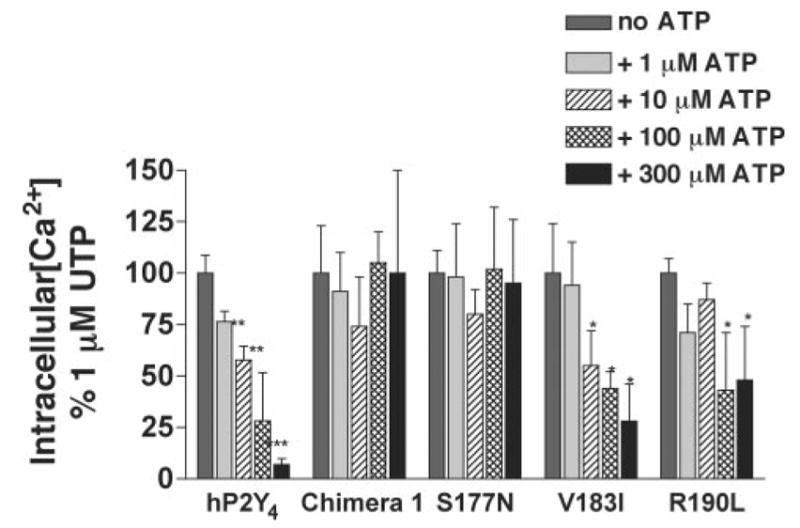
Single coverslips of cells were exposed to either 1 μM UTP alone or 1 μM UTP plus the indicated concentration of ATP for 30 s. Traces of intracellular Ca2+ concentrations were recorded from 6–15 individual responding cells/coverslip and averaged. Each bar represents the mean ± S.D. of the AUC from the averaged Ca2+ trace from a minimum of three coverslips and is presented as a percentage of the maximal response to 1 μM UTP. *, p < 0.05; **, p < 0.01; ***, p < 0.001 relative to the response of 1 μM UTP.
The capacity of ATP to inhibit UTP-promoted intracellular Ca2+ mobilization also was determined in cells expressing the hP2Y4 receptor point mutants. ATP antagonized UTP-promoted intracellular Ca2+ mobilization in cells expressing the wild type hP2Y4 receptor as well as the hP2Y4-N178A, hP2Y4-K179N, and hP2Y4-V183I point mutants (Fig. 6 and data not shown). In contrast, 300 μM ATP did not antagonize UTP-promoted Ca2+ mobilization in cells expressing the hP2Y4-S177N mutant and inhibited ~50% of the UTP-promoted intracellular Ca2+ mobilization in cells expressing the hP2Y4-R190L mutant (Fig. 6).
Cell Surface Expression of P2Y4 Receptor Chimeras and Mutants
In face of the lack of a radioligand binding assay for quantification of surface expression of P2Y4 receptors, we incorporated an HA-epitope tag at their NH2 termini. This epitope tag was utilized to measure the relative cell surface expression of P2Y4 receptors in intact 1321N1 cells as described under “Experimental Procedures.” The level of expression of the various constructs varied by 3- to 4-fold. The majority of the receptors were expressed at about the same level as the hP2Y4 receptor, whereas the rP2Y4 receptor, chimeras 1/EL2 and 4/EL2, and the hP2Y4-K179N point mutant were expressed at higher levels (Fig. 7). There was no correlation between the level of cell surface expression and the capacity of ATP to activate the receptor (e.g. the hP2Y4-K179N receptor has one of the highest levels of expression but is not activated by ATP). Moreover, some of the chimeras with the highest apparent expression displayed the lowest EC50 values for UTP promotion of Ca2+ mobilization. Thus, these data suggest that differences in receptor expression did not account for the differences observed in responses to either UTP or ATP.
Fig. 7. Cell surface RIA analysis.
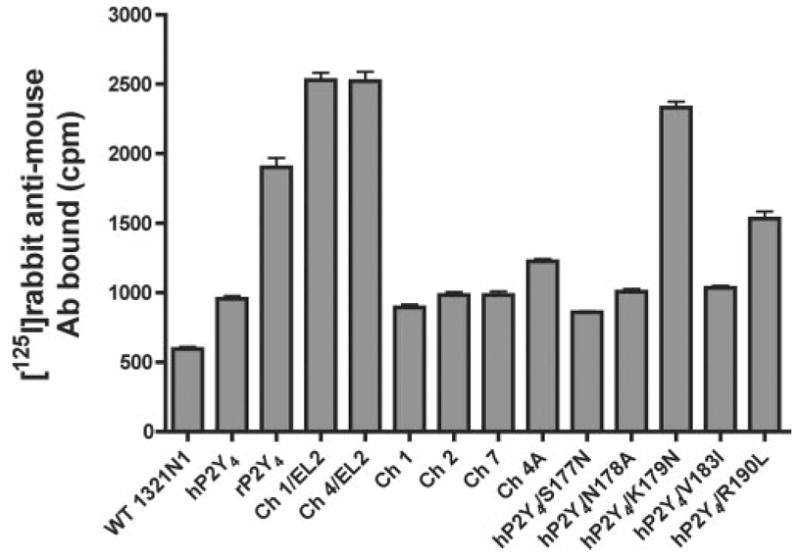
Cell surface expression of various receptor constructs was quantitated as described under “Experimental Procedures.” The values represent the average of three separate determinations.
DISCUSSION
Because hP2Y4 and rP2Y4 receptors have high sequence identity (83%) yet display markedly different nucleotide selectivities, they represent an ideal receptor pair for investigating the molecular determinants of P2Y receptor agonism versus antagonism. To identify the region(s) of the receptor that determines the action of ATP, we constructed chimeric receptors in which consecutive regions of the hP2Y4 receptor were replaced with the corresponding regions of the rP2Y4 receptor and characterized their ability to promote Ca2+ mobilization in response to ATP. The data presented here demonstrate that the marked difference in agonist versus antagonist action of ATP at the hP2Y4 and rP2Y4 receptors primarily is the result of amino acid differences in their second extracellular loops, and to a lesser degree, their NH2 termini.
All of the chimeras we generated (with the exception of chimera 4; see below) were activated fully by UTP with EC50 values that were very similar to the EC50 of UTP at the wild type hP2Y4 receptor. These results suggest that there is little if any difference in affinity (and intrinsic efficacy) for UTP across a wide range of chimeric constructs. These results emphasize the power of a “gain-of-function” approach over the more widely applied loss-of-function studies utilized for other GPCRs, because it minimizes concerns that significant changes in the binding pocket have occurred due to aberrant folding of chimeric receptors. These data also suggest that the amino acids that regulate both the binding affinity and intrinsic efficacy of UTP are identical in both rat and human P2Y4 receptors.
In contrast to UTP, ATP activated several of the chimeric constructs with variable potencies and efficacies. Because ATP binds to both the wild type rat and human homologues, but activates the rat receptor and antagonizes the human receptor, it is likely that both receptors contain the necessary amino acids to bind ATP. Thus, our data suggest that the changes in ATP potency and efficacy are not due to changes in binding affinity but rather arise from changes in the intrinsic activity of ATP. Moreover, observation of ATP agonism in the hP2Y4 receptor with differing EC50 values in the different constructs suggests that multiple amino acids are involved in the conformational switch to the activated state and that these amino acids contribute to setting the level of intrinsic activity of ATP. That is, once the threshold is crossed that changes ATP from an antagonist to an agonist, further alterations in the protein likely change the intrinsic activity of ATP and not its affinity.
We observed a 10-fold decrease in the EC50 of UTP and a 50-fold decrease in the EC50 of ATP at chimera 4/EL2 compared with wild type hP2Y4 and rP2Y4 receptors. Interestingly, we did not observe similar decreases in the EC50 for UTP in the three individual EL2 point mutants, suggesting that the lower potencies of UTP at chimera 4/EL2 are due to the combined contribution of these three amino acids. It seems reasonable to propose that the decreases in potency of UTP and ATP at chimera 4/EL2 reflect a decrease in the intrinsic efficacy of both nucleotides such that higher concentrations of the nucleotides are required to achieve the same activity as in the wild type receptors.
Substitution of the hP2Y4 NH2 terminus with the corresponding region of the rP2Y4 receptor (chimera 1) resulted in a receptor that minimally but reproducibly promoted an increase in intracellular [Ca2+] in response to high concentrations of ATP (Fig. 3A). In addition, ATP did not antagonize this receptor at the highest concentration tested (300 μM) (Fig. 6). We reasoned that replacing both EL2 and the NH2 terminus of the hP2Y4 receptor with the corresponding regions of the rP2Y4 receptor might restore the EC50 values of ATP and UTP to those for the wild type rP2Y4 receptor. Indeed, ATP and UTP activated chimera1/EL2 with higher potencies compared with chimera 4 or 4/EL2. Moreover, adding the NH2 terminus of the rP2Y4 receptor to chimera 4/EL2 changed ATP from a partial agonist to an apparent full agonist. Thus, although the rP2Y4 EL2 alone is sufficient to confer ATP agonist activity to the hP2Y4 receptor, the rP2Y4 NH2 terminus appears to be an additional determinant that increases the intrinsic activity of ATP at the rP2Y4 receptor. Even with the increase in potencies for ATP and UTP afforded by substitution of the rP2Y4 NH2 terminus into chimera 4/EL2, the EC50 values were still higher (especially for ATP) than those for the rP2Y4 receptor. These data suggest that additional amino acids in the rP2Y4 receptor function to increase the intrinsic efficacy of ATP. The identity of these other amino acids has not been pursued.
A cell surface RIA revealed that, compared with most of the receptor constructs, a subset of receptors was expressed at the cell surface at relatively high levels (Fig. 7). Interestingly, all of the receptors with increased expression contained an asparagine residue at position-179 instead of an aspartic acid (Fig. 1). Because both receptors have a threonine residue at position-181, an asparagine residue at position-179 creates a consensus N-linked glycosylation site. Indeed, Western blotting of the rP2Y4 receptor revealed a diffuse band (data not shown) indicative of glycosylation compared with a single tight band for the hP2Y4 receptor (which has no consensus glycosylation sites), suggesting that the site is utilized by the glycosylation machinery in 1321N1 cells. We considered whether glycosylation might change the ATP selectivity of the receptor; however, ATP had no agonist activity at the hP2Y4-K179N receptor, which contains a glycosylation site and is expressed at higher levels on the cell surface. Moreover, there was no correlation between cell surface expression and the capacity of the receptor to be activated by ATP. These data are consistent with the interpretation that ATP agonist activity is mediated by amino acids in EL2 and not through changes in receptor expression.
Several studies have proposed attractive models for agonist activation and nucleotide docking within P2Y receptors. For example, Jiang et al. (24) suggested that positively charged amino acids near the exofacial side of TMs 3, 6, and 7 are important for ATP binding to the hP2Y1 receptor, presumably through their interaction with the negatively charged phosphates of ATP. Several charged residues in the second and third extracellular loops of the hP2Y1 receptor also have been implicated in ligand recognition (25). Erb et al. (26) reported that four positively charged amino acids in TMs 6 and 7 of the hP2Y2 receptor play a role in agonist binding based on the loss of agonist potency. However, given the lack of a reliable binding assay for the P2Y receptor family, the results of these studies must be interpreted cautiously, because general conclusions were based on loss-of-function studies. In contrast, the observation that ATP does not activate the hP2Y4 receptor provided an opportunity to make gain-of-function chimeras and mutants to correlate receptor function with specific receptor domains and amino acid residues. By reconstituting regions from the rP2Y4 receptor into the hP2Y4 receptor, the ability of ATP to function as an agonist was recapitulated in the background of the wild type hP2Y4 receptor. These studies point to the rP2Y4 receptor EL2 as a critical determinant for P2Y4 agonist specificity.
It is well established that receptors for small ligands such as neurotransmitters and monoamines utilize transmembrane domains for ligand binding and activation (27, 28). Although nucleotides are relatively small ligands, the P2Y receptors are more related to peptide receptors than they are to receptors for monoamines and neurotransmitters (29, 30). The accepted models for ligand binding to GPCRs posit binding of endogenous peptide agonists in the extracellular loops and the exofacial regions of transmembrane domains, whereas the binding of non-peptide antagonists to the same receptors takes place deeper within the transmembrane domains (31). Here we add additional evidence that an extracellular loop (EL2) plays a critical role in the function of a GPCR (P2Y4) most closely related to GPCRs for peptide ligands. The role of extracellular loops in the activation of another nucleotide receptor (hP2Y1 receptor) has been reported by Hoffman et al. (25).
Models for GPCR activity suggest that receptors spontaneously isomerize between inactive and active conformations and that the activated conformation associates with G proteins to promote intracellular signaling responses (32, 33). According to these models, agonists exert their effects by preferentially binding to and stabilizing the activated conformation. Our data suggest that the amino acid differences found in the second extracellular loops (and, to a lesser extent, the NH2 termini) of hP2Y4 and rP2Y4 receptors function to promote the active conformation upon ATP binding. Under this scenario, we hypothesize that the amino acids in the rP2Y4 receptor EL2 (i.e. Asn-177, Ile-183, and Leu-190) utilize the binding energy of ATP to break the constraint within the inactive conformation and allow ATP to stabilize the active conformation and promote a subsequent signaling response.
To determine the potential validity of the preceding hypothesis and to visualize how ATP might bind to the P2Y4 receptor, we manually docked ATP into the active site of a molecular model of the hP2Y4 receptor (Fig. 8) based on the recent 2.4-Å structure of rhodopsin (34). The validity of this model, although illuminating, is tempered by the manual docking of ATP and by the fact that rhodopsin may not be a suitable template for generating molecular models of some GPCRs (35). Nonetheless, the results are interesting and are consistent with previous studies and the data presented here. For example, placement of the phosphate moiety of ATP in close proximity to TMs 6 and 7, as suggested by the mutagenesis experiments of Jiang et al. (24) and Erb et al. (26), positions the adenine base in an ideal position to interact with both EL2 and the NH2 terminus. Also shown in Fig. 8 are the positions of the three amino acids identified in EL2 as being important in promoting the agonist activity of ATP. Interestingly, these three amino acids are widely separated in this preliminary model, and two of the three residues are far from the adenine ring, again consistent with our hypothesis that these residues are involved in conformational changes and not nucleotide binding. Lastly, this simple model suggests that the binding of ATP in the rat P2Y4 receptor induces a conformational change that is transmitted through TMs 4 and/or 5, which then alters the conformation of the 2nd and/or 3rd intracellular loop and ultimately promotes activation of Gq.
Fig. 8. Manual docking of ATP into a molecular model of the P2Y4 receptor.
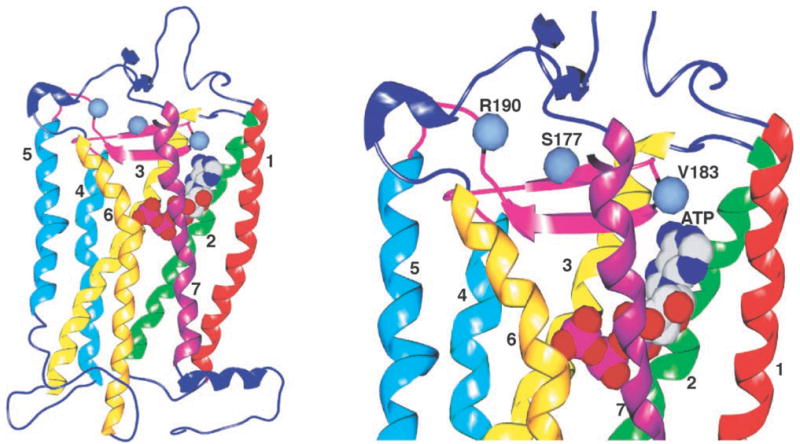
The molecular model of the hP2Y4 receptor was developed with the program InsightII based on the crystal structure of rhodopsin (1F88 (34)). The coordinates for ATP were obtained from the structure of the ATP-binding subunit of Histidine Permease (1B0U (41)). The ATP molecule was docked manually into the P2Y4 model so that its triphosphate moiety was in close proximity to the exofacial sides of TMs 6 and 7 as suggested by Jiang et al. (24) and Erb et al. (26). These images were generated with the program Spock (available on the world wide web).
Recent studies have revealed that mutations in a host of GPCRs result in constitutive activation (36–38). Receptors containing these mutations are thought to mimic the active conformation by adopting a structure capable of activating the G protein in the absence of agonists. These studies suggest that the wild type amino acids at these positions function to constrain the receptor in its inactive state and that mutation of these residues releases these constraints to allow the receptor to adopt an active conformation in the absence of agonists. Although most of these constitutively activating mutations are located in transmembrane domains, several of them, such as those found in angiotensin AT1A, Ca2+ sensing, and thyrotropin receptors, are located within the extracellular loops (38–40). The location of constitutively activating mutations in the extracellular loops is consistent with our data, which demonstrate that residues within EL2 of the P2Y4 receptor are involved in the switch to the active state. Thus, our data are also relevant to other GPCRs and suggest that, in addition to the more widely accepted role of TM domains, the extracellular loops also play an important role in activation.
In conclusion, we have used a gain-of-function approach with hP2Y4/rP2Y4 receptor chimeras to provide direct evidence that the second extracellular loop is the main determinant that confers the unique agonist/antagonist properties of ATP for these P2Y4 receptor species homologues. The understanding of how nucleotides interact with P2Y4 receptors to initiate signaling or antagonize functional responses could aid in the development of subtype-specific ligands, agents that will aid further studies of P2Y receptors as a whole.
Acknowledgments
We thank Kyle Palmer and Amy Brinson for technical assistance with Ca2+ imaging and radioimmunoassay, respectively. We also thank Dr. Brenda Temple for help in generating the ATP docking model.
The abbreviations used are
- hP2Y receptor
human P2Y receptor, hP2Y4 receptor, human P2Y4 receptor
- rP2Y4 receptor
rat P2Y4 receptor
- IL2
second intracellular loop
- EL2
second extracellular loop
- TM
transmembrane domain
- HA
hemagglutinin
- GPCRs
G protein-coupled receptors
- HBSS
Hanks’ balanced salt solution
- DMEM-H
Dulbecco’s modified Eagle’s medium with high glucose
- AUC
area under the curve
Footnotes
This work was supported in part by National Institutes of Health Grants HL71131 (to R. A. N) and GM38213 (to T. K. H.). The costs of publication of this article were defrayed in part by the payment of page charges.
References
- 1.Ralevic V, Burnstock G. Pharmacol Rev. 1998;50:413–492. [PubMed] [Google Scholar]
- 2.Harden TK. In: Cardiovascular Biology of Purines. Burnstock G, Dobson JG Jr, Liang BT, Linden J, editors. Kluwer Academic Publishers; Boston: 1998. pp. 181–205. [Google Scholar]
- 3.North RA, Barnard EA. Curr Opin Neurobiol. 1997;7:346–357. doi: 10.1016/s0959-4388(97)80062-1. [DOI] [PubMed] [Google Scholar]
- 4.King BF, Townsend-Nicholson A, Burnstock G. Trends Pharmacol Sci. 1998;19:506–514. doi: 10.1016/s0165-6147(98)01271-1. [DOI] [PubMed] [Google Scholar]
- 5.Communi D, Govaerts C, Parmentier M, Boeynaems JM. J Biol Chem. 1997;272:31969–31973. doi: 10.1074/jbc.272.51.31969. [DOI] [PubMed] [Google Scholar]
- 6.Communi D, Robaye B, Boeynaems JM. Br J Pharmacol. 1999;128:1199–1206. doi: 10.1038/sj.bjp.0702909. [DOI] [PMC free article] [PubMed] [Google Scholar]
- 7.Qi AD, Kennedy C, Harden TK, Nicholas RA. Br J Pharmacol. 2001;132:318–326. doi: 10.1038/sj.bjp.0703788. [DOI] [PMC free article] [PubMed] [Google Scholar]
- 8.Hollopeter G, Jantzen HM, Vincent D, Li G, England L, Ramakrishnan V, Yang RB, Nurden P, Nurden A, Julius D, Conley PB. Nature. 2001;409:202–207. doi: 10.1038/35051599. [DOI] [PubMed] [Google Scholar]
- 9.Zhang FL, Luo L, Gustafson E, Lachowicz J, Smith M, Qiao X, Liu YH, Chen G, Pramanik B, Laz TM, Palmer K, Bayne M, Monsma FJ., Jr J Biol Chem. 2001;276:8608–8615. doi: 10.1074/jbc.M009718200. [DOI] [PubMed] [Google Scholar]
- 10.Takasaki J, Kamohara M, Saito T, Matsumoto M, Matsumoto S, Ohishi T, Soga T, Matsushime H, Furuichi K. Mol Pharmacol. 2001;60:432–439. [PubMed] [Google Scholar]
- 11.Foster CJ, Prosser DM, Agans JM, Zhai Y, Smith MD, Lachowicz JE, Zhang FL, Gustafson E, Monsma FJ, Jr, Wiekowski MT, Abbondanzo SJ, Cook DN, Bayne ML, Lira SA, Chintala MS. J Clin Invest. 2001;107:1591–1598. doi: 10.1172/JCI12242. [DOI] [PMC free article] [PubMed] [Google Scholar]
- 12.Communi D, Gonzalez NS, Detheux M, Brezillon S, Lannoy V, Parmentier M, Boeynaems JM. J Biol Chem. 2001;276:41479–41485. doi: 10.1074/jbc.M105912200. [DOI] [PubMed] [Google Scholar]
- 13.Chambers JK, Macdonald LE, Sarau HM, Ames RS, Freeman K, Foley JJ, Zhu Y, McLaughlin MM, Murdock P, McMillan L, Trill J, Swift A, Aiyar N, Taylor P, Vawter L, Naheed S, Szekeres P, Hervieu G, Scott C, Watson JM, Murphy AJ, Duzic E, Klein C, Bergsma DJ, Wilson S, Livi GP. J Biol Chem. 2000;275:10767–10771. doi: 10.1074/jbc.275.15.10767. [DOI] [PubMed] [Google Scholar]
- 14.Li Q, Olesky M, Palmer RK, Harden TK, Nicholas RA. Mol Pharmacol. 1998;54:541–546. doi: 10.1124/mol.54.3.541. [DOI] [PubMed] [Google Scholar]
- 15.Zambon AC, Brunton LL, Barrett KE, Hughes RJ, Torres B, Insel PA. Mol Pharmacol. 2001;60:26–35. doi: 10.1124/mol.60.1.26. [DOI] [PubMed] [Google Scholar]
- 16.Qi AD, Zambon AC, Insel PA, Nicholas RA. Mol Pharmacol. 2001;60:1375–1382. doi: 10.1124/mol.60.6.1375. [DOI] [PubMed] [Google Scholar]
- 17.Kennedy C, Qi AD, Herold CL, Harden TK, Nicholas RA. Mol Pharmacol. 2000;57:926–931. [PubMed] [Google Scholar]
- 18.Ho SN, Hunt HD, Horton RM, Pullen JK, Pease LR. Gene (Amst) 1989;77:51–59. doi: 10.1016/0378-1119(89)90358-2. [DOI] [PubMed] [Google Scholar]
- 19.Miller AD, Rosman GJ. BioTechniques. 1989;7:980–982. 984–986, 989. [PMC free article] [PubMed] [Google Scholar]
- 20.Schachter JB, Boyer JL, Li Q, Nicholas RA, Harden TK. Br J Pharmacol. 1997;122:1021–1024. doi: 10.1038/sj.bjp.0701479. [DOI] [PMC free article] [PubMed] [Google Scholar]
- 21.Ali H, Richardson RM, Tomhave ED, DuBose RA, Haribabu B, Snyderman R. J Biol Chem. 1994;269:24557–24563. [PubMed] [Google Scholar]
- 22.Comstock KE, Watson NF, Olsen JC. In: Methods in Molecular Biology: Recombinant Gene Expression Protocols. Tuan R, editor. Vol. 62. Humana Press; Totowa, NJ: 1997. pp. 207–222. [DOI] [PubMed] [Google Scholar]
- 23.Schachter JB, Li Q, Boyer JL, Nicholas RA, Harden TK. Br J Pharmacol. 1996;118:167–173. doi: 10.1111/j.1476-5381.1996.tb15381.x. [DOI] [PMC free article] [PubMed] [Google Scholar]
- 24.Jiang Q, Guo D, Lee BX, VanRhee AM, Kim YC, Nicholas RA, Harden TK, Jacobson KA. Mol Pharmacol. 1997;52:499–507. doi: 10.1124/mol.52.3.499. [DOI] [PMC free article] [PubMed] [Google Scholar]
- 25.Hoffmann C, Moro S, Nicholas RA, Harden TK, Jacobson KA. J Biol Chem. 1999;274:14639–14647. doi: 10.1074/jbc.274.21.14639. [DOI] [PMC free article] [PubMed] [Google Scholar]
- 26.Erb L, Garrad R, Wang Y, Quinn T, Turner JT, Weisman GA. J Biol Chem. 1995;270:4185–4188. doi: 10.1074/jbc.270.9.4185. [DOI] [PubMed] [Google Scholar]
- 27.Dixon RAF, Sigal IS, Rands E, Register RB, Candelore MR, Blake AD, Strader CD. Nature. 1987;326:73–77. doi: 10.1038/326073a0. [DOI] [PubMed] [Google Scholar]
- 28.Ostrowski J, Kjelsberg MA, Caron MG, Lefkowitz RJ. Annu Rev Pharmacol Toxicol. 1992;32:167–183. doi: 10.1146/annurev.pa.32.040192.001123. [DOI] [PubMed] [Google Scholar]
- 29.Lustig KD, Shiau AK, Brake AJ, Julius D. Proc Natl Acad Sci U S A. 1993;90:5113–5117. doi: 10.1073/pnas.90.11.5113. [DOI] [PMC free article] [PubMed] [Google Scholar]
- 30.Van Rhee AM, Fischer B, Van Galen PJ, Jacobson KA. Drug Des Discov. 1995;13:133–154. [PMC free article] [PubMed] [Google Scholar]
- 31.Berthold M, Bartfai T. Neurochem Res. 1997;22:1023–1031. doi: 10.1023/a:1022483027858. [DOI] [PubMed] [Google Scholar]
- 32.Samama P, Cotecchia S, Costa T, Lefkowitz RJ. J Biol Chem. 1993;268:4625–4636. [PubMed] [Google Scholar]
- 33.Kenakin T. Pharmacol Rev. 1996;48:413–463. [PubMed] [Google Scholar]
- 34.Palczewski K, Kumasaka T, Hori T, Behnke CA, Motoshima H, Fox BA, Le Trong I, Teller DC, Okada T, Stenkamp RE, Yamamoto M, Miyano M. Science. 2000;289:739–745. doi: 10.1126/science.289.5480.739. [DOI] [PubMed] [Google Scholar]
- 35.Archer E, Maigret B, Escrieut C, Pradayrol L, Fourmy D. Trends Pharmacol Sci. 2003;24:36–40. doi: 10.1016/s0165-6147(02)00009-3. [DOI] [PubMed] [Google Scholar]
- 36.Cotecchia S, Exum S, Caron MG, Lefkowitz RJ. Proc Natl Acad Sci U S A. 1990;87:2896–2900. doi: 10.1073/pnas.87.8.2896. [DOI] [PMC free article] [PubMed] [Google Scholar]
- 37.Whistler JL, Gerber BO, Meng EC, Baranski TJ, von Zastrow M, Bourne HR. Traffic. 2002;3:866–877. doi: 10.1034/j.1600-0854.2002.31203.x. [DOI] [PubMed] [Google Scholar]
- 38.Parnot C, Miserey-Lenkei S, Bardin S, Corvol P, Clauser E. Trends Endocrinol Metab. 2002;13:336–343. doi: 10.1016/s1043-2760(02)00628-8. [DOI] [PubMed] [Google Scholar]
- 39.Parnot C, Bardin S, Miserey-Lenkei S, Guedin D, Corvol P, Clauser E. Proc Natl Acad Sci U S A. 2000;97:7615–7620. doi: 10.1073/pnas.110142297. [DOI] [PMC free article] [PubMed] [Google Scholar]
- 40.Brown EM. Am J Med. 1999;106:238–253. [PubMed] [Google Scholar]
- 41.Hung LW, Wang IX, Nikaido K, Liu PQ, Ames GF, Kim SH. Nature. 1998;396:703–707. doi: 10.1038/25393. [DOI] [PubMed] [Google Scholar]