Abstract
Mitochondria-mediated production of reactive oxygen species (ROS) plays a key role in apoptosis. Mitochondrial phospholipid cardiolipin molecules are likely the main target of ROS because they are particularly rich in polyunsaturated fatty acids. They are also located in the inner mitochondrial membrane near the ROS-producing sites. Under physiological conditions mitochondria can repair peroxidative damage in part through a remodeling mechanism via the deacylation-reacylation cycle mediated by phospholipase A2 (PLA2) and acyl-coenzyme A-dependent monolysocardiolipin acyltransferase. Here we investigate whether group VIA Ca2+-independent PLA2 (iPLA2) plays a role in the protection of mitochondrial function from damage caused by mitochondrially generated ROS during apoptotic induction by staurosporine (STS). We show that iPLA2-expressing cells were relatively resistant to STS-induced apoptosis. iPLA2 localized to mitochondria even before apoptotic induction, and most iPLA2-associated mitochondria were intact in apoptotic resistant cells. Expression of iPLA2 in INS-1 cells prevented the loss of mitochondrial membrane potential, attenuated the release of cytochrome c, Smac/DIABLO, and apoptosis inducing factor from mitochondria, and reduced mitochondrial reactive oxygen species production. Inhibition of caspase 8 has little effect on STS-induced apoptosis in INS-1 cells. Finally, we found that STS down-regulated endogenous iPLA2 transcription in both INS-1 and iPLA2-expressing INS-1 cells without affecting the expression of group IV Ca2+-dependent PLA2. Together, our data indicate that iPLA2 is important for the protection of mitochondrial function from oxidative damage during apoptotic induction. Down-regulation of endogenous iPLA2 by STS may result in the loss of mitochondrial membrane repair functions and lead to mitochondrial failure and apoptosis.
Mitochondria play a central role in the control of apoptosis (1, 2). Apoptotic induction triggers the permeabilization of the outer mitochondrial membrane and the release of cytochrome c, which interacts with and causes the oligomerization of monomeric apoptotic protease activating factor-1 (Apaf-1) and the subsequent recruitment of caspase-9 to form the apoptosome (3). Activated caspase-9 then cleaves and activates downstream caspases to amplify the death process (4).
Mitochondria are also considered to be the most important cellular source of reactive oxygen species (ROS)2 (5). Some ROS, such as superoxide or hydroxyl radicals (·OH), are extremely unstable, whereas others, such as hydrogen peroxide (H2O2), are freely diffusible and relatively long-lived. If not adequately neutralized, ROS can damage cells by promoting DNA fragmentation, sulfhydryl-mediated protein cross-linking, and peroxidation of membrane phospholipids.
Peroxidation of membrane phospholipids is a major mechanism of ROS attack. Phospholipids, the major building blocks of membranes, are essential for cell life. They are rich in polyunsaturated fatty acids and vulnerable to attack by ROS (6, 7). It is well known that peroxidation of membrane phospholipids alters membrane fluidity, ion permeability, surface charge, passive electric properties, membranous enzyme activity, and cell signaling (6, 8). The inner membrane of mitochondria contains a high proportion of the “double” phospholipid cardiolipin, which is particularly rich in unsaturated fatty acids and, thus, particularly susceptible to ROS attack (9). Indeed, cardiolipin peroxidation in mitochondria has been suggested to play a role in the initiation of the apoptotic signal (10-12).
Fortunately, cells can selectively cleave and replace peroxidized fatty acid residues with native fatty acids (8). Because the polyunsaturated fatty acids in membrane phospholipids tend to be located in the sn-2 position, it is likely that members of the phospholipase A2 (PLA2) group of enzymes, which share the ability to hydrolyze fatty acids at sn-2 (13, 14), are involved in this repair activity (7, 8, 15). Indeed, PLA2 and acyl-coenzyme A-dependent monolysocardiolipin acyltransferase mediate the rapid remodeling of cardiolipin molecules via the deacylation-reacylation cycle in isolated rat liver and heart mitochondria (16-19).
Among the intracellular PLA, group VI Ca2+-independent PLA2 (iPLA2), also known as iPLA2β, has been found to participate in ongoing membrane phospholipid remodeling and repair via a cycle of deacylation-reacylation (20, 21). It is also present in rabbit heart mitochondria inner membranes (22). It is possible that the iPLA2-mediated remodeling and repair of membrane phospholipids plays a role in protecting mitochondrial membranes from peroxidative damage.
Staurosporine (STS), a potent protein kinase C inhibitor with a broad spectrum of activity (23), is known to induce apoptosis through a mitochondria-mediated pathway (24) and to cause oxidative stress through mitochondrially generated ROS in a variety cells (25, 26). This stress, which can be blocked by Bcl-2 (25) and antioxidants (27-29), causes peroxidation of membrane phospholipids, including mitochondrial cardiolipin (12, 26, 28, 30).
Therefore, STS-induced apoptosis is a useful model for the study of the effects of mitochondrially generated ROS on membrane phospholipid peroxidation. In the present study we use this model to investigate the role of iPLA2-mediated phospholipid repair of oxidatively damaged mitochondrial membranes during apoptosis in rat insulinoma INS-1.
EXPERIMENTAL PROCEDURES
Cells and Transfection
Rat insulinoma INS-1 cells or CHO cells were cultured as described previously (31-34). Stable expression of iPLA2 in an INS-1 cell line (iPLA2-INS) was previously established using the retroviral vector pMSCVneo (Clontech, Palo Alto, CA) containing iPLA2 cDNA downstream of a 5′ long terminal repeat from the PCMV virus as described (31, 35, 36). For expression of iPLA2, we used the expression vector pcDNA3-iPLA2 to transfect the cells with a FuGENE 6 transfection reagent (Roche Applied Science) as described (34). For expression of iPLA2-GFP fusion protein, the expression vector pEGFP-N2-iPLA2 was constructed by subcloning fulllength rat iPLA2 cDNA in-frame upstream of the GFP cassette in the pEGFP-N2 vector (Clontech). Transfected cells stably expressing iPLA2-GFP were selected with G418 (active concentration, 400 μg/ml).
Detection of Apoptosis
Apoptosis was induced by treating the cells with STS (Sigma), actinomycin D, etoposide, camptothecin (CHEMICON International, Inc.), or H2O2 (Promega). Multiple methods were used to detect apoptosis. For detection of phosphatidylserine (PS) externalization by flow cytometry, an annexin V-FLUOS staining kit (Roche Applied Science) was used to stain cells with fluorescent isothiocyanate-conjugated annexin V and propidium iodide (PI) according to the manufacturer’s protocol. Briefly, ∼106 cells were harvested, washed with PBS by centrifugation at 200 × g for 5 min, and resuspended in 100 μl of annexin V-FLUOS labeling solution containing annexin V and PI. Cells were incubated for 10-15 min at 15-25 °C and immediately analyzed by flow cytometry on a BD Biosciences FACSCalibur (34). PS externalization is a unique marker for apoptosis. Combined staining with annexin V and PI can be used to determine the early and late apoptosis. Cells were considered early apoptotic when they were annexin V-positive and PI-negative and late-apoptotic when they were both annexin V- and PI-positive. For detection of DNA fragmentation, fragmentized DNA was purified using the apoptotic DNA ladder kit (Roche Applied Science) and analyzed by electrophoresis in 1% agarose gel with ethidium bromide staining.
Measurement of Caspase Activity
For determination of caspase 3 activity, cells were pretreated with or without 20 μM Z-DEVD-FMK (BD Biosciences), a caspase 3 specific inhibitor, or 20 μM Z-IETD-FMK (BD Biosciences), a caspase 8 specific inhibitor, and followed by apoptotic induction. Then the cells were counted with hemacytometer. 106 cells were resuspended in cell lysis buffer (Promega, Madison, WI) and analyzed with the CaspACE Assay System Colorimetric (Promega) according to the manufacturer’s protocol.
Western Blot Analysis
The cytosol and mitochondrial fractions of cells were obtained with mitochondria/cytosol fractionation kit following the manufacturer’s protocol (BioVIsion, Mountain View, CA). The protein concentration of the supernatant was determined by Bradford assay using bovine serum albumin as the standard. Aliquots (containing 60 μg for cytoplasmic fraction or 15 μg for mitochondrial fraction) were separated by SDS-PAGE, transferred to nitrocellulose, blotted with corresponding antibodies, and detected by ECL WESTERN blotting detection system (Amersham Biosciences). AntiiPLA2, anti-cPLA2, anti-cytochrome c, anti-Smac/DIABLO, anti-AIF, anti-actin antibodies (Santa Cruz), and anti-histone H4 (Upstate, Waltham, MA) antibodies were used.
Confocal Microscopy
Confocal fluorescence microscopy was performed using a Zeiss LSM 510 META confocal laser scanning microscope (Carl Zeiss MicroImaging, Inc. Thornwood, NY). INS-1 cells were transfected with pEGFP-N2-iPLA2 construct and grown on cover slides. After induction of apoptosis, the cells were incubated in 50 nM Mito-Tracker Red CMXRos (Molecular Probes) for 15 min, washed with PBS, fixed in 3.8% paraformaldehyde (Fisher), and stained with 300 nM 4′,6-diamidino-2-phenylindole (Molecular Probes). The samples were embedded in Vectashield Mounting Medium H-1000 (Vector Laboratories, Burlingame, CA) and analyzed on a Zeiss LSM 510 META confocal laser-scanning microscope.
Measurement of Mitochondrial Membrane Potential
Mitochondrial membrane potentials were determined by the JC-1 (5,5′,6,6′-tetrachloro-1,1′,3,3′-tetraethylbenzimidazolylcarbocyanine) mitochondrial membrane potential detection kit according to the manufacturer’s protocol (Cell Technology, Mountain View, CA). Briefly, after induction of apoptosis, cells were washed with PBS and labeled with the JC-1 reagent for 15 min. After washing, the mitochondrial membrane potential was measured on a BD Biosciences FACSCalibur flow cytometer. Mitochondria containing red JC-1 aggregates in healthy cells were detectable in the FL2 channel, and green JC-1 monomers in apoptotic cells were detectable in the fluorescein isothiocyanate channel. The loss of mitochondrial membrane potential was calculated as the percentage of green cells versus total cells.
Measurement of Mitochondrial Generation of ROS
Intramitochondrial generation of superoxide was determined by the superoxide-induced conversion of the superoxide-sensitive dye, dihydroethidium (HE) to the highly fluorescent ethidium (37, 38). Briefly, after the treatment of STS, cells were stained with 2 μM HE (Molecular Probes) at 37 °C for 15 min. The cells were collected by trypsinization, washed once with PBS, and analyzed on a BD Biosciences FACSCalibur. Data were visualized using Windows Multiple Document Interface (WinMDI) (Joseph Trotter, Salk Institute for Biological Studies, La Jolla, CA) or FlowJo (Tree Star, Inc., Ashland, OR) flowcytometry software. Values were expressed as a percentage of total cell counts.
Measurement of Lipid Peroxidation
The Oxltek TBARS assay kit (Zep to Metrix) was used to assess lipid peroxidation according to the manufacturer’s protocol. Briefly, samples of cell suspension were separated into aliquots, and 2.5 ml of trichloroacetic acid/TBARS reagent was added. Each sample was incubated at 95 °C for 60 min. Supernatants were analyzed by a spectrophotometer at 532 nm, and values were expressed as a percentage of values in controls.
iPLA2 Activity Assay
iPLA2 activity was determined using a modified kit originally designed for cytosolic Ca2+-dependent PLA2 (cPLA2) (cPLA2 assay kit, Cayman Chemicals) as described (33, 39). Briefly, after specific treatments, cultured cells were collected and homogenized in buffer (50 mM Hepes, pH 7.4, and 1 mM EDTA) followed by centrifugation at 14,000 × g for 20 min at 4 °C. The supernatant was removed, and the protein concentration was determined. iPLA2 activity was assayed by incubating the samples with arachidonoyl thio-PC for 1h at 25°C in Ca2+-free buffer (4 mM EGTA, 160 mM Hepes, pH 7.4, 300 mM NaCl, 8 mM Triton X-100, 60% glycerol, and 2 mg/ml bovine serum albumin). The reaction was stopped by the addition of 5,5′-dithiobis(nitrobenzoic acid) for 5 min, and absorbance was determined at 414 nm using a μQuant microplate reader (BIO-TEK Instruments, Inc., Winooski, VT). The specific activity of iPLA2 was calculated and expressed in nmol/min/mg of total proteins. The background basal lipase activity, which was determined by inhibiting all specific iPLA2 activity in control samples with bromo-enol lactone (BEL), was subtracted from all readings as described (33, 39).
Isolation of RNA and RT-PCR Analysis
Total RNA was isolated from INS-1 cells using the RNeasy Mini Kit (Qiagen, Valencia, CA). RT-PCRs were performed using the Qiagen OneStep RT-PCR Kit (Qiagen), and the RT-PCR products were analyzed by electrophoresis in a 1% agarose gel with ethidium bromide staining. Primers for amplification of a fragment (505 bp) of rat iPLA2 were sense (5′-ATGCAGTTCTTTGGACGC-3′) and antisense (5′-CCAGAATCTCACTGTCAC-3′) and for amplification of rat glyceraldehyde-3-phosphate dehydrogenase were sense (5′-TGTCAGCAATGCATCCTG-3′) and antisense (5′-AACACGGAAGGCCATGCC-3′).
Statistical Analysis
Data were expressed as the mean ± S.D. The statistical significance of differences was analyzed using Student’s t test, where p < 0.05 was considered significant.
RESULTS
iPLA2 Protects Cells from Mitochondrial Stress-induced Apoptosis
STS has previously been shown to induce apoptosis (24), mitochondrial superoxide generation (25), and membrane phospholipid peroxidation (26, 28, 30). To verify these findings in rat insulinoma INS-1 cells, we treated INS-1 cells with 1 μM STS and analyzed for apoptosis by flow cytometry after staining with annexin V-FLUOS (Fig. 1A). We also used HE staining to assess mitochondrial superoxide generation (Fig. 1B) and the TBARS assay to measure lipid peroxidation levels (Fig. 1C) in these cells. As in other cells, STS induced both early (annexin V-positive and PI-negative cells) and late apoptosis (annexin V- and PI-positive cells) in INS-1 cells as well as mitochondrial ROS production and membrane lipid peroxidation.
FIGURE 1.
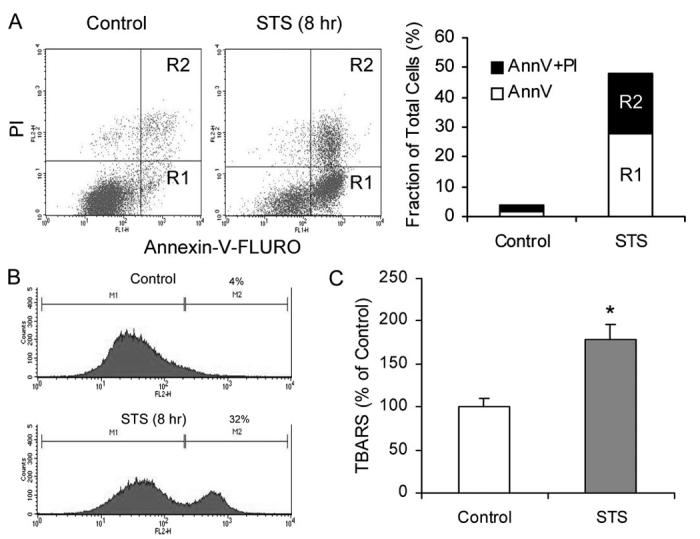
STS induces apoptosis, mitochondrial ROS generation, and membrane lipid peroxidation in INS-1 cells. A, FACS analysis of apoptosis as indicated by PS externalization. INS-1 cells were treated with or without 1 μM STS for 8 h. Cells were collected and stained with an annexin V (AnnV )-FLUOS labeling solution containing annexin V and PI, analyzed by FACS (left panel ), and results are summarized (right panel). R1 represents annexin V-positive and PI-negative cells, and R2 represents annexin V- and PI-positive cells. B, mitochondrial ROS production. Cells were collected and stained with 2 μM HE and analyzed on a BD Biosciences FACSCalibur. Representative histograms obtained are presented. The left histogram shows autofluorescence, and the right histogram shows cells containing converted HE. C, membrane lipid peroxidation. Cells were collected and treated with trichloroacetic acid/TBARS reagent. Each sample was incubated at 95 °C for 60 min. The supernatants were analyzed, and values are expressed as a percentage of control values. Data are the averages ± S.D. (n = 4). *, p < 0.05.
To investigate the role of iPLA2 in apoptosis induced by mitochondrially generated ROS, we compared the effect of STS on INS-1 cells with its effect on INS-1 cells stably expressing iPLA2 (iPLA2-INS) (31, 35). We first rigorously analyzed the time course of STS-induced apoptosis in each cell line using annexin V labeling followed by flow cytometric analysis. As shown in Fig. 2, iPLA2-INS cells were relatively resistant to STS-induced apoptosis compared with parental INS-1 cells. We found that the peak of early apoptosis (annexin V-positive and PI-negative) occurred between 8 to 12 h in both cell lines, and many of these cells progressed into late apoptosis (annexin V- and PI-positive) (Fig. 2A). However, in contrast to the INS-1 cells, which were nearly all dead 36 h after STS treatment, about 40% of iPLA2-INS cells remained alive (Fig. 2B), and many cells were still in early apoptosis after the same amount of time (Fig. 2A). These results clearly show that although STS induces a considerable amount of cell death in iPLA2-INS cells, their apoptotic progression is significantly delayed in comparison to INS-1 cells.
FIGURE 2.
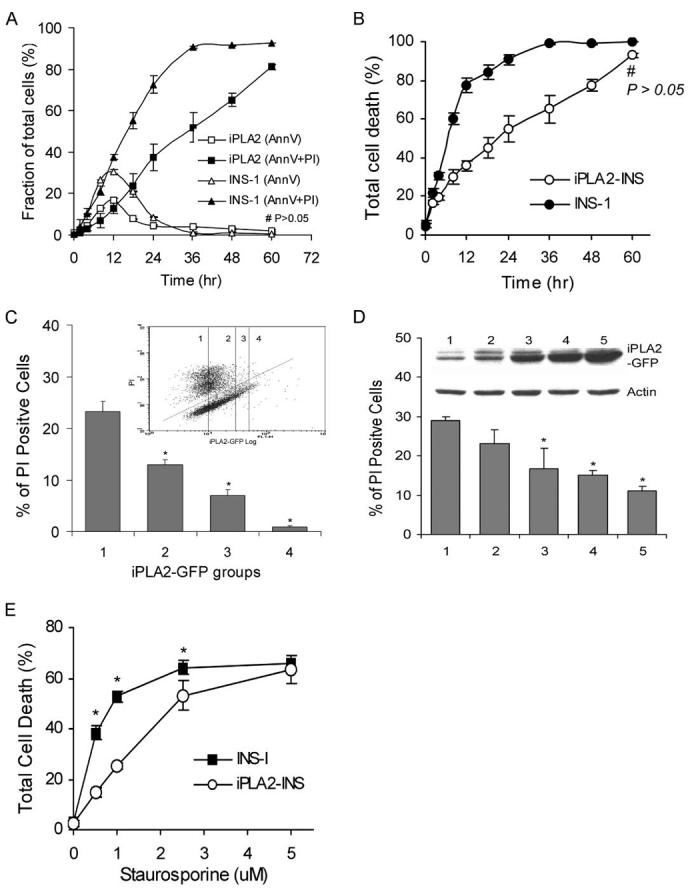
Comparison of STS-induced apoptosis in INS-1 and iPLA2-INS cells. A, time course of STS-induced early (annexin V-positive and PI-negative) and late (annexin V- and PI-positive) apoptosis in INS-1 (triangles) and iPLA2-INS cells (squares). B, total cell death (all annexin V-positive cells). INS-1 and iPLA2-INS cells were treated with 1 μM STS for increasing amounts of time. Cells were collected and stained with an annexin V-FLUOS labeling solution and analyzed by FACS. Data are the averages ± S.D. (n = 6). #, p > 0.05. All others were statistically significant. C, FACS analysis of cell death among cells with varying levels of iPLA2-GFP fusion protein. INS-1 cells were transiently transfected with iPLA2-GFP construct. After 48 h, the cells were treated with STS for 8 h, stained with PI alone, and subjected to FACS analysis (inset). Group 1 corresponds to non-transfected cells; group 2 are cells exhibiting a 1-2-fold increase in iPLA2-GFP; group 3 are cells exhibiting a 3-4-fold increase of iPLA2-GFP; group 4 are cells with a greater than 4-fold increase. Cells under the line are living, and those above are dead. The percentage of PI-positive cells in each group is displayed. Data are the averages ± S.D. (n = 4). *, compared with group 1, p < 0.05. D, STS-induced apoptosis in cell lines stably expressing iPLA2-GFP. INS-1 cells were transfected with iPLA2-GFP construct and selected with G418 after 48 h. Individual G418-resistant colonies were picked, and iPLA2-GFP expression was analyzed with anti-GFP antibodies (inner panel). Five cell lines with increasing levels of iPLA2-GFP expression were treated with STS for 8 h, stained with PI alone, and analyzed by FACS. Data are the averages ± S.D. (n = 3). *, compared with cell line 1, p < 0.05. E, Comparison of STS concentration-dependent apoptosis between INS-1 and iPLA2-INS cells. Data are the averages ± S.D. (n = 4). p < 0.05.
To evaluate whether the degree of apoptotic resistance correlates with the level of iPLA2 expression, we first analyzed the effect of iPLA2 on apoptosis in a population of cells. INS-1 cells were transfected with iPLA2-GFP, and apoptosis was induced with STS. After PI staining, cells were sorted via FACS using two gates, one for PI and one for GFP. After sorting, cells were divided into groups according to their levels of GFP expression (inset in Fig. 2C), and the extent of cell death within each group (PI-positive cells) was determined. As shown in Fig. 2C, groups with no or low levels of GFP expression exhibited the highest proportions of dead cells. As iPLA2-GFP fusion protein expression increased, the proportion of PI-positive cells in each group fell. These results suggest that resistance to STS-induced apoptosis is positively correlated with higher iPLA2 levels. To confirm this finding, we selected and expanded individual colonies expressing variable levels of iPLA2. Once again, as shown in Fig. 2D, as iPLA2 expression increased, the proportion of dead cells decreased.
To determine the extent of resistance of iPLA2-INS cells to apoptotic induction by STS, we treated both cell lines with increasing concentrations of STS for 8 h. As shown in Fig. 2E, when STS concentration was increased to 5 μM, we saw no significant difference in cell death levels between INS-1 cells and those expressing iPLA2, indicating that the stronger apoptotic induction overcame the protective function of iPLA2.
To confirm that iPLA2-INS cells were relatively resistant to STS-induced apoptosis, we also looked for the appearance of DNA ladders. DNA fragmentation was apparent in INS-1 within 4h of STS treatment and intensified with time. However, DNA fragmentation was significantly attenuated in iPLA2-INS cells (Fig. 3A).
FIGURE 3.
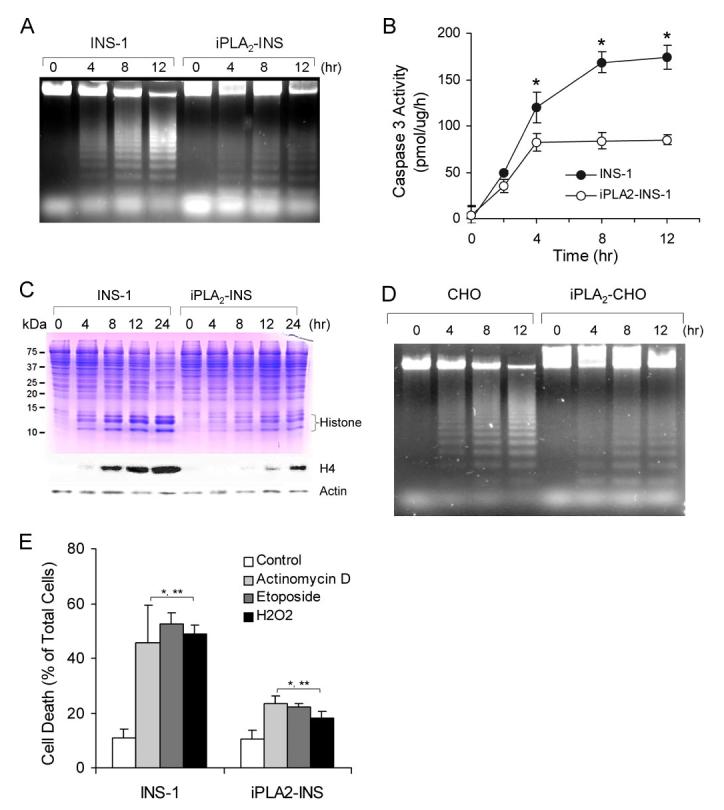
iPLA2 prevents apoptosis induced by mitochondrially generated superoxide. A, apoptotic DNA ladder analysis of INS-1 cells. After 1 μM STS treatment as in Fig. 1A, DNA was purified by an Apoptotic DNA ladder kit and analyzed on an agarose gel. B, comparison of caspase 3 activity between INS-1 and iPLA2-INS cells during STS-induced apoptosis. Caspase 3 activity was determined by a CaspACE assay system (n = 6). *, p < 0.05. C, accumulation of histones in the cytoplasm of the cells. After treatment with 1 μM STS for the indicated times, cytosol from both cell lines was prepared and analyzed by SDS-PAGE (upper) and Western blot for histone 4 (lower). D, apoptotic DNA ladder analysis in CHO cells. Mock-transfected CHO cells and CHO cells transfected with pcDNA3-iPLA2 were treated with 1 μM STS for the indicated times. The cells were collected, and DNA was prepared as in A and analyzed on an agarose gel. E, comparison of actinomycin D-, etoposide-, and H2O2-induced apoptosis between INS-1 and iPLA2-INS cells. Cells were treated with actinomycin D etoposide for 8 h and with H2O2 for 4 h. *, compared with control; **, compared between INS-1 and iPLA2-INS cells. p < 0.05.
We also compared STS-induced caspase-3 activation between the two cell lines (Fig. 3B). A difference in the degree of caspase 3 activation could be detected within 2h of STS treatment and became significant after 4 h. Although the activity increased prominently in a time-dependent manner in INS-1 cells, there was no significant increase in iPLA2-INS cells after 4 h, indicating that elevated levels of iPLA2 prevent the activation of caspase 3 in STS-induced apoptosis.
It has been reported that STS causes the release of histones into the cytoplasm during apoptosis (40). As shown in Fig. 3C, this release of histones from nucleosomes to cytoplasm was very prominent in INS-1 cells; they were evident on the Coomassie Blue-stained SDS-PAGE and reacted strongly with anti-histone H4 antibodies on the Western blot (Fig. 3C). Furthermore, the timing of histone release correlated well with the progression of apoptosis in the INS-1 cells. In contrast, many fewer histones were released in the iPLA2-INS cells in response to STS treatment. Taken together, our results unambiguously demonstrate that iPLA2 protects β-cells from apoptosis induced by mitochondrial stress.
To determine whether iPLA2 can also protect other types of cells from apoptosis, we transfected CHO cells with a pDNA3-iPLA2 construct. As a control, a separate group of CHO cells were mock-transfected. Both groups of cells were then treated with 1 μM STS. Similar to our results in INS-cells, DNA fragmentation in iPLA2-expressing CHO cells was also dramatically less than that seen in the control cells (Fig. 3C).
We next examined the effects of actinomycin D and etoposide, which are known to induce the mitochondrial production of ROS (41, 42). As shown in Fig. 3E, apoptosis induced by these reagents was significantly less pronounced in overexpressing iPLA2 INS-1 cells than in parental cells.
Because superoxide generated by mitochondria is dismutated to hydrogen peroxide (H2O2) by intramitochondrial manganese-superoxide dismutase (5), we next used annexin V staining to examine the effect of exogenously added H2O2 on the cell lines. As shown in Fig. 3E, treatment with 50 μM H2O2 for 4 h caused significant cell death in INS-1 cells but only mildly affected iPLA2-INS cells. H2O2 levels at or exceeding 200 μM resulted in cells that were both annexin V- and PI-positive, suggesting that high concentrations of H2O2 may either cause necrosis or facilitate an especially rapid transition from early to late apoptosis in the INS-1 cells. Finally, we observed no significant differences in cell death between parental cells and those overexpressing iPLA2 after long term (more than 20 h) exposure of the cells to H2O2.
iPLA2 Localizes in Mitochondria and Protects Mitochondria during Apoptotic Induction
Mitochondrial cardiolipin molecules reportedly undergo rapid remodeling via the deacylation-reacylation cycle, which in mitochondria is mediated by PLA2 and acyl-coenzyme A-dependent monolysocardiolipin acyltransferase (16-19). Because STS induces apoptosis through a mitochondria-mediated pathway (25) and because iPLA2-expressing cells were resistant to STS induction (Figs. 2 and 3), we hypothesized that iPLA2 mediates the deacylation of mitochondrial cardiolipin (16-19). Therefore, we investigated whether iPLA2 is associated with cellular mitochondria. INS-1 cells were transfected with a pEGFP-iPLA2 construct, incubated with Mito-Tracker Red CMXRos, and counterstained with 4′,6-diamidino-2-phenylindole before analysis with a laser scanning confocal microscope. Yellow staining of the mitochondria, resulting from the merging of the green and red signals, clearly indicates the co-localization of iPLA2 with mitochondria (Fig. 4A), consistent with a previous report indicating that iPLA2 was present in the inner membranes of rabbit heart mitochondria (22).
FIGURE 4.
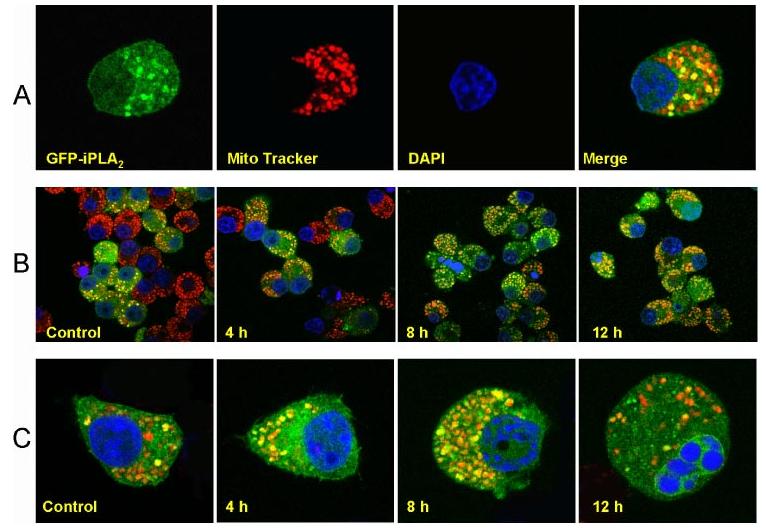
iPLA2 localizes to mitochondria. A, colocalization of iPLA2-GFP with mitochondria. pEGFP-iPLA2-transfected INS-1 cells were incubated for 15 min in Mito Tracker Red CMXRos, fixed with 3.8% paraformaldehyde, stained with 4′,6-diamidino-2-phenylindole, and analyzed on a Zeiss LSM 510 META confocal laser scanning microscope. Images of red (Mito Tracker) and green (iPLA2-GFP) fluorescence were collected by confocal microscopy. Colocalization of iPLA2-GFP with mitochondria appears as yellow to orange spots, depending on the ratio of the merged red and green fluorescence. B, resistance of cells expressing GFP-iPLA2 to STS-induced apoptosis. pEGFP-iPLA2-transfected INS-1 cells were treated with STS and incubated with Mito Tracker Red CMXrox as in A. The cells with green and yellow to orange dots are iPLA2-GFP-transfected INS-1 cells. Those with red color only are non-transfected cells. C, localization of iPLA2-GFP in mitochondria during STS-induced apoptosis in individual cells. Merged images of red (mitochondria) and green (iPLA2-GFP) fluorescence were collected by confocal microscopy. The images represent at least four independent experiments with similar results.
About 50% of cells in this experiment, corresponding closely to the transfection efficiency of the pEGFP-iPLA2 construct, expressed GFP-iPLA2. Most of their mitochondria were associated with iPLA2 in the absence of STS (see Control in Fig. 4B). Four hours after STS treatment, the ratio of the transfected (green) and non-transfected cells (red staining only) had not significantly changed. However, after 8-12 h of STS treatment, the proportion of green cells far exceeded the proportion of red cells (Fig. 4B), indicating most surviving cells expressed GFP-iPLA2. In addition, slightly more yellow dots were observed in the surviving cells, suggesting that further translocation of iPLA2 may have occurred during STS treatment.
We also carefully examined individual cells during STS-induced apoptosis. Most mitochondria were associated with iPLA2 after an induction time of 8h or less (Fig. 4C). A proportion of cells expressing GFP-iPLA2 underwent apoptosis, visualized by the alteration of chromatin, after 12 h of induction. Most of the mitochondria in these cells were not associated with iPLA2 (12 h, Fig. 4C). Our results demonstrate that iPLA2 localizes to mitochondria and protects them during apoptotic induction by STS.
Expression of iPLA2 in INS-1 Cells Prevents the Loss of Mitochondrial Membrane Potential
Alteration of mitochondrial membrane potential is an important early transition in the induction of apoptosis. During this process the electrochemical gradient across the mitochondrial membrane collapses. To determine whether iPLA2 can prevent the loss of mitochondrial membrane potential, we treated both INS-1 and iPLA2-INS cells simultaneously with STS for various lengths of time and measured the mitochondrial membrane potential with flow cytometry (Fig. 5, A and B). We detected a significant loss of mitochondrial membrane potential in INS-1 cells within 2 h after STS treatment, and membrane potential continued to decline as long as the STS treatment continued (Fig. 5B). However, no significant loss of mitochondrial membrane potential was detected in iPLA2-INS cells until 8 h after STS treatment. Similar results were observed when iPLA2 was overexpressed in CHO cells (Fig. 5C). These results demonstrate that iPLA2 prevents the loss of mitochondrial membrane potential during STS treatment.
FIGURE 5.
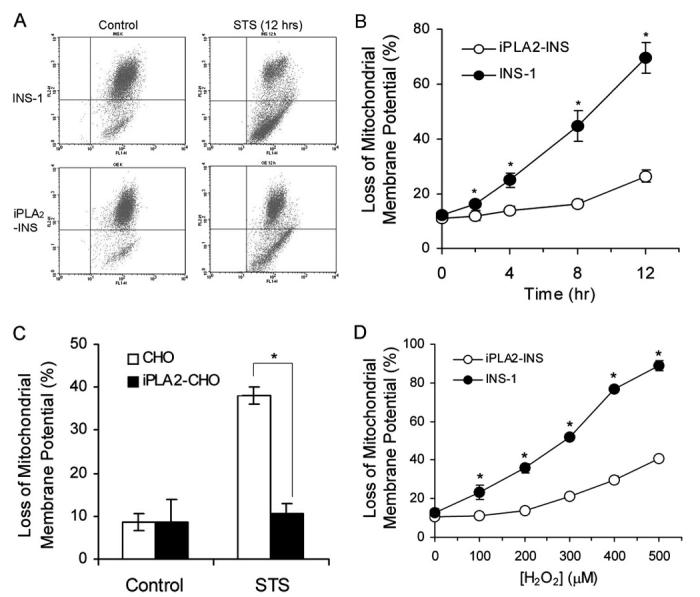
iPLA2 prevents the loss of mitochondrial membrane potential (ΔΨ). A, FACS analysis of the loss of mitochondrial membrane potential (ΔΨ). INS-1 and iPLA2-INS cells were treated with 1 μM STS for 12 h and labeled with JC-1 reagent for 15 min. After washing, JC-1-labeled cells were sorted by FACS. Cells under the horizontal line are the cells that lost the red color. B, time course of STS-induced the loss of mitochondrial membrane potential. INS-1 and iPLA2-INS cells were treated with 1 μM STS for increasing times and analyzed as in A. Values are expressed as a percentage of green versus total cells. Data are the averages ± S.D. (n = 6). *, p < 0.05. C, iPLA2 prevents the loss of mitochondrial membrane potential (ΔΨ) in CHO cells. CHO and iPLA2-CHO cells were treated with STS for 8 h. Data are the averages ± S.D. (n = 4). *, p < 0.05. D, iPLA2 prevents the loss of mitochondrial membrane potential (ΔΨ) after H2O2 treatment. INS-1 and iPLA2-INS cells were treated for 4 h with increasing concentrations of H2O2. Cells were then washed in PBS and labeled with JC-1. After washing, the cells were analyzed by flow cytometry. Data are the averages ± S.D. (n = 4). *, p < 0.05.
We further tested whether iPLA2 also prevents the loss of mitochondrial membrane potential induced by exogenously added H2O2. We treated both cell lines with increasing concentrations of H2O2 for 4 h and then measured mitochondrial membrane potentials as before. As shown in Fig. 5D, 100 μM H2O2 resulted in a significant loss of mitochondrial membrane potential in INS-1 cells. In contrast, iPLA2-INS cells did not begin to lose mitochondrial membrane potential until H2O2 levels surpassed 200 μM. About 90% of INS-1 cells, but only 40% of iPLA2-INS cells, lost mitochondrial membrane potential when H2O2 levels approached 500 μM. Thus, we conclude that expression of iPLA2 in INS-1 cells inhibits the loss of mitochondrial membrane potential in the early stages of H2O2 treatment.
Expression of iPLA2 in INS-1 Cells Attenuates Release of Apoptotic Proteins from Mitochondria
Because iPLA2 localizes to mitochondria, we examined whether it also prevents the release of cytochrome c from mitochondria. We treated INS-1 and iPLA2-INS cells with STS for various lengths of time and then prepared cytosolic and mitochondrial fractions for cytochrome c analysis by Western blot. As shown in Fig. 6A, mitochondrial levels of cytochrome c dropped significantly in INS-1 cells 4 h after STS treatment and continued to decrease with time. In contrast, cytochrome c levels in the mitochondria of iPLA2-INS cells decreased only moderately during the same time period. Although most cytochrome c was found in the cytoplasm of INS-1 cells 8 h after STS treatment, significant amounts could still be detected in the mitochondrial fraction of iPLA2-INS cells at this time. These results demonstrate that iPLA2 impedes the release of cytochrome c from the mitochondria to cytosol during the early stages of STS-induced apoptosis.
FIGURE 6.
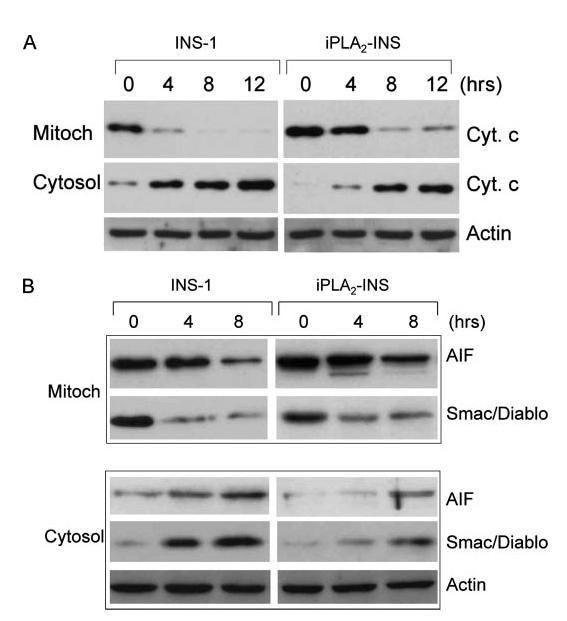
iPLA2 attenuates the release of cytochrome c, Smac/DIABLO, and AIF from mitochondria. A, effect of iPLA2 on cytochrome c in INS-1 cells. INS-1 and iPLA2-INS cells were treated with 1 μM STS for increasing times, and cytoplasmic (Cyt.) and mitochondrial (Mitoch) fractions were prepared with a mitochondria/cytosol fractionation kit. The samples from each fraction were analyzed by Western blot for cytochrome c. B, effect of iPLA2 on Smac/DIABLO and AIF in INS-1 cells. Samples were prepared analyzed as in A for Smac/DIABLO and AIF in both fractions.
In addition to cytochrome c, other mitochondrial proteins such as Smac/DIABLO, which promotes cytochrome c-dependent caspase activation by eliminating IAP inhibition (43), and apoptosis inducing factor (AIF), which induces chromatin condensation and large scale DNA fragmentation (44), are also released during apoptosis. We found that iPLA2 expression also attenuates the STS-induced release of these two factors (Fig. 6B).
iPLA2-INS Cells Produce Lower Levels of ROS than Do Parental INS-1 Cells in Response to STS Treatment
Because iPLA2 can protect mitochondrial function from ROS inducers or H2O2 treatment, we examined whether it affects the amount of ROS generated by mitochondria in response to STS. Interestingly, we found that iPLA2-INS cells had much lower levels of ROS production than did parental INS-1 cells after 8 h of STS treatment (Fig. 7). However, ROS production dropped sharply in INS-1 cells after 12 h (Fig. 7) when more than 75% of INS-1 cells were dying and losing mitochondrial membrane potential (Figs. 2 and Fig. 5B). Although it is possible that the mitochondria of the INS-1 cells completely fail at this time and are unable to produce any more ROS, our data suggest that iPLA2 protects mitochondrial function, reducing ROS production and delaying mitochondrial damage during apoptosis.
FIGURE 7.
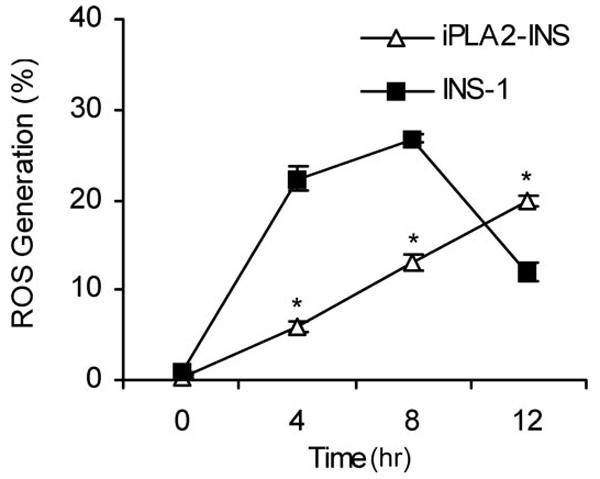
iPLA2 reduces STS-induced ROS production. INS-1 and iPLA2-INS cells were treated with 1 μM STS, collected, stained with 2 μM HE, and analyzed by FACS. Values are expressed as a percentage of total cell counts. Data are the averages ± S.D. (n = 4). *, p < 0.05.
Using a TBARS assay, we observed no significant reduction of total lipid peroxidation in iPLA2-INS cells compared with INS-1 cells after STS treatment. It has been demonstrated that STS induces the oxidation of two relatively minor anionic phospholipids, cardiolipin and PS, but not more abundant phospholipids like phosphatidylcholine and phosphatidylethanolamine (12, 45). The TBARS assay is not sensitive enough to detect differences in lipid peroxidation between the two cell lines.
Caspase 8 Activation Is Not Required for STS-induced Apoptosis of INS-1 Cells
Stimulation with some chemotherapeutic drugs leads to caspase 8 activation, which may serve as either an initiating or as a secondary event in apoptosis (46, 47). Activated caspase 8 either directly activates the executioner caspase, caspase 3 (48), or cleaves the BH3-only protein Bid to generate tBid (49). Activation of caspase 3 may also activate caspase 8 in an apoptotic feedback loop (50-52). To examine whether caspase 8 activation plays a role in STS-induced apoptosis in INS-1 cells, we treated the cells with both camptothecin, which induces apoptosis through activation of caspase 8 (53), and STS in the presence or absence of the caspase 8-specific inhibitor Z-IETD-FMK (52). We found that although camptothecin induced dramatic levels of cell death within 4h in untreated cells, its effect was essentially blocked when the cells were pretreated with Z-IETD-FMK (Fig. 8A). However, STS-induced apoptosis in INS-1 cells was not affected by treatment with Z-IETD-FMK (Fig. 8A).
FIGURE 8.
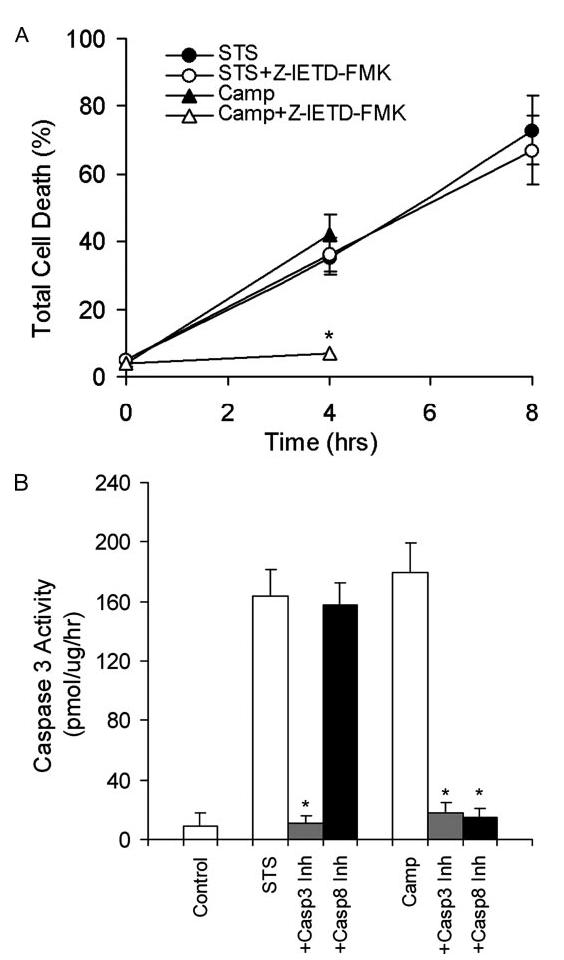
Caspase 8 is not required for STS-induced apoptosis in INS-1 cells. A, INS-1 cells were pretreated with or without 20 μM Z-IETD-FMK, a caspase 8-specific inhibitor, for 30 min before being treated with 1 μM STS or 5 μM camptothecin (Camp) for the indicated amounts of time. Cells were collected, stained with an annexin V-FLUOS labeling solution containing annexin V and PI, and analyzed by FACS. Values are expressed as a percentage of annexin V-positive versus total cells. Data are the averages ± S.D. (n = 4). *, p < 0.05. B, caspase 3 activation analysis. INS-1 cells were pretreated with caspase 3-specific inhibitor (Z-DEVD-FMK) and caspase 8-specific inhibitor (Z-IETD-FMK) and followed by STS or camptothecin treatment for 6 h. Caspase 3 activity was determined by a CaspACE assay system (n = 4). *, p < 0.05.
We further analyzed caspase 3 activation in the presence and absence of inhibitors specific for caspase 3 (Z-DEVD-FMK) or 8 (Z-IETD-FMK). We found that although the caspase 8-specific inhibitor completely inhibited camptothecin-induced caspase 3 activation, it did not affect STS-induced caspase 3 activation (Fig. 8B). These results indicate that, consistent with previous reports (46, 54), the mitochondrial amplification loop driven by caspases 3 and 8 is not required for STS-induced apoptosis.
cPLA2 Does Not Participate in STS-induced Apoptosis of INS-1 Cells
It has been reported that group IV cPLA2 participates in apoptosis induced by tumor necrosis factor and the divalent cation ionophore A23187 (55, 56). To evaluate whether cPLA2 activation is involved in STS-induced apoptosis in INS-1 cells, we pretreated INS-1 cells with the cPLA2-specific inhibitors methyl arachidonyl fluorophosphonate or arachidonyl trifluoromethyl ketone before STS treatment. Then cells were collected and analyzed for apoptosis with annexin V staining and flow cytometry. We found that neither arachidonyl fluorophosphonate (Fig. 9A) nor arachidonyl trifluoromethyl ketone (data not shown) affected STS-induced apoptosis. In contrast, pretreatment of INS-1 cells with the iPLA2-specific inhibitor BEL enhanced STS-induced apoptosis over time (Fig. 9B). We also did not detect any notable changes in either cell line in protein levels, post-translational modification (Fig. 9C), cPLA2 activity, or arachidonic acid release before or after STS treatment. Therefore, we conclude that neither cPLA2 nor arachidonic acid participate in STS-induced apoptosis.
FIGURE 9.
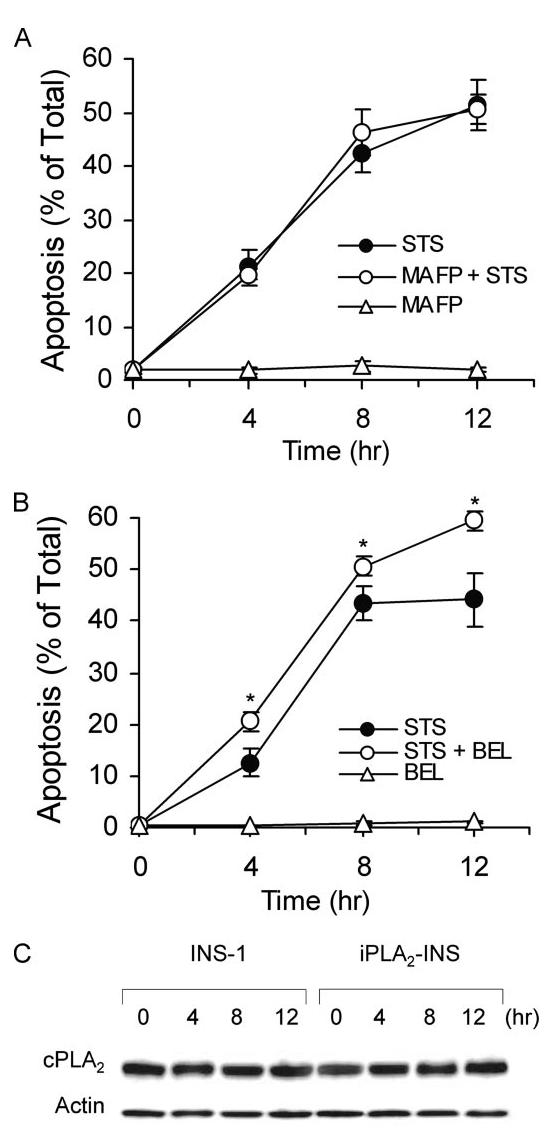
cPLA2 does not participate in STS-induced apoptosis. A, annexin V-FLUOS analysis of STS-induced apoptosis of INS-1 cells in the presence of a cPLA2 inhibitor. INS-1 cells were pretreated with 10 μM MAPF before treatment with 1 μM STS. Cells were collected, labeled with an annexin V-FLUOS labeling solution, and analyzed by flow cytometry. The data represent cells stained only by annexin V-FLUOS. Data are the averages ± S.D. (n = 6). MAFP, methyl arachidonyl fluorophosphonate. B, annexin V-FLUOS analysis of STS-induced apoptosis of INS-1 cell in the presence of the iPLA2 inhibitor BEL. INS-1 cells were pretreated with 10 μM BEL before treatment with 1 μM STS. Data are the averages ± S.D. (n = 6). *, p < 0.05. C, Western blot analysis of cPLA2 expression in INS-1 and iPLA2-INS cells during STS-induced apoptosis. Both INS-1 and iPLA2-INS cells were treated with 1 μM STS and collected at the indicated times. Cell lysates were prepared and analyzed by Western blot for cPLA2 and actin.
iPLA2 Is Transcriptionally Down-regulated in STS-induced Apoptosis
Because iPLA2 plays an important role in the protection of mitochondria during STS-induced apoptosis, we examined whether STS treatment affects iPLA2 expression in β-cells. INS-1 and iPLA2-INS cells were treated with STS for varying lengths of time, and lysates from both cells were analyzed for the presence of iPLA2 by Western blot. Interestingly, iPLA2 protein levels decreased in a time-dependent manner in INS-1 cells and were hardly detectible after 8 h of STS treatment (Fig. 10A). In contrast, iPLA2 levels in iPLA2-INS cells decreased during the first 4h of STS treatment but remained constant for the remainder of the experiment. Because the expression of recombinant iPLA2 in iPLA2-INS cells is driven by a promoter derived from the murine stem cell PCMV virus, this result suggests that STS down-regulates the transcription of endogenous iPLA2. In addition, we did not detect any truncated iPLA2 bands during STS treatment even though the anti-body we used (T-14, Santa Cruz) recognizes the C terminus of iPLA2. Finally, we found that iPLA2 activity coincided with its protein levels (Fig. 10B).
FIGURE 10.
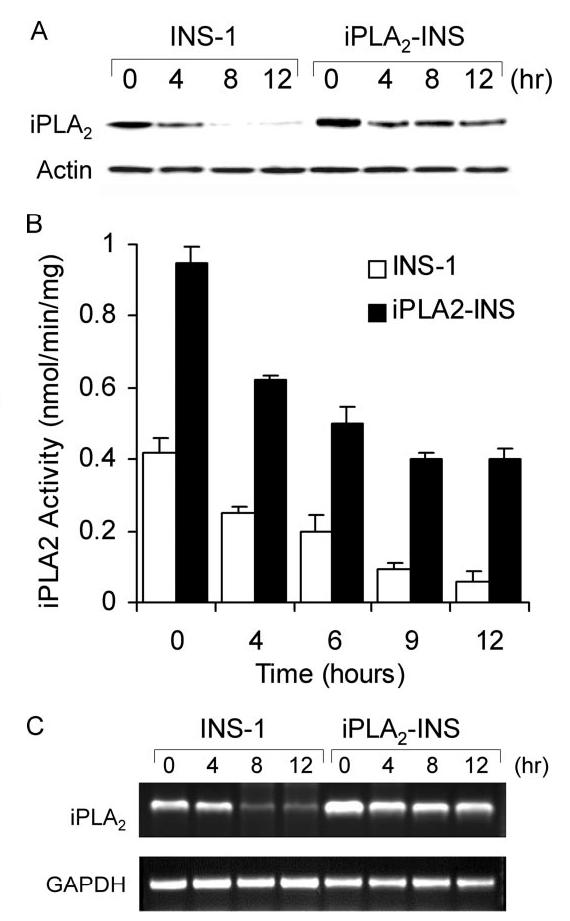
iPLA2 transcription is down-regulated in STS-induced apoptosis. A, Western blot analysis of iPLA2 expression during STS-induced apoptosis. INS-1 and iPLA2-INS cells were treated with 1 μM STS and harvested at the times indicated. Cell lysates were prepared and analyzed by Western blot for iPLA2 and actin. B, iPLA2 activity analysis. INS-1 and iPLA2-INS cells were treated with 1 μM STS and harvested at the times indicated. Cell lysates were prepared and analyzed for iPLA2 activity. Data are the averages ± S.D. (n = 4). p < 0.05, compared with 0 h and between INS-1 and iPLA2-INS cells. C, RT-PCR analysis of iPLA2 cDNA during STS induction. INS-1 and iPLA2-INS cells were treated with 1 μM STS and harvested at the times indicated. Total RNA was isolated from each sample, and aliquots were subjected to RT-PCR analysis for iPLA2 and glyceraldehyde-3-phosphate dehydrogenase (GAPDH), respectively.
To confirm that STS down-regulates iPLA2 transcription, we used RT-PCR to quantify iPLA2 mRNA levels after STS treatment. As shown in Fig. 10C, although endogenous iPLA2 mRNA in INS-1 cells disappeared with time, iPLA2 mRNA in the iPLA2-INS cells decreased during the first 4 h but remained constant for the remainder of the experiment. Our results suggest that STS not only induces oxidative stress leading to the peroxidation of mitochondrial membrane phospholipids but also impairs the repair system by down-regulating iPLA2 transcription.
DISCUSSION
It has been hypothesized that oxygen free radicals cause impaired membrane function primarily by peroxidizing membrane lipid components. The mitochondrial phospholipid cardiolipin has long been regarded as a target of this attack due to its particularly high polyunsaturated fatty acid content and its location in the inner mitochondrial membrane near the ROS-producing sites.
To keep mitochondrial membranes in optimal condition, cells must replace peroxidized residues with native fatty acids (8). It has been proposed that the consecutive action of PLA2 and phospholipid glutathione peroxidase are required to reduce phospholipid hydroperoxides in mitochondria under physiological conditions (57).
iPLA2 participates in ongoing membrane phospholipid remodeling via a cycle of deacylation and reacylation (20, 21). Although it is logical that iPLA2 may also play an important role in repairing peroxidized phospholipids, little is known about its biological significance in protecting mitochondrial membranes from this type of damage. In this study, we used STS to induce mitochondrial ROS production in rat insulinoma INS-1 cells. We demonstrated for the first time that iPLA2 can prevent mitochondrially generated ROS-induced apoptosis, as evidenced by decreased PS externalization, caspase-3 activity, DNA fragmentation, and histone release from nucleosomes.
Mitochondrial cardiolipin is distinguished from other phospholipids by an abundance of linoleoyl molecular species (58). In fact, 70% of the fatty acids in mitochondrial cardiolipin in rat islets are linoleic acid (59). It is likely that linoleate enrichment occurs as a result of cardiolipin remodeling, since cardiolipin synthesis shows no preference for the various molecular species of CDP-diacylglycerol (58). Incorporation of [14C]glycerol 3-phosphate into cardiolipin metabolites is accompanied by the formation of lysocardiolipin, suggesting a rapid deacylation of newly formed [14C]cardiolipin by PLA2 (16). Monolysocardiolipin acyltransferase, which mediates reacylation by lioleoyl-coenzyme A, exhibits a preference for unsaturated acyl-coenzyme A substrates (17).
Although PLA2 activity has been characterized in mitochondria, it’s not known which specific subfamily is involved in cardiolipin remodeling. Our data indicating that iPLA2 co-localizes with mitochondria, together with a previous report that iPLA2 is present in rabbit heart mitochondrial inner membranes (22), suggest that iPLA2 plays a key role in the mediation of cardiolipin deacylation and the repair of mitochondrial membranes. iPLA2 expression in INS-1 cells prevents the loss of mitochondrial membrane potential and attenuates the release of cytochrome c, Smac/DIABLO, and AIF from mitochondria to cytosol. Furthermore, this protection of mitochondria by iPLA2 results in a feedback loop that reduces mitochondrial ROS production.
The release of cytochrome c from mitochondria is a central event in the induction of apoptosis (60). This release appears to be initiated by cardiolipin oxidation (12, 61). Recent findings indicate that cytochrome c extrusion occurs as a two-step process; dissociation of cytochrome c from cardiolipin on the inner mitochondrial membrane (62), induced by the peroxidation of cardiolipin by mitochondrially generated ROS (63, 64), and release of the solubilized pool of cytochrome c after permeabilization of the outer mitochondrial membrane, regulated mainly by the Bcl-2 family (2). Neither disrupting the interaction of cytochrome c with cardiolipin nor permeabilizing the outer membrane with Bax alone is sufficient to trigger this proteins release (62). Our data show that expression of iPLA2 in INS-1 cells prevents the loss of mitochondrial membrane potential more significantly than cytochrome c release into the cytosol. This suggests that iPLA2-mediated phospholipid remodeling and repair help cells eliminate peroxidized fatty acids from mitochondrial inner membranes, which may prevent the dissociation of cytochrome c from cardiolipin but not the release of solubilized pool of cytochrome c into the extra mitochondrial environment through mitochondrial outer membrane permeabilization (2). The fact that iPLA2 localizes to mitochondria before STS treatment indicates that mitigating the peroxidative damage of mitochondrial inner membranes is an intrinsic physiological function of iPLA2.
It is somewhat surprising that STS down-regulates iPLA2 transcription because iPLA2 has been thought of as a housekeeping protein that is not subject to transcriptional regulation. Our results reveal for the first time that STS induces apoptosis at least in part by down-regulation of iPLA2. This down-regulation results in the loss of cardiolipin remodeling and repair of phospholipid peroxidation and leads to mitochondrial failure and cell death. This sequence of events is consistent with our observation by confocal microscopy that most iPLA2-transfected INS-1 cells, but not untransfected cells, survive STS treatment.
iPLA2 contains several caspase 3 consensus sites, and cleavage at these sites permanently activates iPLA2 (14, 65-68). This caspase 3-dependent activation of iPLA2 reportedly amplifies apoptosis induced by Fas and thapsigargin (65-67). Cardiac ischemia, well known to activate caspase 3 (69), also reportedly activates iPLA2 (22, 70). Finally, it has been reported that long term exposure of cells to high levels of H2O2 (500 μM) activates iPLA2 and accelerates apoptosis (71).
Because caspase 3 activation marks cells for death, the permanent activation of iPLA2 by caspase 3 may facilitate the characteristic biologic and morphologic changes of apoptosis. Indeed, iPLA2 has been shown to mediate the release of the chemoattractant lysophosphatidylcholine to recruit monocytic cells and primary macrophages to engulf the apoptotic cell and prevent the release of toxic cellular contents (68). Accumulated evidence suggests that iPLA2 plays a dual role in cells; its intrinsic function is to prevent apoptosis by remodeling mitochondrial cardiolipin and repairing peroxidative damage to mitochondrial membranes caused by mitochondrially generated ROS. However, once cell death is made inevitable by the activation of caspase 3, iPLA2 as well as other caspase 3-activated proteins such as the deoxyribonuclease/DNA fragmentation factor (CAD/DFF40) (72) actively facilitate apoptotic progression and the rapid removal of apoptotic cells (73).
In summary, our study demonstrates that iPLA2 localizes in mitochondria and is likely involved in mitochondrial membrane remodeling and repair under physiological conditions. Down-regulation of iPLA2 by STS may result in failure to repair peroxidative damage of membrane phospholipids, particularly those in the mitochondria. This leads to the subsequent loss of mitochondrial membrane potential, the release of cytochrome c and other apoptotic proteins, and apoptosis. Expression of iPLA2 ex vivo may, therefore, prevent mitochondrial failure and apoptosis.
Acknowledgments
We thank Dr. Hans Snoeck (The Flow Cytometry Shared Research Facility of Mount Sinai School of Medicine) for directing FACS analysis.
Footnotes
This work is supported by grants from the NIDDK, National Institutes of Health and the Juvenile Diabetes Research Foundation, International. The costs of publication of this article were defrayed in part by the payment of page charges. This article must therefore be hereby marked “advertisement” in accordance with 18 U.S.C. Section 1734 solely to indicate this fact.
- ROS
- reactive oxygen species
- PLA2
- phospholipase A2
- iPLA2
- group VI Ca2+-independent PLA2
- cPLA2
- cytosolic Ca2+-dependent PLA2
- STS
- staurosporine
- FACS
- fluorescence activated cell sorting
- PS
- phosphatidylserine
- TBARS
- thiobarbituric acid reactive substances
- HE
- hydroethidium
- JC-1
- 5,5′,6,6′-tetrachloro-1,1′,3,3′ tetraethyl-benzimidazolylcarbocyanine
- BEL
- bromoenol lactone
- CHO
- Chinese hamster ovary
- PI
- propidium iodide
- PBS
- phosphate-buffered saline
- Z
- benzyloxycarbonyl
- FMK
- fluoromethyl ketone
- AIF
- apoptosis inducing factor
- RT
- reverse transcription
- GFP
- green fluorescent protein
REFERENCES
- 1.Orrenius S. Toxicol. Lett. 2004;149:19–23. doi: 10.1016/j.toxlet.2003.12.017. [DOI] [PubMed] [Google Scholar]
- 2.Green DR, Kroemer G. Science. 2004;305:626–629. doi: 10.1126/science.1099320. [DOI] [PubMed] [Google Scholar]
- 3.Acehan D, Jiang X, Morgan DG, Heuser JE, Wang X, Akey CW. Mol. Cell. 2002;9:423–432. doi: 10.1016/s1097-2765(02)00442-2. [DOI] [PubMed] [Google Scholar]
- 4.Budihardjo I, Oliver H, Lutter M, Luo X, Wang X. Annu. Rev. Cell Dev. Biol. 1999;15:269–290. doi: 10.1146/annurev.cellbio.15.1.269. [DOI] [PubMed] [Google Scholar]
- 5.Cadenas E. Mol. Aspects Med. 2004;25:17–26. doi: 10.1016/j.mam.2004.02.005. [DOI] [PubMed] [Google Scholar]
- 6.Girotti AW. J. Lipid Res. 1998;39:1529–1542. [PubMed] [Google Scholar]
- 7.Nigam S, Schewe T. Biochim. Biophys. Acta. 2000;1488:167–181. doi: 10.1016/s1388-1981(00)00119-0. [DOI] [PubMed] [Google Scholar]
- 8.Sevanian A. In: Oxidative Damage and Repair. Davies K, editor. Pergamon Press; New York: 1988. pp. 543–549. [Google Scholar]
- 9.Kagan VE, Borisenko GG, Tyurina YY, Tyurin VA, Jiang J, Potapovich AI, Kini V, Amoscato AA, Fujii Y. Free Radic. Biol. Med. 2004;37:1963–1985. doi: 10.1016/j.freeradbiomed.2004.08.016. [DOI] [PubMed] [Google Scholar]
- 10.Nakagawa Y. Ann. N. Y. Acad. Sci. 2004;1011:177–184. doi: 10.1007/978-3-662-41088-2_18. [DOI] [PubMed] [Google Scholar]
- 11.Cristea IM, Degli Esposti M. Chem. Phys. Lipids. 2004;129:133–160. doi: 10.1016/j.chemphyslip.2004.02.002. [DOI] [PubMed] [Google Scholar]
- 12.Kagan VE, Tyurin VA, Jiang J, Tyurina YY, Ritov VB, Amoscato AA, Osipov AN, Belikova NA, Kapralov AA, Kini V, Vlasova II, Zhao Q, Zou M, Di P, Svistunenko DA, Kurnikov IV, Borisenko GG. Nat. Chem. Biol. 2005;1:223–232. doi: 10.1038/nchembio727. [DOI] [PubMed] [Google Scholar]
- 13.Six DA, Dennis EA. Biochim. Biophys. Acta. 2000;1488:1–19. doi: 10.1016/s1388-1981(00)00105-0. [DOI] [PubMed] [Google Scholar]
- 14.Ma Z, Turk J. Prog. Nucleic Acid Res. Mol. Biol. 2001;67:1–33. doi: 10.1016/s0079-6603(01)67023-5. [DOI] [PubMed] [Google Scholar]
- 15.Sevanian A, Hochstein P. Annu. Rev. Nutr. 1985;5:365–390. doi: 10.1146/annurev.nu.05.070185.002053. [DOI] [PubMed] [Google Scholar]
- 16.Schlame M, Rustow B. Biochem. J. 1990;272:589–595. doi: 10.1042/bj2720589. [DOI] [PMC free article] [PubMed] [Google Scholar]
- 17.Ma BJ, Taylor WA, Dolinsky VW, Hatch GM. J. Lipid Res. 1999;40:1837–1845. [PubMed] [Google Scholar]
- 18.Xu Y, Kelley RI, Blanck TJ, Schlame M. J. Biol. Chem. 2003;278:51380–51385. doi: 10.1074/jbc.M307382200. [DOI] [PubMed] [Google Scholar]
- 19.Hatch GM. Biochem. Cell Biol. 2004;82:99–112. doi: 10.1139/o03-074. [DOI] [PubMed] [Google Scholar]
- 20.Balsinde J, Bianco ID, Ackermann EJ, Conde-Frieboes K, Dennis EA. Proc. Natl. Acad. Sci. U. S. A. 1995;92:8527–8531. doi: 10.1073/pnas.92.18.8527. [DOI] [PMC free article] [PubMed] [Google Scholar]
- 21.Winstead MV, Balsinde J, Dennis EA. Biochim. Biophys. Acta. 2000;1488:28–39. doi: 10.1016/s1388-1981(00)00107-4. [DOI] [PubMed] [Google Scholar]
- 22.Williams SD, Gottlieb RA. Biochem. J. 2002;362:23–32. doi: 10.1042/0264-6021:3620023. [DOI] [PMC free article] [PubMed] [Google Scholar]
- 23.Ruegg UT, Burgess GM. Trends Pharmacol. Sci. 1989;10:218–220. doi: 10.1016/0165-6147(89)90263-0. [DOI] [PubMed] [Google Scholar]
- 24.Yang J, Liu X, Bhalla K, Kim CN, Ibrado AM, Cai J, Peng T-I, Jones DP, Wang X. Science. 1997;275:1129–1132. doi: 10.1126/science.275.5303.1129. [DOI] [PubMed] [Google Scholar]
- 25.Cai J, Jones DP. J. Biol. Chem. 1998;273:11401–11404. doi: 10.1074/jbc.273.19.11401. [DOI] [PubMed] [Google Scholar]
- 26.Kruman I, Guo Q, Mattson MP. J. Neurosci. Res. 1998;51:293–308. doi: 10.1002/(SICI)1097-4547(19980201)51:3<293::AID-JNR3>3.0.CO;2-B. [DOI] [PubMed] [Google Scholar]
- 27.Ahlemeyer B, Bauerbach E, Plath M, Steuber M, Heers C, Tegtmeier F, Krieglstein J. Free Radic. Biol. Med. 2001;30:1067–1077. doi: 10.1016/s0891-5849(01)00495-6. [DOI] [PubMed] [Google Scholar]
- 28.Pong K, Doctrow SR, Huffman K, Adinolfi CA, Baudry M. Exp. Neurol. 2001;171:84–97. doi: 10.1006/exnr.2001.7747. [DOI] [PubMed] [Google Scholar]
- 29.Gil J, Almeida S, Oliveira CR, Rego AC. Free Radic. Biol. Med. 2003;35:1500–1514. doi: 10.1016/j.freeradbiomed.2003.08.022. [DOI] [PubMed] [Google Scholar]
- 30.Matsura T, Serinkan BF, Jiang J, Kagan VE. FEBS Lett. 2002;524:25–30. doi: 10.1016/s0014-5793(02)02990-3. [DOI] [PubMed] [Google Scholar]
- 31.Ma Z, Bohrer A, Wohltmann M, Ramanadham S, Hsu FF, Turk J. Lipids. 2001;36:689–700. doi: 10.1007/s11745-001-0774-9. [DOI] [PubMed] [Google Scholar]
- 32.Ma Z, Ramanadham S, Kempe K, Chi XS, Ladenson J, Turk J. J. Biol. Chem. 1997;272:11118–11127. [PubMed] [Google Scholar]
- 33.Song K, Zhang X, Zhao C, Ang NT, Ma ZA. Mol. Endocrinol. 2005;19:504–515. doi: 10.1210/me.2004-0169. [DOI] [PMC free article] [PubMed] [Google Scholar]
- 34.Zhang XH, Zhao C, Seleznev K, Song K, Manfredi JJ, Ma ZA. J. Cell Sci. 2006;119:1005–1015. doi: 10.1242/jcs.02821. [DOI] [PMC free article] [PubMed] [Google Scholar]
- 35.Ma Z, Ramanadham S, Wohltmann M, Bohrer A, Hsu FF, Turk J. J. Biol. Chem. 2001;276:13198–13208. doi: 10.1074/jbc.M010423200. [DOI] [PubMed] [Google Scholar]
- 36.Ma Z, Zhang S, Turk J, Ramanadham S. Am. J. Physiol. Endocrinol. Metab. 2002;282:820–833. doi: 10.1152/ajpendo.00165.2001. [DOI] [PubMed] [Google Scholar]
- 37.Bucana C, Saiki I, Nayar R. J. Histochem. Cytochem. 1986;34:1109–1115. doi: 10.1177/34.9.2426339. [DOI] [PubMed] [Google Scholar]
- 38.Rothe G, Valet G. J. Leukocyte Biol. 1990;47:440–448. [PubMed] [Google Scholar]
- 39.Smani T, Zakharov SI, Csutora P, Leno E, Trepakova ES, Bolotina VM. Nat. Cell Biol. 2004;6:113–120. doi: 10.1038/ncb1089. [DOI] [PubMed] [Google Scholar]
- 40.Wu D, Ingram A, Lahti JH, Mazza B, Grenet J, Kapoor A, Liu L, Kidd VJ, Tang D. J. Biol. Chem. 2002;277:12001–12008. doi: 10.1074/jbc.M109219200. [DOI] [PubMed] [Google Scholar]
- 41.Tsuruga M, Dang Y, Shiono Y, Oka S, Yamazaki Y. Mol. Cell. Biochem. 2003;250:131–137. doi: 10.1023/a:1024912806686. [DOI] [PubMed] [Google Scholar]
- 42.Kurosu T, Fukuda T, Miki T, Miura O. Oncogene. 2003;22:4459–4468. doi: 10.1038/sj.onc.1206755. [DOI] [PubMed] [Google Scholar]
- 43.Du C, Fang M, Li Y, Li L, Wang X. Cell. 2000;102:33–42. doi: 10.1016/s0092-8674(00)00008-8. [DOI] [PubMed] [Google Scholar]
- 44.Susin SA, Lorenzo HK, Zamzami N, Marzo I, Snow BE, Brothers GM, Mangion J, Jacotot E, Costantini P, Loeffler M, Larochette N, Goodlett DR, Aebersold R, Siderovski DP, Penninger JM, Kroemer G. Nature. 1999;397:441–446. doi: 10.1038/17135. [DOI] [PubMed] [Google Scholar]
- 45.Tyurina YY, Kawai K, Tyurin VA, Liu SX, Kagan VE, Fabisiak JP. Antioxid. Redox Signal. 2004;6:209–225. doi: 10.1089/152308604322899288. [DOI] [PubMed] [Google Scholar]
- 46.Engels IH, Stepczynska A, Stroh C, Lauber K, Berg C, Schwenzer R, Wajant H, Janicke RU, Porter AG, Belka C, Gregor M, Schulze-Osthoff K, Wesselborg S. Oncogene. 2000;19:4563–4573. doi: 10.1038/sj.onc.1203824. [DOI] [PubMed] [Google Scholar]
- 47.Debatin KM, Poncet D, Kroemer G. Oncogene. 2002;21:8786–8803. doi: 10.1038/sj.onc.1206039. [DOI] [PubMed] [Google Scholar]
- 48.Stennicke HR, Jurgensmeier JM, Shin H, Deveraux Q, Wolf BB, Yang X, Zhou Q, Ellerby HM, Ellerby LM, Bredesen D, Green DR, Reed JC, Froelich CJ, Salvesen GS. J. Biol. Chem. 1998;273:27084–27090. doi: 10.1074/jbc.273.42.27084. [DOI] [PubMed] [Google Scholar]
- 49.Luo X, Budihardjo I, Zou H, Slaughter C, Wang X. Cell. 1998;94:481–490. doi: 10.1016/s0092-8674(00)81589-5. [DOI] [PubMed] [Google Scholar]
- 50.Kuwana T, Smith JJ, Muzio M, Dixit V, Newmeyer DD, Kornbluth S. J. Biol. Chem. 1998;273:16589–16594. doi: 10.1074/jbc.273.26.16589. [DOI] [PubMed] [Google Scholar]
- 51.Wieder T, Essmann F, Prokop A, Schmelz K, Schulze-Osthoff K, Beyaert R, Dorken B, Daniel PT. Blood. 2001;97:1378–1387. doi: 10.1182/blood.v97.5.1378. [DOI] [PubMed] [Google Scholar]
- 52.von Haefen C, Wieder T, Essmann F, Schulze-Osthoff K, Dorken B, Daniel PT. Oncogene. 2003;22:2236–2247. doi: 10.1038/sj.onc.1206280. [DOI] [PubMed] [Google Scholar]
- 53.Chatterjee D, Schmitz I, Krueger A, Yeung K, Kirchhoff S, Krammer PH, Peter ME, Wyche JH, Pantazis P. Cancer Res. 2001;61:7148–7154. [PubMed] [Google Scholar]
- 54.Johansson AC, Steen H, Ollinger K, Roberg K. Cell Death Differ. 2003;10:1253–1259. doi: 10.1038/sj.cdd.4401290. [DOI] [PubMed] [Google Scholar]
- 55.Wissing D, Mouritzen H, Egeblad M, Poirier GG, Jaattela M. Proc. Natl. Acad. Sci. U. S. A. 1997;94:5073–5077. doi: 10.1073/pnas.94.10.5073. [DOI] [PMC free article] [PubMed] [Google Scholar]
- 56.Penzo D, Petronilli V, Angelin A, Cusan C, Colonna R, Scorrano L, Pagano F, Prato M, Di Lisa F, Bernardi P. J. Biol. Chem. 2004;279:25219–25225. doi: 10.1074/jbc.M310381200. [DOI] [PubMed] [Google Scholar]
- 57.van Kuijk FJ, Handelman GJ, Dratz EA. J. Free Radic. Biol. Med. 1985;1:421–427. doi: 10.1016/0748-5514(85)90156-4. [DOI] [PubMed] [Google Scholar]
- 58.Schlame M, Rua D, Greenberg ML. Prog. Lipid Res. 2000;39:257–288. doi: 10.1016/s0163-7827(00)00005-9. [DOI] [PubMed] [Google Scholar]
- 59.Turk J, Wolf BA, Lefkowith JB, Stump WT, McDaniel ML. Biochim. Biophys. Acta. 1986;879:399–409. doi: 10.1016/0005-2760(86)90232-8. [DOI] [PubMed] [Google Scholar]
- 60.Jiang X, Wang X. Annu. Rev. Biochem. 2004;73:87–106. doi: 10.1146/annurev.biochem.73.011303.073706. [DOI] [PubMed] [Google Scholar]
- 61.Orrenius S, Zhivotovsky B. Nat. Chem. Biol. 2005;1:188–189. doi: 10.1038/nchembio0905-188. [DOI] [PubMed] [Google Scholar]
- 62.Ott M, Robertson JD, Gogvadze V, Zhivotovsky B, Orrenius S. Proc. Natl. Acad. Sci. U. S. A. 2002;99:1259–1263. doi: 10.1073/pnas.241655498. [DOI] [PMC free article] [PubMed] [Google Scholar]
- 63.Petrosillo G, Ruggiero FM, Pistolese M, Paradies G. FEBS Lett. 2001;509:435–438. doi: 10.1016/s0014-5793(01)03206-9. [DOI] [PubMed] [Google Scholar]
- 64.Petrosillo G, Ruggiero FM, Paradies G. FASEB J. 2003;17:2202–2208. doi: 10.1096/fj.03-0012com. [DOI] [PubMed] [Google Scholar]
- 65.Atsumi G-I, Tajima M, Hadano A, Nakatani Y, Murakami M, Kudo I. J. Biol. Chem. 1998;273:13870–13877. doi: 10.1074/jbc.273.22.13870. [DOI] [PubMed] [Google Scholar]
- 66.Atsumi G-I, Murakami M, Kojima K, Hadano A, Tajima M, Kudo I. J. Biol. Chem. 2000;275:18248–18258. doi: 10.1074/jbc.M000271200. [DOI] [PubMed] [Google Scholar]
- 67.Ramanadham S, Hsu FF, Zhang S, Jin C, Bohrer A, Song H, Bao S, Ma Z, Turk J. Biochemistry. 2004;43:918–930. doi: 10.1021/bi035536m. [DOI] [PMC free article] [PubMed] [Google Scholar]
- 68.Lauber K, Bohn E, Krober SM, Xiao YJ, Blumenthal SG, Lindemann RK, Marini P, Wiedig C, Zobywalski A, Baksh S, Xu Y, Autenrieth IB, Schulze-Osthoff K, Belka C, Stuhler G, Wesselborg S. Cell. 2003;113:717–730. doi: 10.1016/s0092-8674(03)00422-7. [DOI] [PubMed] [Google Scholar]
- 69.Borutaite V, Brown GC. FEBS Lett. 2003;541:1–5. doi: 10.1016/s0014-5793(03)00278-3. [DOI] [PubMed] [Google Scholar]
- 70.Mancuso DJ, Abendschein DR, Jenkins CM, Han X, Saffitz JE, Schuessler RB, Gross RW. J. Biol. Chem. 2003;278:22231–22236. doi: 10.1074/jbc.C300033200. [DOI] [PubMed] [Google Scholar]
- 71.Perez R, Melero R, Balboa MA, Balsinde J. J. Biol. Chem. 2004;279:40385–40391. doi: 10.1074/jbc.M402562200. [DOI] [PubMed] [Google Scholar]
- 72.Liu X, Zou H, Slaughter C, Wang X. Cell. 1997;89:175–184. doi: 10.1016/s0092-8674(00)80197-x. [DOI] [PubMed] [Google Scholar]
- 73.Lauber K, Blumenthal SG, Waibel M, Wesselborg S. Mol. Cell. 2004;14:277–287. doi: 10.1016/s1097-2765(04)00237-0. [DOI] [PubMed] [Google Scholar]


