Abstract
Two perceptual structures (based on colors) and one semantic structure (based on names) of eight basic chromatic colors were obtained from three judged similarity tasks for 41 Mandarin Chinese-speaking females in Taiwan and 35 English-speaking females in the United States. Major findings include the following: (i) there are robust and reliable individual differences among individuals, (ii) the structures for Chinese and English speakers are similar, and (iii) the semantic structure of color names is similar to the perceptual structures of colors. The results place strong constraints on theories relating to individual differences, linguistic relativity, and the relation of perceptual and semantic structures for colors.
The domain of colors and color terms is central to a number of current theoretical issues across several of the social sciences. Philosophers have long speculated on the question of qualia: for example, whether the green seen by one person is the same as the green seen by another person (1). Analyzing similarity judgments among perceived colors does not provide an answer to that question but does provide an answer to a closely related question: namely, are the relationships among a set of colors the same for one person as for another person? If there are individual differences, how big are they? Would these differences replicate in unrelated languages? The language question relates to the controversy over linguistic universals versus relativity with respect to color naming and perception. The voluminous literature on the subject is summarized in a recent volume (2). Finally, would individual differences hold up whether names of colors or the colors themselves are presented for judgment (3) as “linguistic terms may be grounded in the relations among colors” (ref. 4, p. 225)?
To answer these questions, responses were obtained from 41 Mandarin Chinese-speaking females in Taiwan and 35 English-speaking females in the United States. All individuals had normal color vision based on the Ishihara color plates (5). Chinese, in Taiwan, and English, in the U.S., was reported as the first language spoken. Ten U.S. individuals learned, as children, a variety of languages unrelated to Mandarin, except for one who learned Cantonese. The average age of the Taiwanese was 22.6 and for the English 19.9 years.
Boynton and Olson (6) provided quantitative information on the locations of 11 basic colors previously defined by Berlin and Kay and others (2, 7). Boynton and Olson worked within the domain of surface colors represented by the Uniform Color Scales of the Optical Society of America (OSA) (8). In their study, nine subjects named each of the 424 different OSA color chips under carefully controlled conditions, and reaction time for naming was recorded. Consensus colors were defined as color chips given the same name by all subjects. Focal colors were defined “as those samples, named with consensus, that exhibit the shortest response times within their categories” (ref. 6, p. 99). Centroid colors were “computed by averaging the L, j, g values for all samples called by a particular name, weighted according to whether the name was used once or twice” (ref. 6, pp. 99–100). Boynton and Olson's definitions of centroid and focal colors for the eight chromatic colors (we excluded black, gray, and white) are used in this experiment and reported in Table 1 together with the English words and Chinese characters.
Table 1.
The names of the colors, the OSA coordinates of the centroid and focal color samples, and the Chinese characters used in the study
| English word | Centroid coordinates | Focal coordinates | Chinese character | ||||
|---|---|---|---|---|---|---|---|
| L | j | g | L | j | g | ||
| blue | −1 | −3 | 3 | −6 | −4 | 2 |  |
| brown | −3 | 3 | −3 | −6 | 2 | −2 |  |
| green | −4 | 4 | 2 | −1 | 5 | 5 |  |
| orange | 0 | 6 | −6 | 0 | 6 | −6 |  |
| pink | 0 | 0 | −6 | 3 | −1 | −5 |  |
| purple | −2 | −2 | −2 | −4 | −4 | −2 |  |
| red | −4 | 2 | −6 | −4 | 2 | −8 |  |
| yellow | 3 | 9 | −1 | 4 | 12 | 0 |  |
Since Boynton and Olson (6) used decimal fractions and OSA Samples are integers, the centroid coordinates are only approximate.
Each individual was administered three judged similarity tasks using a rating scale from 1 (most different) to 7 (most similar) on all 28 pairs of colors. Task 1 used names (Chinese characters or English words) as stimuli, task 2 used the centroid colors as stimuli, and task 3 used the focal colors as stimuli. Fig. 1 shows the two sets of color samples used as stimuli. OSA color chips were matched as nearly as possible by visual inspection iterated over many trials by the researchers and were printed with an inkjet printer. Lighting effects were not controlled. In all cases the name task preceded the perceptual tasks. The order of items within a task as well as the order in which individuals were given the focal or centroid stimuli was randomized.
Figure 1.
The colors and stimulus format used in perceptual tasks. The upper row shows centroid colors, and the lower row shows focal colors. Small distortions may be introduced in the reproduction process.
In this paper, perceptual structures, inferred from colors as stimuli, and semantic structure, inferred from names as stimuli, are defined as cognitive representations in which the arrangement of the items relative to each other is represented in Euclidean space. The meaning of an item is defined by its location relative to all of the other items. A quantified estimate of a semantic structure is obtained by scaling judged similarity data to obtain a representation in which items that are judged more similar are closer to each other than items that are judged less similar (9, 10). New methods make it possible to scale any number of individual structures into the same Euclidean spatial representation (11).
The scaling analysis results in 228 (three tasks for 76 individuals) Euclidean representations of the relations among the eight colors or color names. Using Procrustes rotations (12) the first four empirically derived dimensions were rotated into a best fit to the three OSA dimensions L, j, g for the centroid colors. These three dimensions were retained and the means and variance of the coordinates adjusted to plot the results for comparison to Boynton and Olson. The L dimension is not discussed in this paper, although the fit is only slightly less than for the two dimensions considered here.
Fig. 2 shows a plot of the j and g dimensions of the placement of the colors and names for the three tasks for all 76 individuals plus Boynton and Olson's (6) focal and centroid colors using OSA scale values. The placements are derived entirely from judged similarity ratings and correspond well with the Boynton and Olson placements based only upon naming and reaction time data.
Figure 2.
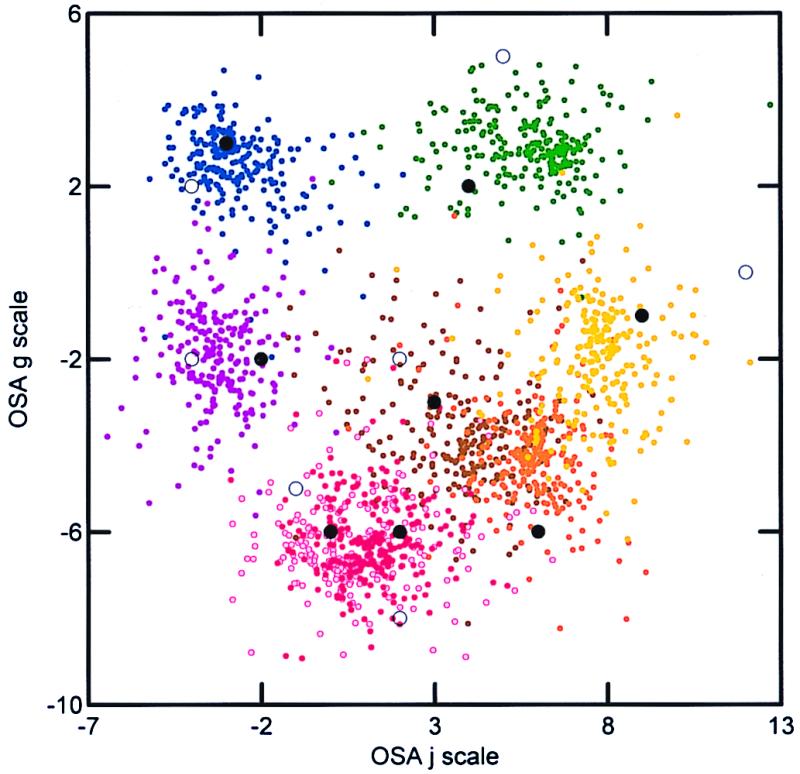
The placements of the colors for all individuals and tasks after scaling, rotation, and sizing. For comparison, the centroid colors (filled circles) and focal colors (unfilled circles) are shown. The scattering within each color category is due to language variability, task variability, and true individual variation, in addition to the usual sampling variability and error variance.
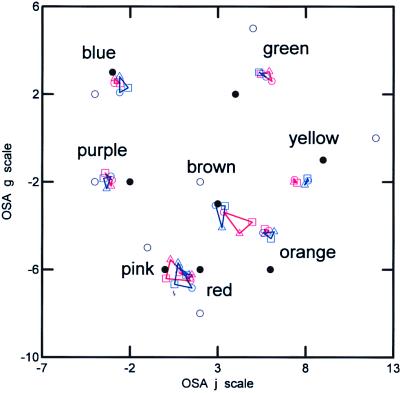
It is possible to aggregate representations for any subset of tasks and individuals by taking the mean location of each term for that subset. Fig. 4 shows the mean position of colors for subsets of individuals for each combination of language and task. There are only minor differences among the three tasks and one clear difference in language, with the Chinese placing the color brown closer to orange than do English, who have a wider separation between brown and orange. The most notable consistent discrepancy between focal and centroid placements and the judged similarity results occurs with the color yellow where the judged similarity results are less extreme on the j scale.
Figure 4.
The means of the perceptual tasks (triangles for centroids, circles for focals) and the semantic task (squares) for each color plotted for Chinese (red) and English (blue) speakers. OSA colors appear as coded in Fig. 2.
The 28 interpoint Euclidean distances among the locations of the eight colors for each of the 228 representations displayed in Fig. 2 were computed. This facilitates the comparison of the similarity of different subgroups of individuals and tasks (11). For example, to compare Chinese and English, the 28 interpoint distances are represented as a vector, and the mean values for the speakers of each language are computed. The two vectors of means are then correlated. The result in this case gives r = 0.958. The mean vectors represent an aggregated (across speakers and tasks) estimate of the cultural definition of the perceptual and semantic structure of the colors for each language. The magnitude of the correlation indicates a high degree of correspondence between the cultural definitions of the two languages. The same kind of calculation for the similarity among tasks within each language was performed. The mean of the three correlations among the tasks for Chinese is 0.955 and for English is 0.953. The magnitude of the correlations indicate that the perceptual and semantic structures as measured in the different tasks are very similar.
The focus of attention now shifts to the knowledge of speakers and the similarities and differences among individuals. Results in this section are based on a 228 × 228 matrix of correlations obtained from the individual vectors of interpoint distances used to calculate the means reported above. To visualize how similar each speaker is to every other speaker, a principal components analysis via singular value decomposition of the matrix is performed. The first principal component represents the knowledge of the individual and will be treated below (11).
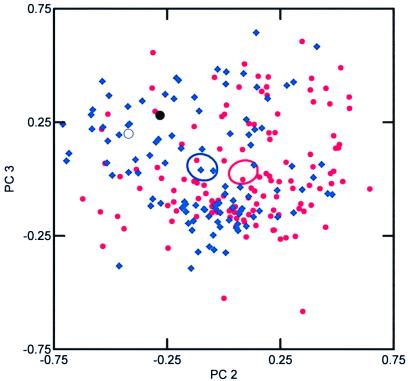
Fig. 3 contains a scatter plot of the second and third principal components illustrating the similarity among Chinese and English speakers. Each speaker is represented by three points corresponding to the judgments of similarity among names, centroid, and focal colors. The closer two points are in the plot, the more similar the structure of the points represented. The Chinese speakers in red are interspersed with the English speakers in blue, although some difference is apparent along the second component. The ellipses are 95% confidence limits around the mean of each distribution on the assumption of bivariate normal distributions. A simple one-way ANOVA using the second principal component as the dependent variable and language as category is significant (F = 23.779, df 1,226, P < 0.001). A similar plot (not shown) of ellipses for the three tasks shows significant variation on the third principal component (F = 6.302, df 2,225, P = 0.002) with the name and focal color tasks at the extremes.
Figure 3.
Similarity of perceptual and semantic structures among Chinese speakers (red circles) and English speakers (blue diamonds) for all tasks. In this spatial representation, the closer two points are in the plot, the more similar the structure of the individual and task represented. The actual centroid colors (black filled circle) and the actual focal colors (black unfilled circle) were scaled as “virtual” individuals and were placed in the figure for comparison.
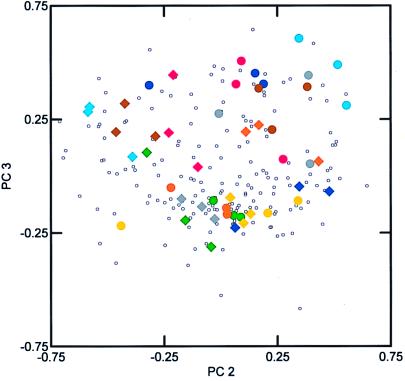
The question of reliable individual differences was explored by looking at the clustering of the three tasks for each individual. Fig. 5 illustrates the phenomenon of individual clustering for the first eight speakers in each language. Note that individuals tend to perform all three tasks in a similar way, indicated by the clustering of symbols of the same form and color. It is as if each individual possesses a personal prototype or model for the cognitive structure of color. An individual apparently uses the same personal prototype for judging the similarity among words, centroid colors, and focal colors; all three tasks coalesce into a single structure somewhat unique for each individual. The effect is robust and highly statistically significant; for example, a quadratic assignment Monte Carlo permutation test with 10,000 trials, within each language, was performed, and no trial was as extreme as the observed value of Hubert's Gamma (13, 14).
Figure 5.
A scatterplot showing a clustering effect among the three tasks for each of the first eight speakers in Chinese (circles) and English (diamonds). Each individual is characterized by a single color; e.g., in the upper right of the plot, the three blue circles represent the three tasks for the same Chinese speaker.
The sources of knowledge of the color tasks may be quantified into the following portions: (i) universally shared by all individuals, (ii) culture-specific shared by same language speakers, (iii) reliable individual differences, and (iv) sampling variability and error variance. Psychometrics and consensus theory (11, 15) have shown that the degree of similarity, as measured by the mean correlations within a cultural group, reflects the degree of knowledge of the group members. In particular, the square root of the average correlation within any given category (e.g., language, task, individual, etc.) is an approximation of the average knowledge of the cultural pattern and corresponds to the first principal component. The derivation of this relationship between the first principal component and the square root of the average correlation is given in ref. 11.
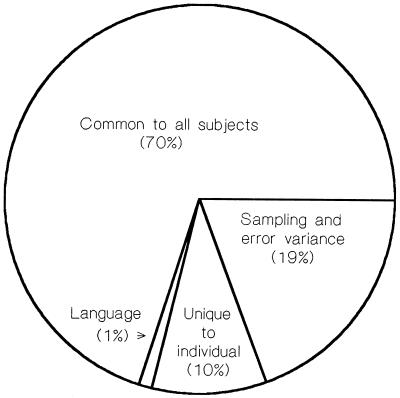
The average knowledge of each individual may be estimated as the square root of the mean of the correlations among the three tasks averaged across all individuals (11). The knowledge of individuals speaking the same language may be estimated as the square root of the mean of the correlations among people speaking the same language (not including the correlations between tasks for the same individual used to estimate individual knowledge). The universally shared knowledge among languages may be estimated by taking the square root of the correlations between individuals who speak different languages. By appropriate subtraction, one arrives at the proportions displayed in Fig. 6. The individual differences are somewhat smaller among Chinese (0.08) than among English (0.11) speakers with a weighted mean of 0.095 rounded to 0.10 in the figure. It is interesting to note that shared cultural knowledge of colors and color terms in this study is somewhat higher than in the domain of emotion terms. Moore et al. (ref. 16, p. 543) report 59% common knowledge among English and Japanese speakers for 15 common emotions terms, about 11% less than is the case for color. The culture-specific proportion for English and Japanese was 13% compared with the 1% for colors reported here. The portion unique to individuals was 9% for emotions, very similar to the 10% for color. Apparently, the common perceptual color mechanisms shared by all humans (and many primates) enhances a common understanding and minimizes the effects of culture.
Figure 6.
A pie chart showing the source of knowledge of the color tasks for the average individual.
The major findings and implications of the study may be briefly summarized as follows: First, even though previous studies (6, 17–19) have found indications of individual differences, the magnitude of the effect among a large sample of females with normal vision has never been estimated and requires explanation. Eye color was investigated and does not account for the findings. Individual differences could relate to Cicerone and Nerger's (20) finding of variation in ratios from 1.46 to 2.34 L cones for every M cone in six color normal observers. Another possibility is that the cone pigments may have a differentially shifted absorption spectrum among individuals (21).
Second, the small effects of language are consistent with theories positing linguistic universals rather than linguistic relativity, at least with respect to basic colors and color naming (2, 7). Our results are consistent with Uchikawa and Boynton's (22) comparison of 10 Japanese observers (living in the U.S.) with 7 American observers in which they found basic similarity in color naming in the two languages “which describes a fundamental color sensation dependent upon an underlying physiology that does not differ between the two groups” (ref. 22, p. 1825).
Third, the fact that the perceptual (colors) and semantic (names) structures are very similar is consistent with Shepard's idea that “judgments of similarity among objects are essentially the same whether the objects are presented or only named” (ref. 4, p. 96), and with the idea that language reflects a shared, objective reality (1, 4).
This study is an outgrowth of Berlin and Kay's 1969 classic book, Basic Color Terms (7). Hardin (23), in summarizing the controversy between linguistic relativity and linguistic universals with respect to color reports that, although the Berlin and Kay position has been significantly modified over the years, many of its basic tenets have proved to be quite robust. Hardin says, “If the grand multilayered story that the Berlin-Kay work suggests can be completed in its most essential details, it will connect perception, thought, and culture. At the center of the story is the experience of color and its representation in individual consciousness. One branch of the story reaches downward into human biology and the organization of the nervous system. The other branch reaches outward into language and social interaction” (ref. 23, p. 207). We view the current research as an additional step in understanding complex biocultural processes in human beings.
Acknowledgments
We acknowledge helpful comments from Carol M. Cicerone, Roy G. D'Andrade, Tarow Indow, and Robert L. Munroe. The research was supported in part by National Science Foundation Grant SBR-9730831 to C.C.M. and in part by National Science Foundation Grant SBR-9631213 to A.K.R. and W.H.B.
Abbreviation
- OSA
Optical Society of America
References
- 1.Searle J R. The Rediscovery of the Mind. Cambridge, MA: MIT Press; 1992. [Google Scholar]
- 2.Hardin C L, Maffi L, editors. Color Categories in Thought and Language. Cambridge, U.K.: Cambridge Univ. Press; 1997. [Google Scholar]
- 3.Shepard R N. In: Information Processing and Cognition: The Layola Symposium. Solso R, editor. Hillsdale, NJ: Lawrence Erlbaum; 1997. pp. 87–122. [Google Scholar]
- 4.Shepard R N. In: Conceptions of the Human Mind: Essays in Honor of George A. Miller. Harman G, editor. Hillsdale, NJ: Lawrence Erlbaum; 1993. pp. 217–245. [Google Scholar]
- 5.Ishihara S. Tests for Colour-Deficiency. Tokyo: Kanehara; 1997. [Google Scholar]
- 6.Boynton R M, Olson C X. Color Res Appl. 1987;12:94–105. [Google Scholar]
- 7.Berlin B, Kay P. Basic Color Terms: Their Universality and Evolution. Berkeley, CA: Univ. of California Press; 1969. [Google Scholar]
- 8.Nickerson D. Color Res Appl. 1981;6:7–33. [Google Scholar]
- 9.Romney A K, Moore C C, Brazill T J. In: Visualization of Categorical Data. Blasius J, Greenacre M, editors. San Diego: Academic; 1998. pp. 329–345. [Google Scholar]
- 10.Romney A K, Moore C C, Rusch C. Proc Natl Acad Sci USA. 1997;94:5489–5494. doi: 10.1073/pnas.94.10.5489. [DOI] [PMC free article] [PubMed] [Google Scholar]
- 11.Romney A K, Moore C C, Batchelder W H, Hsia T. Proc Natl Acad Sci. 2000;97:518–523. doi: 10.1073/pnas.97.1.518. [DOI] [PMC free article] [PubMed] [Google Scholar]
- 12.Schönemann P H. Psychometrika. 1966;31:1–16. doi: 10.1007/BF02289510. [DOI] [PubMed] [Google Scholar]
- 13.Hubert L H. Assignment Methods in Combinatorial Data Analysis. New York: Dekker; 1987. [Google Scholar]
- 14.Good P. Permutation Tests: A Practical Guide to Resampling Methods for Testing Hypotheses. New York: Springer; 1994. [Google Scholar]
- 15.Nunnally J. Psychometric Theory. New York: McGraw–Hill; 1994. [Google Scholar]
- 16.Moore C C, Romney A K, Hsia T, Rusch C D. Am Anthropol. 1999;101:529–546. [Google Scholar]
- 17.Shepard R N, Cooper L A. Psychol Sci. 1992;3:97–104. [Google Scholar]
- 18.Furbee N L, Maynard K, Smith J J, Benfer R A, Jr, Quick S, Ross L. J Linguistic Anthropol. 1997;6:223–240. [Google Scholar]
- 19.Marmor G S. J Exp Child Psychol. 1978;25:267–278. doi: 10.1016/0022-0965(78)90082-6. [DOI] [PubMed] [Google Scholar]
- 20.Cicerone C M, Nerger J L. Vision Res. 1989;29:115–128. doi: 10.1016/0042-6989(89)90178-8. [DOI] [PubMed] [Google Scholar]
- 21.Nathans J. Cell. 1994;78:357–360. doi: 10.1016/0092-8674(94)90414-6. [DOI] [PubMed] [Google Scholar]
- 22.Uchikawa K, Boynton R M. Vision Res. 1987;27:1825–1833. doi: 10.1016/0042-6989(87)90111-8. [DOI] [PubMed] [Google Scholar]
- 23.Hardin C L. In: Color Vision: Perspectives from Different Disciplines. Backhaus W G K, Kliegl R, Werner J S, editors. New York: Walter de Gruyter; 1998. pp. 207–217. [Google Scholar]


