Abstract
The NOTCH1 signaling pathway directly links extracellular signals with transcriptional responses in the cell nucleus and plays a critical role during T cell development and in the pathogenesis over 50% of human T cell lymphoblastic leukemia (T-ALL) cases. However, little is known about the transcriptional programs activated by NOTCH1. Using an integrative systems biology approach we show that NOTCH1 controls a feed-forward-loop transcriptional network that promotes cell growth. Inhibition of NOTCH1 signaling in T-ALL cells led to a reduction in cell size and elicited a gene expression signature dominated by down-regulated biosynthetic pathway genes. By integrating gene expression array and ChIP-on-chip data, we show that NOTCH1 directly activates multiple biosynthetic routes and induces c-MYC gene expression. Reverse engineering of regulatory networks from expression profiles showed that NOTCH1 and c-MYC govern two directly interconnected transcriptional programs containing common target genes that together regulate the growth of primary T-ALL cells. These results identify c-MYC as an essential mediator of NOTCH1 signaling and integrate NOTCH1 activation with oncogenic signaling pathways upstream of c-MYC.
Keywords: T cell lymphoblastic leukemia
NOTCH receptors play a critical role in lineage specification decisions in development. Physiologic activation of NOTCH receptors (NOTCH1–4) triggered by interaction with a DSL ligand expressed on the surface of a neighboring cell induces two consecutive proteolytic cleavages in the receptor, first by an ADAM metalloprotease and subsequently by the γ-secretase complex, which release the intracellular portion of the NOTCH protein from the membrane (1). This fragment (“intracellular NOTCH” or ICN) rapidly translocates to the nucleus and interacts with the CSL DNA binding protein to activate the expression of target genes (2). Thus, NOTCH receptors operate both as recipients of extracellular signals at the cell surface and as transcription factors regulating gene expression in the nucleus.
NOTCH1 signaling is involved in the maintenance of hematopoietic stem cells and is essential for the development of T cells (3). The key role of NOTCH1 in T cell development underlies the hypothesis that NOTCH1 signaling regulates cell growth, proliferation, differentiation, and apoptosis, processes that when dysregulated are the hallmark of cancer in developing thymocytes. Initially identified because of its involvement in the t(7;9)(q34;q34.3) chromosomal translocation in a patient with T cell lymphoblastic leukemia (T-ALL), NOTCH1 is a major factor in the pathogenesis of immature T cell tumors (4, 5). The t(7;9) translocation juxtaposes a truncated NOTCH1 gene next to the TCRB locus, leading to the aberrant expression of an intracellular constitutively active form of NOTCH1 (4). More frequently, activating mutations in NOTCH1, inducing ligand independent activation of the receptor or increased stability of ICN1 in the nucleus, are found in over 50% of human T-ALL cases (5).
Importantly, inhibition of NOTCH1 signaling with small molecule inhibitors of the γ-secretase complex (GSI) induces cell cycle arrest and apoptosis in leukemic cells, demonstrating that aberrant NOTCH signaling is necessary for maintenance of the malignant phenotype in T-ALL and making NOTCH1 a major target for the development of molecularly tailored antileukemic drugs (5–7).
Despite the prominent roles of NOTCH1 in T cell development and transformation, only a few NOTCH1 target genes have been identified to date in T cells and the mechanisms controlling cell growth, proliferation, and apoptosis downstream of NOTCH1 remain largely unexplored. To gain insight into the molecular mechanisms that underlie the functions of NOTCH1, we undertook the genome wide identification of direct target genes regulated by NOTCH1 using a combination of gene expression profiling with oligonucleotide microarrays and ChIP-on-chip analysis. Our results identify NOTCH1 as a direct regulator of cell growth; integrate NOTCH1 activation with signaling pathways controlling cell growth upstream of c-MYC, and illustrate the power of genomic approaches to elucidate the structure of key transcriptional networks in human cancer.
Results
NOTCH1 Regulates Leukemic Cell Growth.
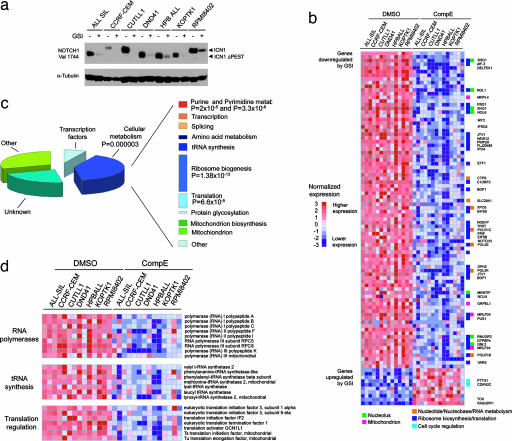
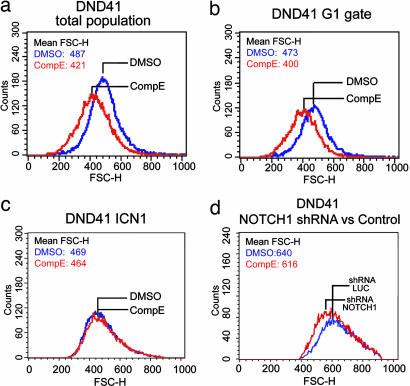
To address the leukemogenic regulatory programs activated by NOTCH1, we first analyzed global gene expression profiles after inhibition of NOTCH1 signaling in T-ALL cells. Blocking NOTCH1 activation with Compound E (CompE), a highly active GSI (5, 8), induces a drastic decrease in the levels of ICN1 (Fig. 1a). Duplicate samples of seven T-ALL cell lines harboring activating mutations in NOTCH1 were treated with CompE or with vehicle (DMSO) only. RNA was collected 24 h posttreatment and analyzed with Affymetrix Human Genome U133 Plus 2.0 arrays. Nearest-neighbor analysis was used to look for gene expression changes associated with GSI or vehicle only treatment. This analysis identified 201 genes that were significantly down-regulated (P < 0.0001) and 38 that were significantly up-regulated (P < 0.0001) after inhibiting NOTCH1 signaling (Fig. 1b). This collection of regulated genes included known direct transcriptional targets of NOTCH1, such as DELTEX1 and HES1. Importantly, the set of down-regulated genes was highly enriched in functional categories related to cellular metabolism, such as ribosome biosynthesis (P =; 1.38 × 10⁻¹³), protein translation (P = 6.6 × 10⁻⁵) and purine and pyrimidine metabolism (P = 2 × 10⁻⁵ and P = 3.3 × 10⁻⁶, respectively) (Fig. 1 c and d). Furthermore, analysis of cell size changes following the inhibition of NOTCH1 signaling by GSI treatment showed a marked reduction in cell diameters (P < 0.001 by paired t test) (Fig. 2a and b). GSI treatment also affects the processing of other γ-secretase substrates expressed in the thymus, including APP and CD44, however, the effect of CompE in gene expression and cell size was specific for NOTCH, as it was rescued by forced expression of ICN1 (Fig. 2c and Fig. 7, which is published as supporting information on the PNAS web site). Similarly, lentiviral expression of a shRNA sequence targeting NOTCH1 (9) depleted T-ALL cells from ICN1, down-regulated the expression of DELTEX1 (Fig. 4b), and induced a smaller cell size in DND41 cells compared with cells expressing a control shRNA sequence targeting the luciferase gene (Fig. 2d). Genes up-regulated upon NOTCH1 inactivation included important cell cycle regulators such as p27/KIP1 and p18/INK4C, consistent with the induction of G1 cell-cycle arrest in T-ALL cells after inhibition of NOTCH1 signaling (Fig. 8, which is published as supporting information on the PNAS web site). These results highlight the role of NOTCH1 as regulator of cell growth and place NOTCH1 signaling upstream of transcriptional programs encompassing essential metabolic and biosynthetic pathways.
Fig. 1.
Oncogenic NOTCH1 signaling activates transcriptional programs regulating leukemic cell growth. (a) Activated intracellular NOTCH1 levels after γ-secretase cleavage were detected by Western blot analysis using the Val-1744 antibody that specifically recognizes ICN1, in cell lysates from T-ALL cell lines treated with GSI (CompE 500 nM) for 24 h or mock-treated (DMSO) controls. Smaller molecular weight bands (ICN1-ΔPEST) are observed in cell lines with truncating mutations in the PEST domain of NOTCH1. α-Tubulin levels are shown as loading control. (b) Gene expression profiling was performed in duplicate samples from 7 T-ALL cell lines treated with GSI (CompE) or vehicle (DMSO) for 24 h. Heat map represents color coded expression levels for each sample with respect to mock treatment controls. Top significant genes (P < 0.00001) ranked by t test are shown. (c) Functional annotation of top genes (P < 0.0001) down-regulated after NOTCH inhibition by GSI treatment using the DAVID tool. (d) Detailed heat maps representing expression changes induced by GSI in selected functional categories.
Fig. 2.
Inhibition of NOTCH1 signaling impairs cell growth in T-ALL cells. (a) DND41 T-ALL cells treated with GSI for 6 days showed a reduction in cell diameters compared with vehicle (DMSO) treatment. Representative histograms of triplicate experiments are shown. Similar results were obtained in HPB-ALL, CUTLL1, and KOPTK1 cell lines. (b) GSI-induced changes in cell size are independent of cell cycle as demonstrated by analysis of G1 (2N DNA content) gated cells. (c) Forced expression of ICN1 rescues the effects of GSI in cell size. (d) Inhibition of NOTCH1 signaling via lentiviral expression of shRNAs targeting NOTCH1 (pGK GFP shRNA NOTCH1) or the luciferase gene (pGK GFP shRNA LUC) used as control.
Fig. 4.
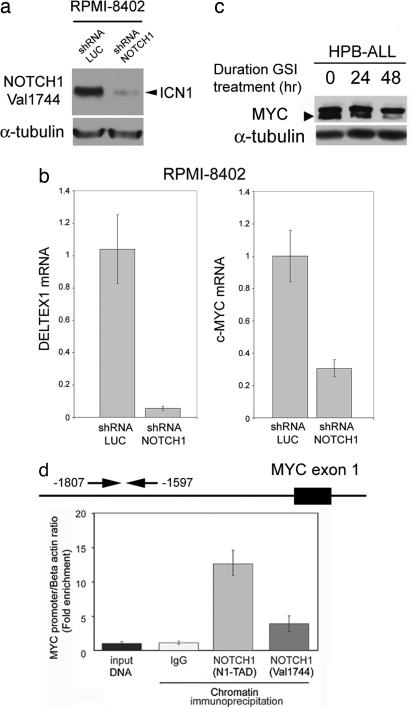
NOTCH1 binds to c-MYC proximal promoter sequences and regulates c-MYC mRNA and protein expression in T-ALL. (a) Western blot analysis of ICN1 levels in RPMI 8402 T-ALL cells infected with lentiviruses (pLKO puro) driving expression of shRNAs targeting NOTCH1 (shRNA NOTCH1) or control shRNAs targeting the luciferase gene (shRNA LUC). (b) Quantitative RT-PCR analysis of DELTEX1 and c-MYC transcript levels in RPMI 8402 T-ALL cells upon NOTCH1 shRNA knockdown and in control shRNA-treated cells. (c) Western blot analysis of c-MYC in HPB-ALL T-ALL cells showing down-regulation of c-MYC expression upon NOTCH1 inhibition with GSI (CompE 500 nM). The arrowhead indicates the c-MYC-specific band. (d) ChIP analysis of NOTCH1 binding to c-MYC promoter sequences. Quantitative PCR analysis of c-MYC promoter sequences normalized to β-actin levels in control DNA and chromatin immunoprecipitates performed with two NOTCH1 antibodies (N1-TAD and Val 1744) and IgG as control in HPB-ALL cells.
Identification of NOTCH1 Direct Target Genes.
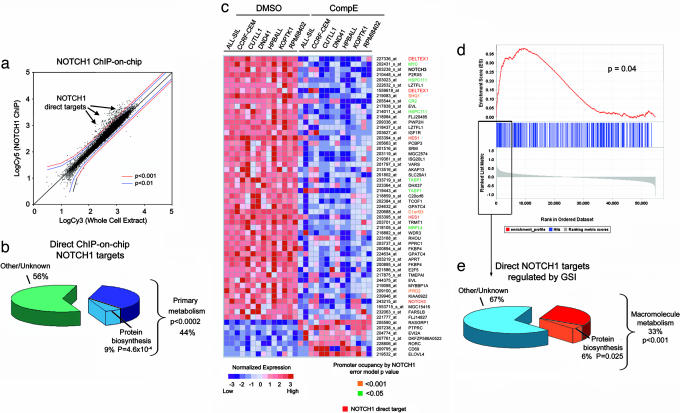
To test the hypothesis that NOTCH1 directly controls genes regulating cell growth, we undertook the identification of NOTCH1 direct target genes by ChIP-on-chip analysis using a spotted promoter array platform. In this experiment, triplicate chromatin immunoprecipitations using an antibody against the transactivating domain of NOTCH1 (N1-TAD) were performed in the HPB-ALL T-ALL cell line and hybridized to HU19K promoter arrays. The HU19K genomic array platform contains 13,000 human proximal promoter sequences, typically located between −700 to +200 bp relative to the transcription initiation site, plus sequences encompassing the promoters of all human transcription factor genes up to −3 kb from the transcription initiation site (10, 11). This analysis identified highly significant NOTCH1 binding (P < 0.0001) to the promoter regions of 134 genes (Fig. 3a) (Table 1, which is published as supporting information on the PNAS web site). Importantly, quantitative ChIP analysis of a set of 12 randomly selected genes among these putative NOTCH1 targets, confirmed NOTCH1 binding in 10 of them (83%) (Table 2, which is published as supporting information on the PNAS web site). In agreement with these results, analysis of the proximal promoters of genes identified as direct NOTCH1 targets by ChIP-on-chip demonstrated a highly significant over-representation of CSL DNA binding sequences (TGGGAA) compared with randomly selected nonoccupied promoter sequences (P = 1.10 × 10⁻¹³). Functional annotation of NOTCH1-bound promoters revealed that genes involved in primary cellular metabolism were markedly overrepresented (44%, P < 0.002) (Fig. 3b), further suggesting that NOTCH1 signaling directly activates downstream transcriptional programs that regulate cell growth. However, promoter occupancy by transcription factors is variably associated with regulation of gene expression.
Fig. 3.
NOTCH1 is a direct regulator of genes involved in cell growth and metabolism. (a) Scatter plot showing the combined results of three independent ChIP-on-chip experiments with the N1-TAD antibody recognizing the transactivation domain of NOTCH1 in HPB-ALL cells. The log fluorescence values for control DNA labeled with Cy3 are plotted on the x axis, and those for the NOTCH1 IP DNA labeled with Cy5 are plotted on the y axis. Promoter sequences bound by NOTCH1 (arrowheads) are shifted to the upper left side from the diagonal. (b) Functional classification of NOTCH1 direct targets identified by ChIP-on-chip (P < 0.0001). (c) Top gene expression changes induced by GSI in T-ALL cell lines ranked by signal-to-noise ratio. Heat map represents color-coded expression levels for each sample with respect to mock treatment controls. Previously known NOTCH1 direct target genes and genes identified on ChIP-on-chip analysis are highlighted. (d) Graphic representation of the GSEA enrichment score and distribution of NOTCH1 occupied promoter genes (binding P value <0.0001) along the rank of GSI-regulated transcripts. (e) Annotation of NOTCH1 direct target genes along the top GSI-regulated transcripts ranked by signal-to-noise ratio.
To demonstrate that promoter occupancy by NOTCH1 drives transcription of the affected genes, we combined our ChIP-on-chip results with gene expression profiling data on T-ALL cell lines treated with GSI. This analysis revealed a significant overlap between expression data and ChIP-on-chip targets (47% of ChIP-on-chip targets with binding P value <0.001 are regulated with expression P values <0.0001, Fisher's exact test P = 9 × 10⁻¹¹) (Fig. 3c and, which are published as supporting information on the PNAS web site). Conversely, we observed significant enrichment of genes directly targeted by NOTCH1 in the top rank of sequences down-regulated by γ-secretase inhibition (P = 0.04) (Fig. 3d). The high frequency of NOTCH1 direct targets among the top-ranking genes regulated by GSI (Fig. 3d) demonstrates a close relationship between NOTCH1 signaling inhibition and the transcriptional changes induced by GSI treatment. In addition, functional annotation of these top-ranked direct targets of NOTCH1 regulated by GSI revealed a marked overrepresentation of genes involved in macromolecule metabolism (33%, P = 0.0009) and protein biosynthesis (P = 5.5 × 10⁻⁶) (Fig. 3e) in agreement with an important role of NOTCH1 in the control of cell growth.
NOTCH1 Directly Regulates c-MYC Expression.
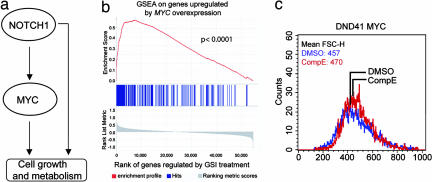
Remarkably, the c-MYC oncogene, whose product is a master regulator of cell growth, showed significant binding by NOTCH1 in our ChIP-on-chip analysis (P = 0.037) and was ranked among the top tier of genes down-regulated by GSI treatment in T-ALL, next to the NOTCH1 direct target gene DELTEX1 (Fig. 3c). Furthermore, shRNA knockdown of NOTCH1 induced down-regulation of c-MYC expression (Fig. 4a) and chromatin immunoprecipitation with two independent antibodies against NOTCH1 demonstrated direct NOTCH1 binding to the c-MYC promoter (Fig. 4b). These results are in agreement with those of Satoh et al. (12), who demonstrated the presence of regulatory elements controlled by Notch1 in the mouse c-Myc promoter, and with recent results by Klinakis et al. (13) and Weng et al. (14) showing an interaction between Notch1 and c-Myc in mouse breast tumors and leukemia, respectively. Moreover, Western blot analysis showed a gradual reduction of c-MYC protein levels in T-ALL cells after γ-secretase inhibition (Fig. 4c). These findings suggest that NOTCH1 signaling drives a c-MYC mediated transcriptional feed-forward loop promoting cellular growth and metabolism (Fig. 5a). However, the slow kinetics of c-MYC down-regulation upon GSI treatment suggests that NOTCH1 accounts only for a fraction of c-MYC expression in T-ALL cells and are consistent with the delayed (3–6 days) occurrence of reduced cell size and cell cycle arrest in T-ALL cells treated with GSIs (Figs. 2 and 8) (5, 14, 15).
Fig. 5.
NOTCH and c-MYC constitute a feed-forward regulatory network motif controlling cell growth. (a) Structure of the NOTCH1 feed-forward-loop regulatory motif controlling c-MYC and cell growth genes. (b) NOTCH1 inhibition with GSI in T-ALL cells switches off genes up-regulated by forced expression of c-MYC in T cell lymphoblasts. Graphic representation of the GSEA enrichment score and distribution of c-MYC-regulated genes along the rank of GSI-regulated transcripts. (c) Retroviral expression of c-MYC in DND41 rescues cell growth after GSI treatment. Cell size was estimated by flow cytometry in DND41 cells infected with pBMN c-MYC IRES GFP retrovirus growing in the presence of CompE or vehicle (DMSO) for 4 days.
To test this hypothesis we analyzed the overlap between the transcriptional effects of NOTCH1 and a signature of c-MYC-regulated genes generated by microarray analysis of T cell lymphoblasts expressing this transcription factor oncogene (16). Gene set enrichment analysis (GSEA) can be used to test the enrichment of a set of features (c-MYC-regulated genes) in a list of genes ranked based on the closeness of the association of their expression changes with a particular group of samples (GSI-treated samples). This analysis demonstrated that genes regulated by forced expression of c-MYC in T cell lymphoblasts, including multiple biochemically validated c-MYC targets, were highly enriched among the top ranking genes regulated by GSI treatment (P = 0.0001) (Fig. 5b); underscoring the close functional relationship between NOTCH1 signaling and c-MYC regulation.
Based on these results we postulated that forced expression of c-MYC in T-ALL cells treated with GSI should restore, at least in part, the cell growth transcriptional program activated by oncogenic NOTCH1. To test this hypothesis we analyzed the effects of GSI treatment in DND41 cells infected with a c-MYC expressing retrovirus or GFP controls. Our results demonstrate that forced expression of c-MYC can effectively abrogate the reduction in cell size (Fig. 5c) typically induced by NOTCH1 inactivation in this T-ALL line (Fig. 2).
Reverse Engineering of Transcriptional Networks in T-ALL.
To further interrogate the transcriptional effects of NOTCH1 and c-MYC in T-ALL, we performed reverse engineering of microarray expression data to generate an ARACNe (Algorithm for the Reconstruction of Accurate Cellular Networks) global transcriptional network using the mutual information (MI) algorithm. This analysis establishes the relationship between different genes based on their pattern of expression across multiple experimental conditions and has previously been shown to accurately reproduce the complex transcription interactions regulating cell homeostasis in mammalian cells (17). Analysis of the c-MYC hub demonstrated that numerous c-MYC first neighbor genes in our T-ALL network were identical to previously reported c-MYC-regulated genes, consistent with previous results from ARACNe analysis in B-cell lymphomas (17) (Table 3, which is published as supporting information on the PNAS web site). Because reconstruction of NOTCH1-controlled transcriptional circuits depends on the levels of activated NOTCH1 protein rather than NOTCH1 transcript levels, we measured activated NOTCH1 levels by Western blot analysis in T-ALL cell lines. This information was used to build a pattern of gene expression or metagene from microarray expression data to serve as a surrogate for activated NOTCH1 protein levels in the analysis of global transcriptional networks. Integration of this NOTCH1 metagene into an ARACNe transcriptional network, constructed with data from 103 microarray measurements (99 primary T-ALLs, 3 T-ALL cell lines, 1 normal thymus) identified 58 genes that were directly connected to this surrogate signature of activated NOTCH1 signaling (i.e., inferred first-neighbors of NOTCH1) (Fig. 6a). Strikingly, NOTCH1 first-neighbor genes were significantly enriched in the rank of γ-secretase-regulated genes by GSEA (P < 0.004) and included 11 NOTCH1 direct target genes identified by ChIP-on- chip (P = 0.0059) (Fig. 6 b and c). Functional annotation of these NOTCH1-associated genes revealed a marked overrepresentation of genes involved in cellular and protein biosynthesis (48%, P = 8.56 × 10⁻¹⁸ and 38%, P = 8.13 × 10⁻¹⁷, respectively). Additionally, ARACNe analysis showed a close relationship between the NOTCH1 metagene and c-MYC (MI = 0.2692 P < 2 × 10⁻⁷). Importantly, the direct association between the NOTCH1 metagene and c-MYC is filtered in the graphic representation of the NOTCH1 and c-MYC transcriptional hubs, because 12 of the transcripts directly connected with both the NOTCH1 metagene and c-MYC (Fig. 6d). Indeed, 9 of the 12 genes comprising this common interface encoded components of primary metabolic pathways involved in cell growth (P = 0.009), such as ribosomal proteins and chaperones. The strong connectivity between the NOTCH1 metagene and c-MYC, as well as the enrichment for common neighbors of NOTCH1 and c-MYC in our ARACNe network (P = 2.35 × 10−52), is in agreement with a feed-forward-loop transcriptional network motif and further supports the highly synergistic role of these two transcription factor oncogenes in the regulation of thymocyte cell growth.
Fig. 6.
Activated NOTCH1 and c-MYC regulatory network in T-ALL. (a) A metagene based on the gene expression signature associated with levels of activated NOTCH1 protein in T-ALL cell lines was integrated in an ARACNe global regulatory network constructed with microarray expression data from T-ALL samples. Neighbors of the NOTCH1 metagene identified as NOTCH1 direct target genes by ChIP-on-chip are shaded in pink, neighbors regulated in T-ALL cells treated with a GSI are shown shaded in blue, and neighbor genes showing both significant promoter occupancy by ChIP-on-chip and regulation upon GSI treatment are shaded in purple. (b) Detailed representation of overlap between NOTCH1 neighbor genes and ChIP-on-chip data. The intensity of each neighboring node represents the significance level of promoter occupancy by NOTCH1. (c) Detailed representation of NOTCH1 neighbor genes regulated in T-ALL cells treated with a GSI. The intensity of each neighboring node, corresponding to the scale panel on the right, represents the significance level of gene regulation by GSI treatment. (d) Representation of direct neighbor genes associated with the NOTCH1 metagene and with c-MYC.
Discussion
Oncogenic transcription factors promote tumor formation by activating transcriptional networks that link coregulated genes important in cell homeostasis. Thus, aberrant cell proliferation, increased survival and increased cell mass, induced by the dysregulation of metabolic pathways during malignant transformation, constitute mainstay characteristics of tumor cells (18).
The canonical NOTCH1 signaling pathway is thought to operate as a signal transduction pipeline that transmits information from developmentally important extracellular signals from the cell surface directly to the nucleus. NOTCH1 signaling plays essential roles in the thymus as regulator of T cell lineage commitment and thymocyte development. Furthermore, constitutive activation of NOTCH1 due to chromosomal translocations or mutations is strongly oncogenic (4, 5). However, the transcriptional programs through which NOTCH1 exerts its potent effects on thymocyte homeostasis and T cell transformation have not been established.
Using a combination of gene expression profiling and ChIP-on-chip analysis we have demonstrated that NOTCH1 is a direct regulator of biosynthesis pathways controlling cell growth and metabolism. Furthermore, pharmacologic inhibition of NOTCH1 signaling at the membrane with GSIs or by shRNA knockdown impairs the growth of T cell lymphoblastic leukemia cells. Importantly, this analysis also identified c-MYC, a master regulator of multiple biosynthesis and metabolic pathways (19), as a direct target gene regulated by NOTCH1. Reverse engineering of transcriptional networks from microarray expression data demonstrated that NOTCH1 signaling and c-MYC are closely related and share numerous target genes. These results demonstrate that the interaction between NOTCH1 and c-MYC composes a feed-forward-loop transcriptional regulatory motif regulating leukemic cell growth (Fig. 11, which is published as supporting information on the PNAS web site). In agreement with this model, NOTCH and c-MYC-regulated genes were broadly overlapping and forced expression of c-MYC was able to rescue the deleterious effects of NOTCH1 inhibition by GSI treatment on the growth of T-ALL cells.
The identification of NOTCH1 as direct regulator of cell growth genes highlights the role of this transcription factor in T cell transformation and provides a mechanism that couples cell metabolism and cell cycle progression with developmental decisions in lymphocyte development. Overall, our identification of c-MYC as a direct target gene regulated by NOTCH1 in T-ALL highlights the importance of this interaction in the pathogenesis of human cancer. We predict that the intensity of input signals that enter the NOTCH1-MYC feed-forward regulatory circuitry upstream of c-MYC may tune the cell growth response to NOTCH1 activation and may potentially enhance or attenuate the antitumor effect of drugs targeting NOTCH1 signaling. Finally, the expression data and ChIP-on-chip analysis reported here show that NOTCH1 regulates multiple genes in important developmental signaling pathways and transcriptional networks. Further studies are warranted to test the significance of these interactions in T cell development and transformation.
Materials and Methods
DNA Microarray Analysis.
Samples for microarray analysis were prepared according to the manufacturer's instructions and as described (17).
Significant changes in gene expression associated with GSI treatment were estimated by using one-sample t test with 13 degrees of freedom after normalization of expression levels with respect to mock-treated controls.
Functional annotation based on the Gene Ontology classification was performed with the DAVID tool (20).
GSEA was performed on normalized expression data as described (21).
An ARACNe mutual information network (17) was built based on a large panel of data from primary human T-ALL samples (n = 99), cell lines (n = 3), and normal thymus (n = 1) using Human U133A GeneChip data (22) after GC-RMA array normalization. A metagene entry proportional to the concentration of activated NOTCH1 protein in the nucleus was constructed by using stepwise regression from quantitative measurements of ICN1 protein level in T-ALL cell lines, was integrated into the microarray gene expression profile measurements, and was used to build an ARACNe network for the NOTCH1 signaling hub (23).
ChIP-on-Chip Analysis.
Complete protocols are available for download in pdf format at http://web.wi.mit.edu/young/NOTCH1. Typically, 5 × 10⁷ to 1 × 10⁸ HPB-ALL were used per chromatin immunoprecipitation.
Quantitative ChIP Analysis.
Relative quantitation by real-time PCR of promoter sequences were normalized to β-actin levels in chromatin immunoprecipitates performed with antibodies against NOTCH1 or IgG.
Western Blot Analysis.
Antibodies against activated NOTCH1 (Val 1744, Cell Signaling) c-MYC (N-262, Santa Cruz Biotechnology) and α-tubulin (TU-02, Santa Cruz Biotechnology) were used according to standard procedures. Activated NOTCH1 protein levels relative to tubulin expression were calculated by using infrared detection with the Odyssey detector (LI-COR Biosciences).
Cell Size Assays.
Changes in cell size induced by GSI treatment were monitored by flow cytometry in asynchronous cell populations and in cells in G1 phase of the cell cycle (2N DNA content by Draq5 staining).
shRNA Knockdown.
Oligo sequences for shRNAs targeting NOTCH1 (9) or the luciferase gene were cloned in the pLKO-puro and pGK-GFP lentiviral vectors (gift from William Hahn of the Dana–Farber Cancer Institute). Lentivirus production and infections were performed as described (24).
A detailed description of ChIP-on-chip, expression and network analysis is provided in Supporting Methods, which is published as supporting information on the PNAS web site.
Supplementary Material
Acknowledgments
A.A.F. was supported by the WOLF Foundation, the Elsa U. Pardee Foundation, the Golfers Against Cancer Foundation, the Children's Leukemia Research Association, and the Pollin Research Award; A.C. was supported by National Cancer Institute Grant 1R01CA109755-01A1, National Institute of Allergy and Infectious Diseases Grant 1R01AI066116-01, and National Institutes of Health Roadmap National Centers for Biomedical Computing Initiative Grant 1U54CA121852-01A1; and A.M. was supported by National Library of Medicine University Medical Informatics Research Training Program Grant 5 T15 LM007079-13.
Abbreviations
- CompE
Compound E
- GSEA
gene set enrichment analysis
- GSI
γ-secretase inhibitor
- ICN1
intracellular NOTCH1
- T-ALL
T cell acute lymphoblastic leukemia.
Footnotes
The authors declare no conflict of interest.
This article is a PNAS direct submission.
References
- 1.Struhl G, Greenwald I. Proc Natl Acad Sci USA. 2001;98:229–234. doi: 10.1073/pnas.011530298. [DOI] [PMC free article] [PubMed] [Google Scholar]
- 2.Hansson EM, Lendahl U, Chapman G. Semin Cancer Biol. 2004;14:320–328. doi: 10.1016/j.semcancer.2004.04.011. [DOI] [PubMed] [Google Scholar]
- 3.Allman D, Aster JC, Pear WS. Immunol Rev. 2002;187:75–86. doi: 10.1034/j.1600-065x.2002.18707.x. [DOI] [PubMed] [Google Scholar]
- 4.Ellisen LW, Bird J, West DC, Soreng AL, Reynolds TC, Smith SD, Sklar J. Cell. 1991;66:649–661. doi: 10.1016/0092-8674(91)90111-b. [DOI] [PubMed] [Google Scholar]
- 5.Weng AP, Ferrando AA, Lee W, Morris JP IV, Silverman LB, Sanchez-Irizarry C, Blacklow SC, Look AT, Aster JC. Science. 2004;306:269–271. doi: 10.1126/science.1102160. [DOI] [PubMed] [Google Scholar]
- 6.Weng AP, Nam Y, Wolfe MS, Pear WS, Griffin JD, Blacklow SC, Aster JC. Mol Cell Biol. 2003;23:655–664. doi: 10.1128/MCB.23.2.655-664.2003. [DOI] [PMC free article] [PubMed] [Google Scholar]
- 7.O'Neil J, Calvo J, McKenna K, Krishnamoorthy V, Aster JC, Bassing CH, Alt FW, Kelliher M, Look AT. Blood. 2006;107:781–785. doi: 10.1182/blood-2005-06-2553. [DOI] [PMC free article] [PubMed] [Google Scholar]
- 8.Seiffert D, Bradley JD, Rominger CM, Rominger DH, Yang F, Meredith JE, Jr, Wang Q, Roach AH, Thompson LA, Spitz SM, et al. J Biol Chem. 2000;275:34086–34091. doi: 10.1074/jbc.M005430200. [DOI] [PubMed] [Google Scholar]
- 9.Delaney C, Varnum-Finney B, Aoyama K, Brashem-Stein C, Bernstein ID. Blood. 2005;106:2693–2699. doi: 10.1182/blood-2005-03-1131. [DOI] [PMC free article] [PubMed] [Google Scholar]
- 10.Odom DT, Zizlsperger N, Gordon DB, Bell GW, Rinaldi NJ, Murray HL, Volkert TL, Schreiber J, Rolfe PA, Gifford DK, et al. Science. 2004;303:1378–1381. doi: 10.1126/science.1089769. [DOI] [PMC free article] [PubMed] [Google Scholar]
- 11.Zhang X, Odom DT, Koo SH, Conkright MD, Canettieri G, Best J, Chen H, Jenner R, Herbolsheimer E, Jacobsen E, et al. Proc Natl Acad Sci USA. 2005;102:4459–4464. doi: 10.1073/pnas.0501076102. [DOI] [PMC free article] [PubMed] [Google Scholar]
- 12.Satoh Y, Matsumura I, Tanaka H, Ezoe S, Sugahara H, Mizuki M, Shibayama H, Ishiko E, Ishiko J, Nakajima K, Kanakura Y. J Biol Chem. 2004;279:24986–24993. doi: 10.1074/jbc.M400407200. [DOI] [PubMed] [Google Scholar]
- 13.Klinakis A, Szabolcs M, Politi K, Kiaris H, Artavanis-Tsakonas S, Efstratiadis A. Proc Natl Acad Sci USA. 2006;103:9262–9267. doi: 10.1073/pnas.0603371103. [DOI] [PMC free article] [PubMed] [Google Scholar]
- 14.Weng AP, Millholland JM, Yashiro-Ohtani Y, Arcangeli ML, Lau A, Wai C, Del Bianco C, Rodriguez CG, Sai H, Tobias J, et al. Genes Dev. 2006;20:2096–2109. doi: 10.1101/gad.1450406. [DOI] [PMC free article] [PubMed] [Google Scholar]
- 15.Palomero T, Barnes KC, Real PJ, Bender JL, Sulis ML, Murty VV, Colovai AI, Balbin M, Ferrando AA. Leukemia. 2006;20:1279–1287. doi: 10.1038/sj.leu.2404258. [DOI] [PubMed] [Google Scholar]
- 16.Marinkovic D, Marinkovic T, Kokai E, Barth T, Moller P, Wirth T. Nucleic Acids Res. 2004;32:5368–5378. doi: 10.1093/nar/gkh877. [DOI] [PMC free article] [PubMed] [Google Scholar]
- 17.Basso K, Margolin AA, Stolovitzky G, Klein U, Dalla-Favera R, Califano A. Nat Genet. 2005;37:382–390. doi: 10.1038/ng1532. [DOI] [PubMed] [Google Scholar]
- 18.Hahn WC, Weinberg RA. Nat Rev Cancer. 2002;2:331–341. doi: 10.1038/nrc795. [DOI] [PubMed] [Google Scholar]
- 19.Lee LA, Dang CV. Curr Top Microbiol Immunol. 2006;302:145–167. doi: 10.1007/3-540-32952-8_6. [DOI] [PubMed] [Google Scholar]
- 20.Dennis G, Jr, Sherman BT, Hosack DA, Yang J, Gao W, Lane HC, Lempicki RA. Genome Biol. 2003;4:P3. [PubMed] [Google Scholar]
- 21.Subramanian A, Tamayo P, Mootha VK, Mukherjee S, Ebert BL, Gillette MA, Paulovich A, Pomeroy SL, Golub TR, Lander ES, Mesirov JP. Proc Natl Acad Sci USA. 2005;102:15545–15550. doi: 10.1073/pnas.0506580102. [DOI] [PMC free article] [PubMed] [Google Scholar]
- 22.Soulier J, Clappier E, Cayuela JM, Regnault A, Garcia-Peydro M, Dombret H, Baruchel A, Toribio ML, Sigaux F. Blood. 2005;106:274–286. doi: 10.1182/blood-2004-10-3900. [DOI] [PubMed] [Google Scholar]
- 23.Margolin AA, Nemenman I, Basso K, Wiggins C, Stolovitzky G, Dalla Favera R, Califano A. BMC Bioinformat. 2006;7(Suppl 1):S1–S7. doi: 10.1186/1471-2105-7-S1-S7. [DOI] [PMC free article] [PubMed] [Google Scholar]
- 24.Moffat J, Grueneberg DA, Yang X, Kim SY, Kloepfer AM, Hinkle G, Piqani B, Eisenhaure TM, Luo B, Grenier JK, et al. Cell. 2006;124:1283–1298. doi: 10.1016/j.cell.2006.01.040. [DOI] [PubMed] [Google Scholar]
Associated Data
This section collects any data citations, data availability statements, or supplementary materials included in this article.


