Abstract
Scavenger receptor BI (SR-BI) mediates the selective uptake of high density lipoprotein (HDL) cholesteryl esters (CE) by cells, i.e., the uptake of CE without degradation of HDL protein. Mice with attenuated expression of SR-BI, because of targeted gene mutation (SR-BIatt mice), have increased plasma HDL levels as a result of decreased selective uptake in the liver. To further evaluate the role of SR-BI in lipoprotein metabolism, compound apolipoprotein E knock-out (apoE0)/SR-BIatt mice were bred. Hepatic SR-BI protein was increased (2.3-fold) in apoE0 mice compared with wild type (wt) and was reduced significantly in apoE0/SR-BIatt mice. However, the plasma lipoprotein profile of apoE0 and apoE0/SR-BIatt mice was identical. This was explained by HDL turnover studies that revealed that the selective clearance of HDL CE by the liver and adrenal was already profoundly impaired in apoE0 mice compared with wt (28% of wt in liver). A similar decrease in selective uptake was seen when apoE0 HDL was incubated with isolated apoE0 hepatocytes. The results suggest that apoE plays a major role in the selective clearance of HDL CE by the liver and adrenal gland, possibly by facilitating the presentation of HDL to SR-BI at the cell surface.
Increased levels of plasma high density lipoproteins (HDL) protect against the development of atherosclerosis in mice and humans (1–3), possibly as a result of enhanced reverse cholesterol transport, i.e., transfer of cholesterol from the arterial wall to the liver, followed by excretion into bile (4–7). A major route for transport of HDL cholesteryl esters (CE) in rodents involves the selective uptake of CE in liver and steroidogenic tissues, i.e., the cellular uptake of HDL CE without degradation of HDL protein (8, 9).
Recently, a member of the CD36 gene family, scavenger receptor BI (SR-BI), was shown to mediate HDL CE selective uptake in cultured cells (10, 11) and in mice (12, 13). SR-BI is highly expressed in liver and steroidogenic tissues (14–16), the principal sites of selective uptake in vivo (12, 13). Overexpression of SR-BI by transgenesis results in reduced levels of HDL CE and protein, increased selective uptake of HDL CE in the liver, and increased biliary cholesterol content (17, 18). Reduced SR-BI expression as a result of targeted gene mutation leads to markedly increased levels of HDL cholesteryl ester and apolipoprotein E (apoE) (12, 13) and decreased selective uptake of HDL CE in liver (13). Although the human homolog of SR-BI seems highly expressed in tissues (19), the overall role of selective uptake in humans is uncertain.
ApoE knock-out (apoE0) mice have increased plasma cholesterol levels, because of the accumulation of chylomicron remnants in plasma (20, 21), and develop spontaneous atherosclerosis. These mice have proven invaluable in mechanistic studies of plasma lipoprotein metabolism, atherogenesis, and Alzheimer’s disease (22–24). To further evaluate the effects of reduced SR-BI expression on plasma lipoprotein metabolism, we have prepared compound mutant mice by crossing apoE0 and SR-BIatt (mice with attenuated expression of SR-BI) strains. Our initial studies revealed a surprising lack of a lipoprotein phenotype in the compound mutants. This was explained subsequently by turnover studies that showed that HDL CE selective uptake is already severely impaired in apoE0 mice, so that reduced SR-BI expression in the apoE0/SR-BIatt strain has no impact on plasma lipoproteins levels. These studies suggest a novel role of apoE in facilitating HDL CE selective uptake in vivo.
Experimental Procedures
Animals.
SR-BIatt chimeras, derived from blastocyst injection of 129/Sv ES cells, were bred with 129/Sv apoE0 mice to generate mice heterozygous for both the apoE and SR-BI mutations. The double heterozygotes were back-crossed to apoE0 mice to produce SR-BIatt heterozygous/apoE0 mice, which then were interbred to generate control apoE0 and doubly homozygous apoE0/SR-BIatt mice in the 129/Sv background. HDL turnover studies in wild-type (wt) mice were performed in the 129/Sv or C57BL/6 strains, with similar results. All experiments were performed by using chow-fed female mice.
Plasma Lipoprotein Analysis.
Food was removed from the cages at 9 a.m., and blood was drawn after a 5-h fast. Total plasma cholesterol, free cholesterol, triglycerides, and phospholipid were determined by using commercial enzymatic assays (Wako) (16). Plasma lipoproteins were analyzed by FPLC by using two Superose 6 columns connected in series (Amersham Pharmacia) (25). Very low density lipoprotein (VLDL) + intermediate density lipoprotein (IDL) (density < 1.0019 g/ml), low density lipoprotein (LDL) (density = 1.019–1.055 g/ml), and HDL (density = 1.055–1.21 g/ml) were prepared by sequential preparative ultracentrifugation of pooled mouse plasma and analyzed by electrophoresis in SDS/4–20% polyacrylamide gradient gels.
HDL Catabolism.
HDL was prepared by ultracentrifugation in the density range of 1.063–1.21 g/ml from plasma of apoE0 and apoE0/SR-BIatt mice and radiolabeled in the protein moiety with 125I-labeled N-methyltyramine cellobiose (125I-labeled NMTC) (26) and in the CE moiety with [3H]cholesteryl oleyl ether (Amersham Pharmacia) as described (27). As determined by SDS/PAGE and phosphorimaging, protein label was found in wt in apoAI (74%), apoCs (9%), apoE (7%), apoAIV (3%), and albumin (7%) and in apoE0 in apoAI (62%), apoCs (12%), apoE (0%), apoAIV (13%), and albumin (12%).
Experiments to determine the plasma decay of both HDL tracers and their tissue sites of uptake were performed as described previously (8, 27). Food was removed 4 h before tracer injection and animals were fasted throughout the 24-h study period but had free access to water. Autologous radiolabeled HDL was injected at 10:00 a.m. in an iliac vein, and blood samples were drawn from the tail vein of each animal at 0.08, 0.5, 2.0, 5.0, 9.0, 22.0, and 24.0 h postinjection. The injections of radiolabeled HDL were done under anesthesia by using ketamine and xylazine. Plasma fractional catabolic rates (FCRs) were calculated by using a two-compartment model (28). Organ FCRs, representing the fraction of the plasma pool of the traced HDL component cleared per hour by an organ, were calculated as the plasma FCR fraction of total tracer (%) recovered in a specific organ (8, 27).
Western Blot Analysis.
Western blot analysis for SR-BI was performed with homogenized liver tissue. Small pieces of liver were homogenized on ice in 20 mM Tris⋅HCl buffer (pH 7.5) with proteinase inhibitors (10 μg/ml leupeptin, 20 μg/ml aprotinin, 5 μg/ml pepstatin A, 0.2 mM PMSF, 5 mM EDTA) and spun at 600 × g for 10 min to remove debris. Equal quantities of protein (25 μg per lane) from the soluble fraction were subjected to SDS/7.5% PAGE under reducing conditions. SR-BI protein immunoreactivity was identified by SR-BI polyclonal antibody (Novus Biologicals, Littleton, CO).
Hepatocyte Isolation.
Hepatocytes were isolated according to Honkakoski and Negishi (29), with the following modifications: Complete protease inhibitor was added according to the manufacturer’s instructions (Boehringer Mannheim) to digestion buffer.
Uptake of Doubly Radiolabeled HDL by Mouse Hepatocyte.
To measure the uptake of HDL, doubly radiolabeled HDL was incubated in binding buffer [10 mM Hepes/0.5% BSA/Williams’ medium E (Life Technologies, Grand Island, NY), pH 7.4] with freshly isolated hepatocytes in suspension in 12-well tissue culture plates for 1 h at 37°C with slow shaking. After the 1-h incubation period, cells were washed by centrifugation once with Binding Buffer and then two times with Williams’ medium E. The cells were lysed and dissolved with 0.1 M NaOH/0.1% SDS. The protein level was determined by the Lowry method, and 125I and 3H radioactivity also was analyzed.
Statistical Analysis.
All results are shown as mean ± SD. Statistical analysis was performed by two-tailed Student’s t test for unpaired data.
Results
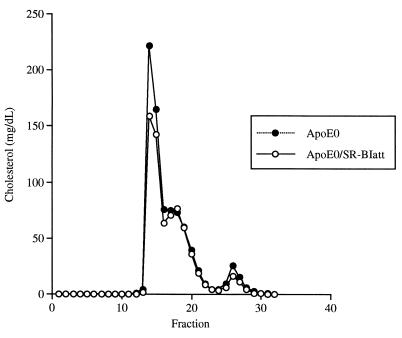
Plasma lipid levels in apoE0 mice (129/Sv) were somewhat higher than previously reported in other strains (20, 30), but were not significantly different in apoE0/SR-BIatt mice compared with apoE0 (Table 1). Analysis of plasma lipoproteins by FPLC showed no reproducible difference between apoE0 and apoE0/SR-BIatt mice; this experiment was repeated on three occasions by using pools of plasma from three to five mice (once in males and twice in females) (Fig. 1). Similarly, analysis of plasma apolipoproteins by SDS/PAGE of centrifugally isolated lipoproteins showed no difference between mice of the two genotypes (not shown).
Table 1.
Plasma lipid concentration of SR-BIatt mice in apoE0 background
| Lipid | Conc., mg/dl
|
|
|---|---|---|
| apoE0 | apoE0/SR-BIatt | |
| TC | 824 ± 171 | 691 ± 64 |
| FC | 583 ± 114 | 488 ± 57 |
| CE | 241 ± 59 | 202 ± 14 |
| TG | 368 ± 88 | 322 ± 79 |
| PL | 995 ± 171 | 865 ± 29 |
Plasma was collected and lipid concentrations were determined as described in Experimental Procedures. The data are shown as mean ± SD, n = 5 female mice in each group. TC, total cholesterol; FC, free cholesterol; TG, triglyceride; PL, phospholipid.
Figure 1.
FPLC cholesterol profile. FPLC was performed with 200-μl pooled plasma samples obtained from five female mice. The cholesterol content of each fraction is indicated as the equivalent cholesterol concentration in plasma (mg/dl).
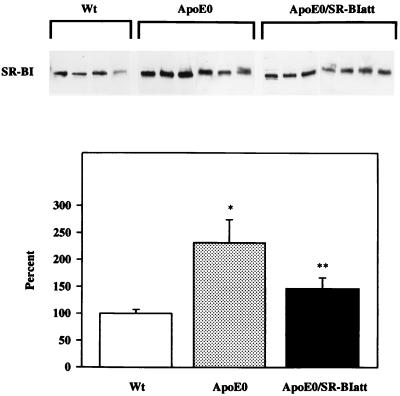
In SR-BIatt mice, hepatic SR-BI concentration is reduced by approximately 50%, reflecting insertion of the targeting construct into the promoter of SR-BI (13). Thus, we considered the possibility that the lack of lipoprotein phenotype in the compound mutants was due to an overriding effect of the apoE0 background on the SR-BI promoter mutation. Analysis of hepatic SR-BI protein by Western blotting showed that SR-BI protein was increased by 2.3-fold in apoE0 mice (129/Sv) compared with wt controls (C57BL/6) (P < 0.001) (Fig. 2) and 2.0-fold in apoE0 vs. wt (n = 5, P < 0.01), both in the C57BL/6 background. However, the SR-BI mRNA level was unchanged in apoE0 mice (data not shown). Compared with apoE0 mice, apoE0/SR-BIatt mice had a significant 35% reduction in SR-BI concentration (P < 0.01) (Fig. 2). Thus, we found an increase in SR-BI protein in apoE0 mice and a decrease in apoE0/SR-BIatt mice to levels similar to wt. A similar percentage reduction in SR-BI concentration resulted in a 50–75% increase in HDL levels (13), yet no change in HDL levels was observed in apoE0/SR-BIatt mice.
Figure 2.
Western blot analysis of SR-BI expression in liver. (Upper) Immunoblots obtained for individual mice (30 μg of total protein per lane). (Lower) Arbitrary units of mass determined by densitometric scanning, relative to wt mice (100%). Statistical significance: ∗, P < 0.001 compared with wt; ∗∗, P < 0.05 compared with wt and apoE0 mice. Similar results were obtained after normalization of the SR-BI signal for tubulin expression.
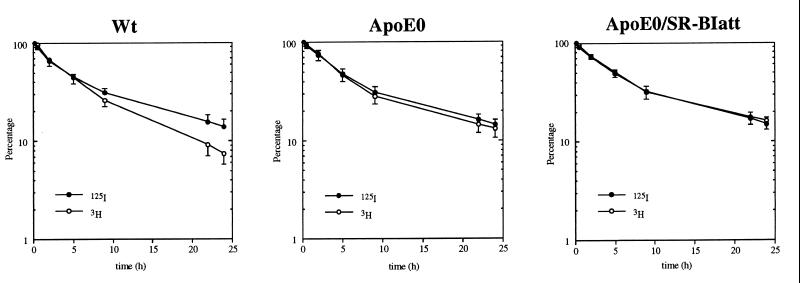
We next considered the possibility that the lack of lipoprotein phenotype in the compound mutants was due to an essential role of apoE in selective uptake of HDL-associated CE; thus, if SR-BI function was already impaired in apoE0 mice, reduction in SR-BI expression in SR-BIatt mice might not affect plasma lipoprotein levels. Turnover studies in wt mice, using doubly labeled HDL, showed that the CE label is removed more rapidly from plasma than the protein label (Fig. 3 and Table 2), indicating selective removal of CE from plasma HDL. In apoE0 mice, the removal of CE was slower than in wt and CE was removed only slightly faster than protein, indicating very little selective removal of HDL CE from plasma. In apoE0/SR-BIatt mice, HDL CE and protein removal curves were identical, showing abolition of selective removal of CE. To rule out a genetic background effect, FCRs also were analyzed in 129/Sv mice (wt). These were similar to C57BL/6 mice (protein, 0.071 ± 0.018 pool/h; CE, 0.136 ± 0.024 pool/h; 3H − 125I, 0.065 ± 0.009 pool/h; cf. Table 2). The decreased clearance of CE from plasma in apoE0 mice could reflect transfer to the slowly turning-over VLDL pool. However, we found that 30 min after injection only 1.9% (wt) and 5.6% (apoE0) of 3H radioactivity was in the density <1.020 g/ml fraction. Slightly more 125I radioactivity was transferred to this fraction in apoE0 mice (1.2% wt; 13.9% apoE0).
Figure 3.
Plasma decay curves for 125I-labeled NMTC/[3H]cholesteryl oleyl ether-labeled HDL. Mice were injected with doubly labeled HDL and blood was collected periodically over 24 h. Autologous HDL was injected into apoE0 and apoE0/SR-BIatt mice. HDL from apoE0 mice was injected into wt mice. The values are means ± SD of four wt (C57BL/6), six apoE0, and seven apoE0/SR-BIatt mice.
Table 2.
Plasma fractional catabolic rates for 125I-labeled NMTC/[3H]cholesteryl oleyl ether-labeled HDL in SR-BIatt mice with apoE-deficient background
| Mice | 125I-labeled NMTC protein, pool/h | [3H]Cholesteryl oleyl ether, pool/h | 3H − 125I, pool/h |
|---|---|---|---|
| wt | 0.094 ± 0.010 | 0.141 ± 0.015 | 0.047 ± 0.014 |
| apoE0 | 0.068 ± 0.022 | 0.080 ± 0.029** | 0.012 ± 0.012** |
| SR-BIatt/apoE0 | 0.070 ± 0.018* | 0.068 ± 0.020*** | −0.002 ± 0.004** |
Blood was collected periodically from four wt, five female apoE0, and seven female apoE0/SR-BIatt mice over 24 h after injection of labeled autologous HDL. The values are means ± SD. The asterisks denote statistical significance: *, P < 0.05; **, P < 0.01; and ***, P < 0.001, respectively, between wt and apoE or apoE0/SR-BIatt by two-tailed Student’s t test for unpaired data.
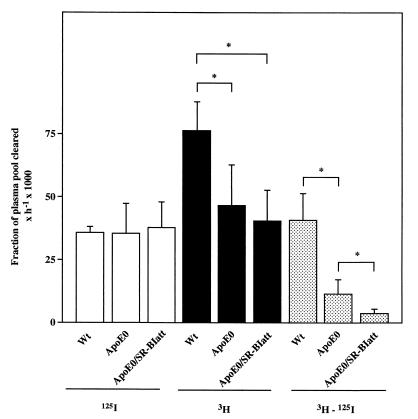
The differential removal of HDL CE and protein radiotracers from plasma does not necessarily indicate differences in tissue-selective uptake (31, 32). Thus, the uptake of the nondegradable lipid and protein radiotracers in tissues also was determined. In wt mice, a major part of the hepatic removal of HDL CE was due to selective uptake (3H − 125I) (Fig. 4) (13, 33). ApoE0 mice showed a marked reduction of hepatic clearance of HDL CE without any change in HDL protein clearance, indicating a 72% reduction in selective removal of HDL CE in the liver (Fig. 4). In apoE0/SR-BIatt mice, there was a further significant reduction of selective uptake by the liver, almost to zero (Fig. 4). Similar results were obtained in the adrenal gland, where the selective uptake process is even more prominent than in the liver (not shown). In this case, selective uptake was reduced by 56% in apoE0 mice compared with wt and was further significantly reduced to 12% of wt in apoE0/SR-BIatt mice.
Figure 4.
Uptake of labeled HDL by the liver. Liver FCRs, calculated as described in Experimental Procedures, are shown for uptake of labeled protein (125I, open bars) and cholesteryl ether (3H, solid bars). The hatched bars represent selective CE uptake (3H − 125I). ∗, P < 0.05.
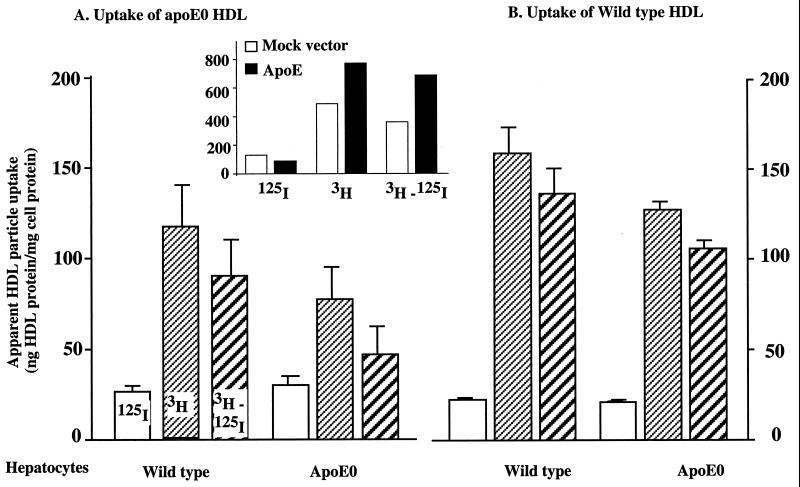
To analyze the mechanisms of decreased selective uptake in apoE0 mice, fresh primary hepatocytes from wt or apoE0 mice were incubated with both wt and apoE0 HDL. Protein uptake was similar in all experiments (Fig. 5). However, selective uptake was reduced by 70% in apoE0 HDL/apoE0 hepatocytes, compared with wt HDL/wt hepatocytes. Interestingly, selective uptake was increased significantly when apoE0 HDL was incubated with wt hepatocytes (E0 HDL/wt hepatocytes vs. E0 HDL/E0 hepatocytes) or when wt HDL was incubated with apoE0 hepatocytes (wt HDL/E0 hepatocytes vs. E0 HDL/E0 hepatocytes). Thus, the decrease in selective uptake in apoE0 mice is due to a defect in both HDL and hepatocytes. Next, we incubated pure recombinant human apoE3 (molar ratio of apoE/HDL was about 40) with HDL from apoE0 mice (with or without reisolation of HDL), but this did not lead to an increase in selective uptake (not shown). However, when hepatocytes were transiently transfected with an apoE3 expression vector, selective uptake was doubled (Fig. 5 Inset).
Figure 5.
Uptake of labeled HDL by isolated hepatocytes. Hepatocytes were isolated from wt and apoE0 mice. Cells were incubated with doubly labeled HDL (0.5 μg/ml) for 1 h at 37°C. (A) Specific uptake from apoE0 HDL by wt and apoE0 hepatocytes. (B) Specific uptake from wt HDL by wt and apoE0 hepatocytes. Selective uptake represents the difference (3H − 125I). Data were contained in four independent experiments in A and three in B, respectively. There are significant differences among apoE0 HDL/apoE0 hepatocyte vs. apoE0 HDL/wt hepatocyte (P < 0.05), wt HDL/apoE0 hepatocyte vs. apoE0 HDL/wt hepatocyte (P < 0.01), apoE0 HDL/apoE0 hepatocyte vs. wt HDL/wt hepatocyte (P < 0.05), and wt HDL/wt hepatocyte vs. wt HDL/apoE0 hepatocyte (P < 0.05). Inset shows the effect of human apoE cDNA transfection on selective uptake. Primary cultures of hepatocytes were transfected with human apoE3 expression plasmid or a mock plasmid by using Effectene (Qiagen). Uptake was measured after 4 h at 37°C.
Discussion
The present study shows markedly reduced selective uptake of HDL CE in the liver and adrenal in apoE0 mice, despite an increase in SR-BI protein levels. Although cell culture studies have provided conflicting results (34, 35), our findings suggest that apoE plays a major role in selective uptake in vivo. Earlier studies have shown that SR-BI is the principal mediator of HDL CE selective uptake in the liver (13, 17) and adrenal (11). Thus, it is likely that apoE facilitates selective uptake of HDL CE via SR-BI.
The large mass of VLDL in apoE0 mice could have played a role in the in vivo measurement of selective uptake. Although mice lack cholesteryl ester transfer protein, the possibility of increased transfer of HDL CE to the slowly turning-over pool of VLDL cannot be completely excluded, even though this appeared minor at an early time point. Also, there might be competition between VLDL and HDL for binding to SR-BI in apoE0 mice. However, studies with primary cultured hepatocytes provided a separate line of evidence for a defect in selective uptake from apoE0 HDL, independent of the VLDL pool (Fig. 5).
A number of different mechanisms could explain the role of apoE in facilitating HDL CE selective uptake. The first that was considered was that SR-BI expression was decreased in apoE0 mice, but the opposite result was found. A second possibility is that the HDL structure was altered in apoE0 mice in a general way that impaired interaction with SR-BI. However, in the present study the injection of HDL from apoE0 mice into wt animals (Fig. 3) gave selective uptake values very similar to earlier studies carried out with autologous wt HDL (13). Moreover, when apoE0 HDL was incubated with wt hepatocytes, selective uptake was partially restored, and transfection of apoE0 hepatocytes with an apoE expression vector increased selective uptake (Fig. 5). Because hepatocytes have a layer of apoE on their surface (36), this result could reflect association of HDL with apoE in the cell surface. Wild-type HDL (containing 7% of label in apoE) showed nearly normal selective uptake in apoE0 hepatocytes. Thus, we propose that apoE may facilitate the presentation of HDL to SR-BI at the cell surface. This may involve both apoE carried in HDL and a cell surface pool of apoE.
Studies of the ligand-binding properties of HDL in cells with marked overexpression of SR-BI show that a variety of HDL apolipoproteins can mediate binding to the receptor, suggesting a relative lack of ligand specificity (37). Thus, although a specific direct interaction of apoE and SR-BI is possible, it seems likely that other HDL apolipoproteins could assume this role in the absence of apoE. Therefore, apoE may facilitate presentation of HDL to SR-BI by an indirect mechanism. ApoE is well known to act as ligand for LDL receptors, LRP (LDL receptor-related protein), and cell surface proteoglycans and, thereby, has an important role in the clearance of remnants of triglyceride-rich lipoproteins in vivo (38–40). ApoE interacts directly with the LDL receptor and LRP and may also facilitate remnant lipoprotein presentation to these receptors by anchoring lipoproteins to cell surface proteoglycans. Although the mechanism by which apoE facilitates HDL CE selective uptake is unknown, we speculate that it might involve cooperative binding of CE- and apoE-rich HDL by SR-BI and other receptors recognizing apoE, such as LDL receptors, LRP, or proteoglycans. Such cooperative binding could lead to selective uptake of HDL CE by SR-BI and, perhaps, clearance of apoE by the other receptors. This mechanism is consistent with the prominent increase in apoE- and CE-rich HDL particles in SR-BI knock-out mice (12) and with a role of cell surface apoE in promoting selective CE uptake in HepG2 cells, shown by inhibition with apoE mAbs (34).
Swarnakar et al. (35) recently reported that overexpression of apoE in cultured adrenal cells led to increased selective uptake of LDL CE but not HDL CE. The difference with our results could be because hepatocytes have a lower level of SR-BI than adrenal cells and, thus, could have greater dependence on apoE to facilitate HDL interaction with SR-BI. Interestingly, apoE was effective only when presented by cell transfection and was ineffective when added exogenously (35). Similarly, we found that adding apoE to HDL exogenously did not increase selective uptake, perhaps indicating a failure to adapt a native conformation. However, when presented via cell transfection, apoE increased selective uptake in hepatocytes. The apparent effects of cell surface apoE on selective uptake (ref. 35 and Fig. 5) are reminiscent of the secretion–capture role of apoE, where apoE secreted by liver cells and retained on the cell surface appears to play a critical role in the removal of remnant lipoproteins from the circulation (41, 42).
In the present study, attenuated SR-BI expression in apoE0/SR-BIatt mice reduced SR-BI to levels comparable to wild-type mice and thus allows us to estimate the specific contribution of the up-regulation of SR-BI expression to selective uptake in apoE0 mice. The up-regulation contributed an amount at least equivalent to 19% of wild-type selective uptake in the liver (Fig. 4) and 32% in the adrenal (not shown). Although compensation was incomplete, when it was removed in the SR-BIatt mice the selective uptake fell virtually to zero. This change evidently was too small to affect plasma HDL levels. Because hepatic selective uptake was close to zero in apoE0/SR-BIatt mice, it is unlikely that complete deficiency of SR-BI would result in increased HDL levels in the apoE0 background.
Our studies provide potential insight into the perplexing finding that increased HDL levels in apoA-I transgenic/apoE0 mice cause a marked diminution of atherosclerosis (43), whereas reduced HDL levels do not influence atherogenesis in apoE0/apoA-I0 mice (44). In the latter case, the reduced HDL levels may be inconsequential, because reverse cholesterol transport by the selective uptake pathway is already severely impaired in apoE0 mice. In apoA-I transgenic/apoE0 mice, the 3- to 4-fold expansion of the HDL pool size might normalize HDL CE transport to the liver by the selective pathway. This pathway might be particularly important because it leads to an increased content of cholesterol in bile, suggesting net removal of cholesterol from the organism (17, 18).
Acknowledgments
The authors appreciate the help of X. Jiang, D. Silver, N. Wang, and R. Ramakrishnan. This work was supported by National Institutes of Health Grant HL58033.
Abbreviations
- CE
cholesteryl ester
- apo
apolipoprotein
- VLDL
very low density lipoproteins
- IDL
intermediate density lipoproteins
- LDL
low density lipoproteins
- HDL
high density lipoproteins
- SR-BI
scavenger receptor type B class I
- wt
wild type
- att
attenuated
- apoE0
apoE knock-out
- FCR
fractional catabolic rate
- NMTC
N-methyltyramine cellobiose
References
- 1.Rubin E M, Krauss R M, Spangler E A, Verstuyft J G, Clift S M. Nature (London) 1991;353:265–267. doi: 10.1038/353265a0. [DOI] [PubMed] [Google Scholar]
- 2.Benoit P, Emmanuel F, Caillaud J M, Bassinet L, Castro G, Gallix P, Fruchart J C, Branellec D, Denefle P, Duverger N. Circulation. 1999;99:105–110. doi: 10.1161/01.cir.99.1.105. [DOI] [PubMed] [Google Scholar]
- 3.Gordon D J, Rifkind B M. N Engl J Med. 1989;321:1311–1316. doi: 10.1056/NEJM198911093211907. [DOI] [PubMed] [Google Scholar]
- 4.Glomset J A. J Lipid Res. 1968;9:155–167. [PubMed] [Google Scholar]
- 5.Fielding P E, Miida T, Fielding C J. Biochemistry. 1991;30:8551–8557. doi: 10.1021/bi00099a009. [DOI] [PubMed] [Google Scholar]
- 6.Havel R J. Agents Actions Suppl. 1988;26:125–132. [PubMed] [Google Scholar]
- 7.Tall A R, Small D M. Adv Lipid Res. 1980;17:1–51. [PubMed] [Google Scholar]
- 8.Glass C, Pittman R C, Civen M, Steinberg D. J Biol Chem. 1985;260:744–750. [PubMed] [Google Scholar]
- 9.Rinninger F, Jaeckle S, Greten H, Windler E. Biochim Biophys Acta. 1993;1166:284–299. doi: 10.1016/0005-2760(93)90109-m. [DOI] [PubMed] [Google Scholar]
- 10.Acton S, Rigotti A, Landschulz K T, Xu S, Hobbs H H, Krieger M. Science. 1996;271:518–520. doi: 10.1126/science.271.5248.518. [DOI] [PubMed] [Google Scholar]
- 11.Temel R E, Trigatti B, DeMattos R B, Azhar S, Krieger M, Williams D L. Proc Natl Acad Sci USA. 1997;94:13600–13605. doi: 10.1073/pnas.94.25.13600. [DOI] [PMC free article] [PubMed] [Google Scholar]
- 12.Rigotti A, Trigatti B L, Penman M, Rayburn H, Herz J, Krieger M. Proc Natl Acad Sci USA. 1997;94:12610–12615. doi: 10.1073/pnas.94.23.12610. [DOI] [PMC free article] [PubMed] [Google Scholar]
- 13.Varban M L, Rinninger F, Wang N, Fairchild-Huntress V, Dunmore J H, Fang Q, Gosselin M L, Dixon K L, Deeds J D, Acton S L, et al. Proc Natl Acad Sci USA. 1998;95:4619–4624. doi: 10.1073/pnas.95.8.4619. [DOI] [PMC free article] [PubMed] [Google Scholar]
- 14.Landschulz K T, Pathak R K, Rigotti A, Krieger M, Hobbs H H. J Clin Invest. 1996;98:984–995. doi: 10.1172/JCI118883. [DOI] [PMC free article] [PubMed] [Google Scholar]
- 15.Rigotti A, Acton S L, Krieger M. J Biol Chem. 1995;270:16221–16224. doi: 10.1074/jbc.270.27.16221. [DOI] [PubMed] [Google Scholar]
- 16.Wang N, Weng W, Breslow J L, Tall A R. J Biol Chem. 1996;271:21001–21004. doi: 10.1074/jbc.271.35.21001. [DOI] [PubMed] [Google Scholar]
- 17.Kozarsky K F, Donahee M H, Rigotti A, Iqbal S N, Edelman E R, Krieger M. Nature (London) 1997;387:414–417. doi: 10.1038/387414a0. [DOI] [PubMed] [Google Scholar]
- 18.Sehayek E, Ono J G, Shefer S, Nguyen L B, Wang N, Batta A K, Salen G, Smith J D, Tall A R, Breslow J L. Proc Natl Acad Sci USA. 1998;95:10194–10199. doi: 10.1073/pnas.95.17.10194. [DOI] [PMC free article] [PubMed] [Google Scholar]
- 19.Cao G, Garcia C K, Wyne K L, Schultz R A, Parker K L, Hobbs H H. J Biol Chem. 1997;272:33068–33076. doi: 10.1074/jbc.272.52.33068. [DOI] [PubMed] [Google Scholar]
- 20.Plump A S, Smith J D, Hayek T, Aalto-Setala K, Walsh A, Verstuyft J G, Rubin E M, Breslow J L. Cell. 1992;71:343–353. doi: 10.1016/0092-8674(92)90362-g. [DOI] [PubMed] [Google Scholar]
- 21.Reddick R L, Zhang S H, Maeda N. Arterioscler Thromb. 1994;14:141–147. doi: 10.1161/01.atv.14.1.141. [DOI] [PubMed] [Google Scholar]
- 22.Ishibashi S, Herz J, Maeda N, Goldstein J L, Brown M S. Proc Natl Acad Sci USA. 1994;91:4431–4435. doi: 10.1073/pnas.91.10.4431. [DOI] [PMC free article] [PubMed] [Google Scholar]
- 23.Breslow J L. Science. 1996;272:685–688. doi: 10.1126/science.272.5262.685. [DOI] [PubMed] [Google Scholar]
- 24.Raber J, Wong D, Buttini M, Orth M, Bellosta S, Pitas R E, Mahley R W, Mucke L. Proc Natl Acad Sci USA. 1998;95:10914–10919. doi: 10.1073/pnas.95.18.10914. [DOI] [PMC free article] [PubMed] [Google Scholar]
- 25.Jiao S, Cole T G, Kitchens R T, Pfleger B, Schonfeld G. Metabolism. 1990;39:155–160. doi: 10.1016/0026-0495(90)90069-o. [DOI] [PubMed] [Google Scholar]
- 26.Pittman R C, Taylor C A., Jr Methods Enzymol. 1986;129:612–628. doi: 10.1016/0076-6879(86)29094-1. [DOI] [PubMed] [Google Scholar]
- 27.Rinninger F, Pittman R C. J Lipid Res. 1987;28:1313–1325. [PubMed] [Google Scholar]
- 28.Le N A, Ramakrishnan R, Dell R B, Ginsberg H N, Brown W V. Methods Enzymol. 1986;129:384–395. doi: 10.1016/0076-6879(86)29081-3. [DOI] [PubMed] [Google Scholar]
- 29.Honkakoski P, Negishi M. Biochem J. 1998;330:889–895. doi: 10.1042/bj3300889. [DOI] [PMC free article] [PubMed] [Google Scholar]
- 30.Masucci-Magoulas L, Plump A, Jiang X C, Walsh A, Breslow J L, Tall A R. J Clin Invest. 1996;97:154–161. doi: 10.1172/JCI118384. [DOI] [PMC free article] [PubMed] [Google Scholar]
- 31.Pittman R C, Knecht T P, Rosenbaum M S, Taylor C A., Jr J Biol Chem. 1987;262:2443–2450. [PubMed] [Google Scholar]
- 32.Khoo J C, Pittman R C, Rubin E M. J Lipid Res. 1995;36:593–600. [PubMed] [Google Scholar]
- 33.Glass C, Pittman R C, Weinstein D B, Steinberg D. Proc Natl Acad Sci USA. 1983;80:5435–5439. doi: 10.1073/pnas.80.17.5435. [DOI] [PMC free article] [PubMed] [Google Scholar]
- 34.Leblond L, Marcel Y L. J Biol Chem. 1993;268:1670–1676. [PubMed] [Google Scholar]
- 35.Swarnakar S, Reyland M E, Deng J, Azhar S, Williams D L. J Biol Chem. 1998;273:12140–12147. doi: 10.1074/jbc.273.20.12140. [DOI] [PubMed] [Google Scholar]
- 36.Hamilton R L, Wong J S, Guo L S, Krisans S, Havel R J. J Lipid Res. 1990;31:1589–1603. [PubMed] [Google Scholar]
- 37.Xu S, Laccotripe M, Huang X, Rigotti A, Zannis V I, Krieger M. J Lipid Res. 1997;38:1289–1298. [PubMed] [Google Scholar]
- 38.Havel R J. Curr Opin Lipidol. 1995;6:312–316. doi: 10.1097/00041433-199510000-00011. [DOI] [PubMed] [Google Scholar]
- 39.Beisiegel U, Weber W, Ihrke G, Herz J, Stanley K K. Nature (London) 1989;341:162–164. doi: 10.1038/341162a0. [DOI] [PubMed] [Google Scholar]
- 40.Fan J, Ji Z S, Huang Y, de Silva H, Sanan D, Mahley R W, Innerarity T L, Taylor J M. J Clin Invest. 1998;101:2151–2164. doi: 10.1172/JCI1599. [DOI] [PMC free article] [PubMed] [Google Scholar]
- 41.Ji Z S, Fazio S, Lee Y L, Mahley R W. J Biol Chem. 1994;269:2764–2772. [PubMed] [Google Scholar]
- 42.Linton M F, Hasty A H, Babaev V R, Fazio S. J Clin Invest. 1998;101:1726–1736. doi: 10.1172/JCI2181. [DOI] [PMC free article] [PubMed] [Google Scholar]
- 43.Plump A S, Scott C J, Breslow J L. Proc Natl Acad Sci USA. 1994;91:9607–9611. doi: 10.1073/pnas.91.20.9607. [DOI] [PMC free article] [PubMed] [Google Scholar]
- 44.Zhang S H, Reddick R L, Piedrahita J A, Maeda N. Science. 1992;258:468–471. doi: 10.1126/science.1411543. [DOI] [PubMed] [Google Scholar]


