Abstract
The evolution of a dendritic pattern from a planar solid–liquid interface during directional solidification of a binary alloy was investigated experimentally. The model alloy used was the transparent organic crystal succinonitrile doped with the laser dye coumarin 152. The buildup of solute ahead of the initially stable planar interface and the subsequent instability of the planar front were measured in detail and compared with recent theoretical calculations by Warren and Langer [Warren, J. A. & Langer, J. S. (1993) Phys. Rev. E 47, 2702- 2712]. The fluorescence of coumarin 152 was used for direct observations of the evolution of the solute concentration profile ahead of the initially planar solid–liquid interface. UV absorption was used to produce thermal perturbations of the sample that generated spatially periodic modulations of the planar interface. This technique allows for measurement of both positive and negative linear growth coefficients (determined from the growth or decay rate of the modulation after the perturbation is switched off) for a large range of wave vectors. Measurements of the evolution of the concentration profile and the linear growth coefficients, and the occurrence of the initial instability, were in good agreement with the Warren–Langer predictions.
The study of dynamical instabilities has developed dramatically during the past decade due to both major theoretical advances and the introduction of videomicroscopy and digital image analysis techniques permitting precise quantitative tests of theoretical predictions. Pattern-forming instabilities occur in many dynamical systems far from equilibrium, particularly hydrodynamic systems. The instabilities we will discuss in this article occur at the solid–liquid interface during growth of crystals from the melt. The morphology of the resulting solidification patterns is of considerable practical importance because the mechanical properties of solidified metallic alloys depend critically on the dendritic microstructure and associated nonuniform distribution of solute (the minor material components of the alloy) that result from the instability. These solidification instabilities are also of fundamental interest as an experimentally accessible example of instabilities at free boundaries for which nonlinear dynamical behavior can be investigated.
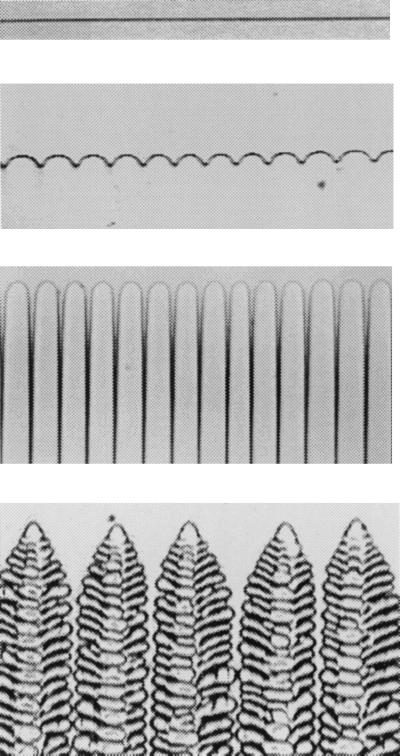
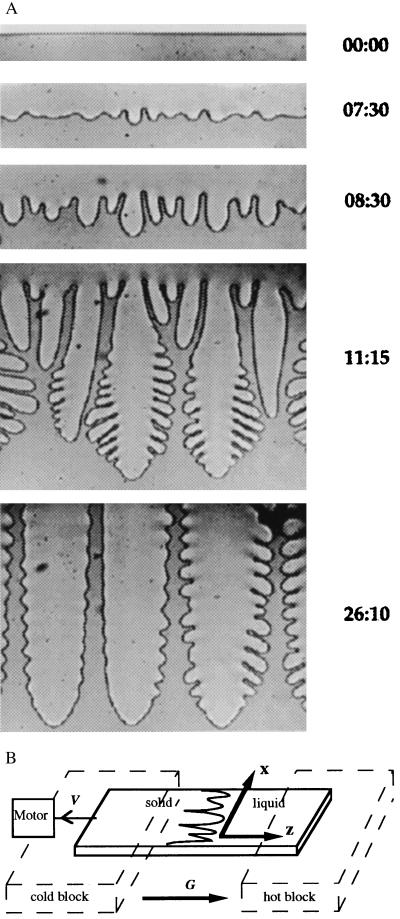
When alloy solidification occurs rapidly, the smooth solid–melt interface becomes unstable and transforms to a pattern of shallow cells, deep cells, or an array of dendrites with sidebranch structure, depending on the growth conditions (see Figs. 1 and 2A). The physical origin of this instability was described in 1953 by Rutter and Chalmers (1) and by Tiller et al. (2) as “constitutional supercooling.” Because the solute is usually more soluble in the melt than in the crystal, solute rejection occurs continuously during solidification, producing a “snowplow” buildup of rejected solute ahead of the advancing solidification front. Because of freezing-point depression, the local crystallization temperature ahead of the advancing front increases with distance, inducing the instability if the gradient in crystallization temperature exceeds the actual temperature gradient present at the interface. The dynamical theory of this solidification instability was first analyzed in 1964 in a seminal paper by Mullins and Sekerka (3), to be described in the following section.
Figure 1.
Steady-state patterns formed at the crystal–melt interface of a binary alloy of succinonitrile and coumarin 152 during directional solidification. From Top to Bottom (with increasing growth speed): planar interface, cellular interface, deep cells, and dendritic array.
Figure 2.
(A) Time evolution of the interface morphology for SCN/rhodamine 6G at constant pulling speed V (V = 3.11 μm/s, G = 2.8 K/cm, C∞ = 0.325 wt%). From Top to Bottom: stationary planar interface, cellular pattern at the crossover time, onset of nonlinear instabilities, coarsening phase, and steady-state dendritic array. Elapsed time (in minutes:seconds) from the initiation of pulling is shown at the right. (B) Schematic drawing of the directional solidification experiment. The (thin) sample is moved through the temperature gradient at pulling speed V while the crystal–melt interface remains nearly fixed in the laboratory reference frame.
Studying morphological instabilities in metallic alloys is extremely difficult because the samples are opaque and the high melting temperature impedes precise control of the solidification conditions. The usual metallurgical approach is to allow the sample to solidify, and then to cut, polish, and etch the exposed surface so that the solidification pattern can be examined in a microscope. A major experimental breakthrough occurred in 1965 when Jackson and Hunt showed that transparent organic materials with low surface tension anisotropy effectively solidify like metals, and the evolution of pattern-forming instabilities can be studied in thin samples of these materials in an ordinary optical transmission microscope equipped with a motor-driven temperature-gradient stage (directional solidification, see Fig. 2B) (4, 5). Stimulated by this convenient transparent analogue of metallic alloys, various groups performed many experimental studies and undertook detailed tests of theoretical predictions. (Reviews can be found in, e.g., refs. 6–9.)
In recent years, such experiments have been significantly enhanced by the availability of digital videomicroscopy techniques employing quantitatively precise computer processing of digitized microscope images obtained from charge-coupled device (CCD) cameras. The experiments have shown that the Mullins–Sekerka analysis provides a qualitatively correct description of the planar–cellular instability, but the experimentally observed initial cellular patterns usually have considerably larger wavelengths than the theory predicts. The origin of this disagreement lies in one assumption of the Mullins–Sekerka approach: that the instability of a planar front occurs after the dynamical steady state has been reached. In reality, the planar interface will generally become unstable before the steady-state concentration profile has been established. Thus, to quantitatively describe the initial instability and its evolution, a non-steady-state theory is needed.
A generalization of the Mullins–Sekerka theory incorporating non-steady-state dynamics was developed recently by Warren and Langer (10, 11), opening the way for a full analysis of the evolution of dendritic patterns during solidification. In this paper, we will briefly review the Warren–Langer (WL) approach and then present experimental results obtained with a new model alloy system that allows quantitative tests of many of the new theoretical predictions. We have analyzed the time dependence of both the interface morphology and the solute concentration field, starting with the initial transient following the initiation of crystal growth, investigated the time evolution of the linear growth coefficients, and determined the time required for the initial instability to develop. We have also followed the evolution of the interface morphology after the initial instability as it approaches the final steady-state morphology. This evolution will be described in the following paper (12).
Theory
Mullins–Sekerka Theory.
The central theoretical approach that has been followed in virtually all analyses of data obtained from directional solidification experiments is the linear stability analysis first employed by Mullins and Sekerka in 1964 (3). The sample, assumed to be two-dimensional and isotropic, moves in the z direction at constant pulling speed V in an externally imposed temperature gradient G (see Fig. 2B). A continuum description is used for low-anisotropy materials, and attachment kinetics are neglected. The interface temperature Ti(x), where x is the direction parallel to the interface, is given by
 |
1 |
In Eq. 1 TM is the bulk melting temperature of the pure material, m is the slope of the liquidus line, Ci is the solute concentration on the liquid side of the interface, d0 = σ/L is the capillary length (where σ is the surface free energy density and L is the latent heat), and κ(x) is the local curvature. The second term on the right of Eq. 1 is the freezing point depression due to the solute; the third term is freezing point depression due to curvature, the Gibbs–Thomson correction. The solute concentration field in the liquid, C(x, z, t) obeys the diffusion equation in the frame of reference fixed in the laboratory:
 |
2 |
Solute diffusion in the solid is neglected. Similarly, thermal diffusion in both the solid and liquid is neglected because the thermal diffusion coefficient Dth is usually much larger than the chemical diffusion coefficient D. The interface (at z = z0) introduces additional boundary conditions (with C for the liquid and C′ for the solid):
 |
3 |
 |
4 |
The partition coefficient k is the ratio of equilibrium concentrations on the solid and liquid sides of the interface. In the following it is assumed that k < 1, which is true for most alloys.
Eqs. 1–4 are first solved assuming a flat interface (κ = 0) to find the steady-state concentration field C(z):
 |
5 |
where C∞ is the background concentration in the liquid far away from the advancing interface. Eq. 5 predicts that at steady state Ci = C∞/k and that C(z) decays exponentially from Ci to C∞ with a decay length l = 2D/V. This “spike” (or snowplow) of rejected solute moves ahead of the advancing interface.
The Mullins–Sekerka linear stability analysis (3) begins with the steady-state solution (Eq. 5) and adds an infinitesimal sinusoidal modulation with wave vector q:
 |
6 |
A similar modulation is assumed for the concentration field. This interface and concentration field ansatz is then put into the governing Eqs. 1–4, which are linearized and solved for the linear growth coefficient a0(q) = [dζq(t)/dt]/ζq(t).
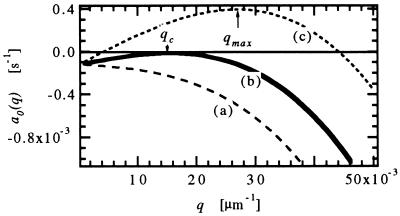
The main results of this linear stability analysis, shown schematically in Fig. 3, are as follows:
Figure 3.
The Mullins–Sekerka linear growth coefficient a0(q) vs. q at steady state for V < VC (curve a), V = VC (curve b), and V > VC (curve c). These curves can also represent the evolution of a0(q, t) with time for V > VC as the concentration field evolves toward steady state.
(i) For pulling speeds V below a critical value VC, a0(q) < 0 for all q and the interface is therefore stable against all deformations. (At high concentrations, VC is given approximately by
 |
7 |
where G is the temperature gradient at the interface.)
(ii) When V = VC, the interface is marginally stable [a0(qC) = 0] for a single wave vector qC.
(iii) For V > VC, the interface is unstable against a range of wave vectors, i.e. there is a band of unstable modes for which a0(q) > 0.
In the a0(q) vs. q curve (c), for V > VC, the range of unstable modes is set by the two neutral stability points where a0(q) = 0, while the maximally unstable mode qmax defined by the maximum of the a0(q) vs. q curve should grow most rapidly. The calculated neutral stability curve with its maximally unstable mode has been the main tool for comparing experiments and theory. In general, however, the wave vector qinit of the initial modulation observed experimentally does not correspond to the calculated maximally unstable mode qmax. Typically, qinit is smaller than qmax by a factor of ≈5 (13).
There are several limitations to this method of comparing experimental data with predictions of the linear stability analysis that could explain the disagreement.
(i) While the Mullins–Sekerka stability analysis is performed assuming a steady-state planar interface, if the pulling speed V is well above VC the interface may destabilize long before steady state is reached with a different qmax than that at steady state.
(ii) The results of the Mullins–Sekerka linear stability analysis beginning with Eq. 6 are equivalent to an equation of motion for ζq(t):
 |
8 |
Note, however, that if ζq(t = 0) = 0, then from Eq. 8 ζq(t) = 0 for all t ≥ 0 even if a0(q) is positive. The linear stability theory therefore does not provide a complete equation of motion for ζq(t). An initiation mechanism—e.g., thermal noise effects—should be included, as discussed in the next section.
(iii) While the thermal diffusion field can be ignored for high impurity concentrations, this approximation becomes less valid as C∞ decreases and thermal effects become important (14).
(iv) Linear stability analysis does not fully describe the instability. Nonlinear terms must also be included to obtain steady-state nonplanar solutions (15) and to determine if the initial instability is subcritical or supercritical—i.e., with or without hysteresis (14).
WL Theory.
Warren and Langer (10) reanalyzed the pattern-formation phenomenon of directional solidification with a procedure based on the Mullins–Sekerka linear stability approach, but without the approximations i and ii. Warren and Langer analyzed the dynamics beginning from the time that pulling is initiated, and followed the motion of the interface z0(t) and the evolution of the concentration field C(x, z, t). They applied the Mullins–Sekerka stability analysis dynamically as the concentration field evolves with time rather than assuming steady state. Warren and Langer also analyzed the evolution of the pattern in the nonlinear regime leading to steady-state dendrite arrays. We will discuss that aspect of their work in the following paper (12).
Taking z0 = 0 as the position of the interface of an undoped sample in equilibrium, the initial (t = 0) and steady-state (t → ∞) values of z0(t) are
 |
9a |
 |
9b |
For the planar interface Warren and Langer assumed that the concentration field in the liquid is given by
 |
10 |
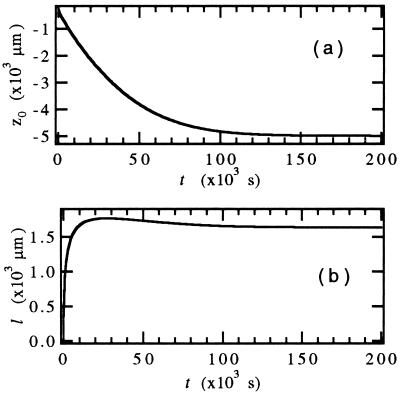
i.e., an exponential decay with a time-dependent decay length l(t). At steady state, Eq. 10 becomes identical to Eq. 5 [i.e., l(t → ∞) = 2D/V]. This assumption simplifies the numerical calculations significantly because the problem can now be reduced to two coupled differential equations for l(t) and z0(t) that can be solved numerically, with results as illustrated in Fig. 4. This ad-hoc assumption was shown to give essentially the same results for z0(t) and l(t) as a full numerical calculation (16).
Figure 4.
Solutions of the WL equations for z0(t) (a) and l(t) (b). The parameters used correspond to the experiment shown in Fig. 6 (SCN/coumarin 152 at V = 0.549 μm/s ≈ 6 VC, G = 20.2 K/cm, C∞ = 0.30 wt%).
WL next solved linearized (Langevin) equations of motion for interface modulations ζq(t):
 |
11 |
Eq. 11 differs from Eq. 8 in two ways. First, the inclusion of the random thermodynamic (Langevin) fluctuating force term ηq(t) provides an initiation mechanism for the instability; second, the linear growth coefficient a0(q, t) is time dependent, computed from the instantaneous concentration field of Eq. 10 rather than from the steady-state result.
Numerical solution of Eq. 11 for all q predicts how the pattern will evolve with time. Warren and Langer introduced a crossover time t0 at which the initial modulation amplitude reaches the same magnitude as the mean wavelength λ0, and the (approximate) end of the linear regime is reached. Because a0(q, t) increases with time the amplitude of interface modulations grows faster than exponentially. The mean wavelength of those modulations, on the other hand, decreases only slowly.
Experiments
Sample Preparation.
Among the organic crystals used in studies of solidification instabilities, the most widely investigated material is succinonitrile (SCN) for which the important material properties have been accurately measured (17) (see Table 1). Usually acetone is used for the second component (solute). However, because both SCN and acetone are transparent, the solute concentration field cannot be directly observed.
Table 1.
Material properties of SCN/C152 mixtures
| Property | Value | Ref. |
|---|---|---|
| Segregation coefficient k | 0.05 | Present exp. |
| Liquidus slope m | 5.42 K/mol% | Present exp. |
| Diffusion constant D | 450 μm2/s | Present exp. |
| Interfacial free energy γ (SCN) | 8.95 × 10⁻¹⁵ J/μm2 | 17 |
| Melting temperature TM (SCN) | 331.24 K | 17 |
| Latent heat (SCN) | 4.627 × 10⁻¹¹ J/μm3 | 17 |
| Molecular weight (SCN) | 80.092 g/mol | 17 |
| Molecular weight (C152) | 257 g/mol | Sigma |
| Density (solid SCN) | 1.016 g/cm3 | 17 |
| Density (liquid SCN) | 0.970 g/cm3 | 17 |
| Thermal conductivity (solid SCN) | 5.36 × 10⁻⁴ cal/cm·s·K | 17 |
| Thermal conductivity (liquid SCN) | 5.32 × 10⁻⁴ cal/cm·s·K | 17 |
Following preliminary unpublished experiments of J. Bechhoefer, F. Heslot, and A. Libchaber, who introduced a laser dye as the solute to produce a visible solute field, we have employed SCN with the dye coumarin 152 [C152; 7-(dimethylamino)-4-trifluoromethylcoumarin] as the solute. The segregation coefficient k of SCN/C152 is 0.05, about half of that of SCN/acetone (see Table 1), within the range observed in metallic alloys (18).
SCN with 99% purity purchased from Fluka was vacuum distilled [pressure < 200 mtorr (27 Pa)] four times. The pure SCN was then mixed with C152 (Sigma) at concentrations from 0 to 0.45 wt%. The mixture was filled under vacuum into thin glass capillaries purchased from Vitro Dynamics (inner dimensions 0.1 × 2.0 × 300 mm) which were then flame sealed. Three samples were produced at the same time from each mixture. As a test for other impurities one sample of pure SCN was directionally solidified at a high pulling speed (V > 10 μm/s) with a low temperature gradient (G < 5 K/cm) where a small impurity concentration should produce an instability. No instabilities occurred, and it was therefore assumed that any remaining impurities in the doped samples would not affect the experimental results.
The solute concentration of each sample was calibrated by fluorescence measurements. For the low concentrations used, a linear relationship between the concentration and fluorescent intensity holds (see ref. 19). To determine the absolute concentration, a pure sample and a sample of known concentration, produced in a nitrogen environment to avoid sublimation loss of C152, were used as fluorescence intensity calibration standards. The determination of the segregation coefficient is described in ref. 19.
The liquidus slope m was determined by fixing the temperature gradient, stage, and microscope focus so that the solid–liquid interface position measured by the camera reproducibly indicates the melting temperature of the sample. After sufficient equilibration time (>2 days) the interface positions of seven samples were measured, from which we determined m = 5.43 ± 1 K/mol%. The diffusion constant D was determined from an exponential fit to the concentration profile in the liquid ahead of a growing planar front as it approaches steady state (see Eq. 5). From the long-time asymptotic value of the characteristic length l(t) = 2D/V for different pulling speeds we found D = 450 ± 50 μm2/s. The measurement of the concentration profile will be explained in the beginning of the next section. The values of m and D were verified through fits of the experimental evolution of the position z0(t) to the WL calculations.
Apparatus.
The experiments were carried out in a high precision computerized directional solidification apparatus. The glass capillary sample cell is glued to a holder attached to a micrometer screw that is driven with a computer-controlled dc motor. The glass capillary extends into an oil-filled stainless steel tunnel that has two sapphire windows to allow visual observation of the interface. The tunnel is inserted into copper hot and cold blocks and brought into good thermal contact with both so that a linear temperature gradient is established in the tunnel between the two blocks. The whole system has a plastic cover for thermal isolation. The hot block is held at constant temperature by an electronic temperature controller (Yellow Springs Instruments proportional temperature controller model 72). The range of available temperatures is 30°C to 120°C with an accuracy of ±0.05 K. The cold block is cooled with a water bath (Lauda RM6). The available temperature range is 10°C to 80°C with an accuracy of ±0.01 K. We also measured the actual temperature profile in the tunnel and found a linear temperature gradient across the region of observation. Measurements with a thermocouple inside a glass capillary showed that the temperature gradient does not change with a change in pulling speed, permitting accurate determination of the interface position both in equilibrium and while pulling.
With the motor drive, pulling speeds in the range from 0.05 μm/s to more than 100 μm/s can be selected. The motor (MicroMo Electronics, St. Petersburg, FL) is controlled by a 386 personal computer and held at constant speed with an optical decoder with an accuracy of ±0.5%. The whole setup is mounted on the stage of a Nikon inverted Diaphot microscope. The experiments are captured with a Dage-MTI (Michigan City, IN) CCD 72 camera with a resolution of 480 × 640 points with 256 gray scales. Data acquisition is carried out with a Macintosh IIci computer equipped with a Data Translation interface (Marlboro, MA) board that can capture images at a rate of up to 15 per sec.
To produce an oriented single crystal the whole sample is first solidified as a polycrystalline solid by rapid cooling. When the sample is inserted into the directional solidification apparatus and allowed to equilibrate, the solid–liquid interface consists of many grains. The sample is then pulled rapidly and dendritic crystal growth starts. If a properly oriented dendrite is found, it is grown further while dendrites from other grains are melted back with laser pulses and are overgrown by the oriented dendrite until the solid–liquid interface is made up of a single grain. (If no grain develops dendrites growing in the z direction within an angle of <1°, or if the sidebranches don’t lie in the x–z plane, the sample is melted back until other grains are at the solid–liquid interface and the process is repeated.) Once a properly oriented dendrite has been selected the temperature is lowered slowly so that the oriented grain grows and completely fills the liquid side of the sample. The temperature gradient is subsequently inverted, which melts away all other grains, and the temperature is again lowered slowly to let the single correctly oriented grain fill the complete sample. The interface is then positioned so that about three-quarters of the capillary is liquid and one-quarter solid. The sample, which on the solid side is now a single properly oriented crystal, is brought into equilibrium in the selected temperature gradient by waiting for at least 1 day. Growth at the selected pulling speed V is then initiated, and video images are either captured and digitized in real time or recorded on videotape for later analysis.
Data Extraction and Analysis.
The captured images are analyzed on a Macintosh IIci computer using the nih image program and additional C programs for the extraction of the solid–liquid interface position. Better than one pixel resolution is required to allow analysis of the interface shape for very small deformations. For each of the 480 lines of pixels along the z axis (perpendicular to the planar interface) the pixel gray-scale profiles are extracted and a parabola is fitted through them. The tip of the interpolated parabola is taken to define a point of the solid–liquid interface with a resolution of up to 0.3 μm, one-tenth of one pixel (20). For deep cellular or dendritic shapes the line can cross the interface more than once, but for further analysis only the front interface point for each line is selected through pattern recognition algorithms that distinguish the front of the interface from the back and from stray dust points. Removal of all stray points is crucial to obtain reliable data for interfaces close to planar and for a determination of cellular or dendritic tip positions, spacings, and shapes and comparison to theoretical predictions.
The extracted interface profile is subsequently analyzed through a spatial Fourier transform procedure. In our experiments the visible interface pattern often includes fewer than 20 wavelengths, a circumstance that precludes a fast Fourier transform (FFT) analysis. The interface profile was therefore transformed through direct calculation of the Fourier integral f(q) for at least 100 values of q by using C programs provided by J. M. A. Figueiredo (Universidade Federal de Minas Gerais, Brazil). The largest peak of f(q) determines the largest Fourier component q0 with good frequency resolution, reveals small shifts in frequency, and provides the amplitude of the largest Fourier component with better accuracy than FFT.
Experimental Results and Comparison with Theory
Evolution of the Solute Concentration Field and Recoil of the Planar Interface.
We first investigated the time evolution of the solute concentration field C(z, t) and the interface position z0(t) in the SCN/C152 mixtures after initiation of pulling at constant speed V at t = 0. The WL prediction is that C(z, t) will obey Eq. 10 with the decay length l(t) determined by the numerical solution illustrated in Fig. 4b. At t = 0, C(z, t) should exhibit a step discontinuity at the interface with C(z, 0) = C∞ in the liquid and CS (0) = k C∞ in the solid. As t → ∞, C(z0, t), the concentration on the liquid side of the interface, should increase to C∞/k, while CS (z0, t), the concentration on the solid side of the interface, should approach C∞.
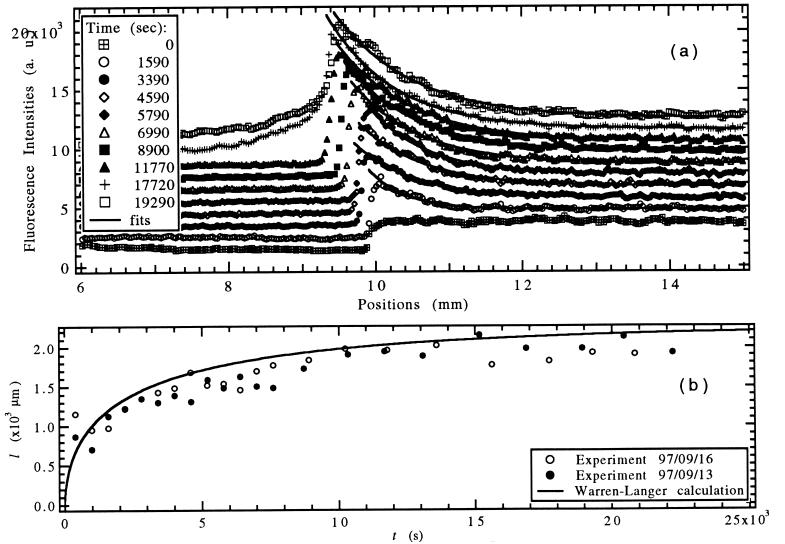
The fluorescence of C152 allows direct observation and measurement of the solute concentration profile, because the fluorescence intensity is directly proportional to the solute concentration for the small concentrations used in the experiments. For quantitative determination of C(z, t), a 488-nm laser beam of <10 μm diameter was scanned along the 0.3 wt% SCN/C152 sample perpendicular to the interface, and the fluorescence intensity was recorded with a photomultiplier. The observed buildup of C(z, t) and the accompanying “recoil” of the interface position z0(t) with time are shown by the symbols in Fig. 5a. Even though in this experiment V > VC, the planar interface remains stable for a long transient time. Fits to the WL Eq. 10 are also shown, with the resulting diffusion length l(t), obtained from two such experiments, shown in Fig. 5b. The evolution of l(t) is in reasonable quantitative agreement with the WL calculations shown as the solid line in Fig. 5b. The steady-state value of l(t) is approached on the time scale of 2D/V2 ≈ 4,600 s, whereas the approach to the steady-state interface position z(t) occurs much more slowly, on a time scale of D/kV2 ≈ 46,000 s (21). It is therefore possible to observe the approach to steady state for l(t) in this experiment even though V > VC. This experiment was also used to determine the diffusion coefficient D since l(t → ∞) = 2D/V.
Figure 5.
(a) Experimentally observed solute concentration profile of SCN/C152 evolving with time after initiation of pulling with V = 0.44 μm/s, G = 15 K/cm, C∞ = 0.3 wt% (symbols). Exponential fits to the data are shown as solid lines. (b) Diffusion length l(t) for two experiments obtained from exponential fits (symbols) and from the WL calculation with V = 0.44 μm/s (solid line).
The WL prediction for the interface position z0(t) is shown in Fig. 4a. At low growth speeds (V < VC) the time required for z0(t) to reach the steady-state position (Eq. 9b) is unobservably long for our low k alloy, whereas at higher growth speeds, the instability intervenes before the steady-state value of Eq. 9b is reached. At speeds close to VC after some time (on a longer time scale than the approach to a steady state l(t), but before a steady state for z(t) is reached) the position of the interface z0(t) stops following the WL prediction even though no instability of the planar interface is observed. The fluorescence measurements indicate that this departure is probably due to solute trapping, possibly arising from an instability in the third dimension that forms one cell across the small side of the sample. An indication of the solute trapping can be seen in the concentration profiles in Fig. 5a at t = 17,720 s and 19,290 s as a strong increase of fluorescence intensity on the solid side of the interface. While the liquid ahead of the interface still has an exponentially decaying concentration profile with essentially unchanged l(t), the interface position and the amplitude of the solute spike no longer follow the WL predictions. The influence of wall effects has been investigated previously through variations in sample width (21), but our procedure allows in situ observation and direct measurement of solute trapping at the walls. Before the clearly visible onset of the three-dimensional instability, the initial transient can thus be safely treated by two-dimensional approximations. For higher speeds, wall effects start to occur at the same time as the initial instability.
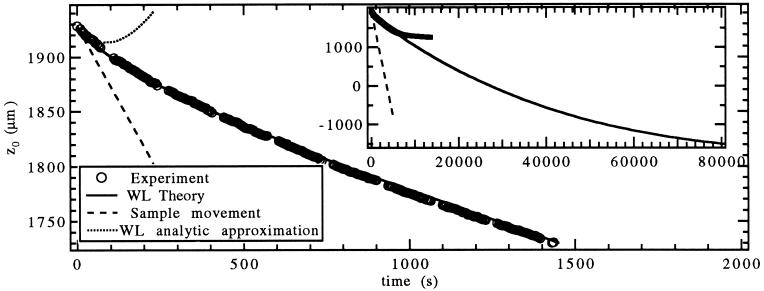
Fig. 6 shows the measured interface position z0(t) vs. t for a pulling speed V ≈ 6VC. The interface initially moves back at the pulling speed V (indicated by the dashed line) only for unobservably short times because attachment kinetics are very rapid. Subsequently, z0(t) follows the WL prediction for a planar interface (shown by the solid line) until the interface position levels off because of solute trapping at t ≈ 7,000 s. The first-order analytic approximation calculated in ref. 10 (indicated by the dotted line) breaks down too quickly to be observable or relevant for the initial instability.
Figure 6.
Interface position z0(t) vs. t of a SCN/C152 sample (V = 0.549 μm/s, G = 20.2 K/cm, C∞ = 0.30 wt%). Comparisons with WL calculation (solid line), WL analytic approximation (dotted line), and sample movement (dashed line) are shown. (Inset) Long-time behavior, where the WL prediction breaks down due to solute trapping.
The Linear Growth Coefficients and the Marginal Stability Time ti.
The linear stability analysis of Mullins and Sekerka, as extended to the non-steady-state situation by Warren and Langer, requires the evaluation of the time-dependent linear growth coefficients aq(t). Although the aq(t) have been calculated theoretically, they have not previously been determined experimentally in solidification experiments. The only way to study aq(t) in the past was to wait for the instability to develop spontaneously and then to measure the modulation amplitude as a function of time. That approach can determine aq(t) only for a single q, and only if aq is positive.
We have developed a procedure to determine aq(t) for experimentally selected values of q in which we apply a row of small spots of UV illumination briefly to the crystal–melt interface. The UV source is the fluorescence illumination attachment on our Nikon microscope, equipped with a metal slide having several rows of holes with different spacings.
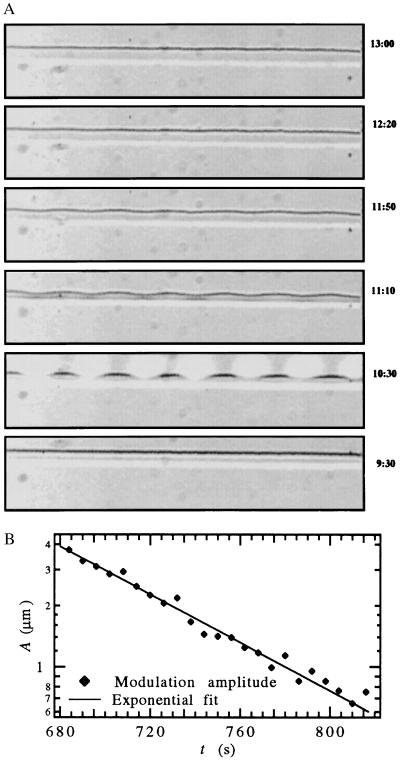
Fig. 7A shows the interface of a 0.30 wt% SCN/C152 sample being pulled at 0.8 μm/s in a temperature gradient of G = 20.25 K/cm. Frame 2 (t = 10.5 min) shows a row of UV spots with a spacing of 225 μm (visible as white circles) which was applied for 1 min starting at t = 10 min. Absorption by the C152 caused local heating, producing a sinusoidal modulation of the planar interface, which gradually decayed, indicating that aq(t) < 0.
Figure 7.
(A) Initiation and decay of the modulation produced by a spatially periodic UV thermal perturbation with λ = 225 μm for a planar interface (SCN/C152, V = 0.8 μm/s, G = 20.25 K/cm, C∞ = 0.30 wt%) (time, in minutes and seconds, increases from Bottom to Top). (B) Amplitude of the largest spatial Fourier component of the interface modulation vs. time, and exponential fit in the range t = 684–810 s (aq,fit = −0.0136 s−1).
The Fourier transform of the interface provided the time-dependent amplitude of the largest Fourier component of the modulation, at λ = 225 μm. The time-dependent amplitude, shown by the symbols in Fig. 7B, was fit to an exponential (a straight line on the semilogarithmic plot) for the range t = 684–810 s, which gave aq = −0.0136 s−1. The WL analysis predicts that for this wavelength, aq(t) would increase from −0.0139 s−1 at 684 s to −0.0120 s−1 at 810 s.
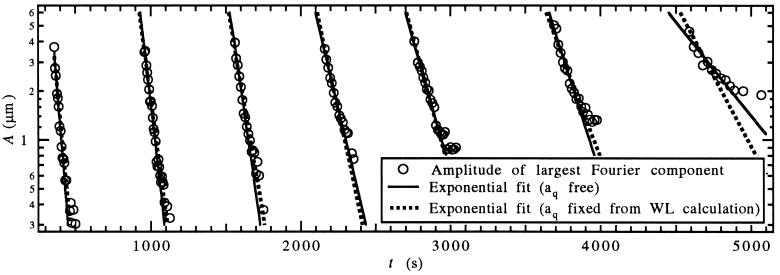
To study the time dependence of aq(t), the measurement described above was repeated sequentially as soon as the modulation had decayed. Crystal growth was started at t = 60 s with V = 0.52 μm/s. The row of UV spots was applied for 60 s to the solid–liquid interface at t = 300 s, 900 s, 1,500 s, 2,100 s, 2,700 s, 3,600 s, and 4,500 s. The amplitude of the largest Fourier component of the planar interface modulation, shown in Fig. 8, was then fitted with an exponential after each perturbation. At early times the decay of the modulation amplitude can be fitted well with a single exponential. The linear approximation of Eq. 8 therefore describes interface stability accurately even though the amplitude of the applied modulation is orders of magnitude larger than thermal noise. As long as the modulation decays quickly, the time dependence of aq(t) can be neglected. However, as the solute concentration builds up and aq(t) approaches zero at t ≈ 4,500 s, the modulation decays slowly and a single exponential fit does not work well any longer.
Figure 8.
Amplitude of the spatial Fourier component with q1 = 0.0228 μm−1 of the interface modulation (○) vs. time, when a 60-s UV-thermal perturbation with q1 is applied at tR = 300 s, 900 s, 1,500 s, 2,100 s, 2,700s, 3,600 s, and 4,500 s. Exponential fits to Aq1 (t) = Ce−aq1(tR)t after each perturbation time tR with aq(tR) as a free parameter (solid line), and aq(tR) given by the WL calculation (dashed line).
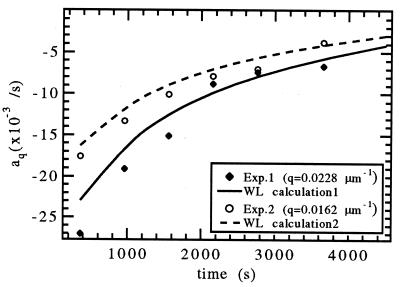
The linear growth coefficient aq(t) for two experiments at V = 0.52 μm/s with q = 0.0228 μm−1 and q = 0.0162 μm−1 obtained from the fits is plotted in Fig. 9 together with the WL predictions. The good agreement between theory and experiment indicates that interface stability during the transient can be calculated by using the WL approach. Even for V > VC, as in this experiment, interface stability can be described well by a linear stability analysis, and the planar interface remains morphologically stable until aq(t) changes over from negative to positive for some one q. In analogy to the steady-state marginal stability at VC we can introduce a marginal stability time ti such that aq(ti) = 0 for some q. This ti marks the onset of instability beyond which the planar interface will spontaneously deform, and the interfacial pattern will then begin to evolve toward its final steady-state morphology. The development of the interface after this initial instability at ti, and its evolution toward the final steady-state dendritic pattern, will be discussed in the following paper (12), where our general conclusions will also be presented.
Figure 9.
Time dependence of aq(t) from exponential fits to the amplitude of the largest Fourier component of the interface modulation when a 60-s perturbation with q = 0.0228 μm−1 (⧫) or q = 0.0162 μm−1 (○) is applied at t = 300 s, 900 s, 1,500 s, 2,100 s, 2,700 s, and 3,600 s, and comparison to the WL predictions.
Acknowledgments
We thank J. S. Langer, J. A. Warren, C. Caroli, R. F. Sekerka, W. J. Rappel, S. R. Coriell, R. Schaefer, O. Mesquita, and J. M. A. Figueiredo for helpful discussions and correspondence. This research was supported by the U.S. Department of Energy under Grant DE-FG02-84-ER45132.
ABBREVIATIONS
- SCN
succinonitrile (NC—CH2—CH2—CN)
- C152
coumarin 152
- WL
Warren–Langer
References
- 1.Rutter J W, Chalmers B. Can J Phys. 1953;31:15–39. [Google Scholar]
- 2.Tiller W A, Jackson K A, Rutter J W, Chalmers B. Acta Metall. 1953;1:428–437. [Google Scholar]
- 3.Mullins W W, Sekerka R F. J Appl Phys. 1964;35:444–451. [Google Scholar]
- 4.Jackson K A, Hunt J D. Acta Metall. 1965;13:1212–1215. [Google Scholar]
- 5.Jackson K A, Hunt J D. Trans Metall Soc AIME. 1966;236:1129–1142. [Google Scholar]
- 6.Woodruff D P. The Solid-Liquid Interface. London: Cambridge Univ. Press; 1973. [Google Scholar]
- 7.Kurz W, Fisher D J. Fundamentals of Solidification. Aedermannsdorf, Switzerland: Trans Tech Pubns.; 1986. [Google Scholar]
- 8.Kurz W, Trivedi R. Acta Metall Mater. 1990;38:1–17. [Google Scholar]
- 9.Trivedi R, Kurz W. Int Mater Rev. 1994;39:49–74. [Google Scholar]
- 10.Warren J A, Langer J S. Phys Rev E. 1993;47:2702–2712. doi: 10.1103/physreve.47.2702. [DOI] [PubMed] [Google Scholar]
- 11.Warren J A, Langer J S. Phys Rev A. 1990;42:3518–3525. doi: 10.1103/physreva.42.3518. [DOI] [PubMed] [Google Scholar]
- 12.Losert W, Shi B Q, Cummins H Z. Proc Natl Acad Sci USA. 1998;95:439–442. doi: 10.1073/pnas.95.2.439. [DOI] [PMC free article] [PubMed] [Google Scholar]
- 13.Trivedi R, Somboonsuk K. Acta Metall. 1985;33:1061–1068. [Google Scholar]
- 14.Liu D, Williams L M, Cummins H Z. Phys Rev E. 1994;50:R4286–R4289. doi: 10.1103/physreve.50.r4286. [DOI] [PubMed] [Google Scholar]
- 15.Figueiredo J M A, Mesquita O N. Phys Rev E. 1996;53:2423–2435. doi: 10.1103/physreve.53.2423. [DOI] [PubMed] [Google Scholar]
- 16.Caroli B, Caroli C, Ramirez-Piscina L. J Cryst Growth. 1993;132:377–388. [Google Scholar]
- 17.Glicksman M E, Schaefer R J, Ayers J D. Metal Trans A. 1976;7A:1749–1759. [Google Scholar]
- 18.de Cheveigne S, Guthmann C, Kurowski P, Vincente E, Biloni H. J Cryst Growth. 1988;92:616–628. [Google Scholar]
- 19.Williams L M, Muschol M, Qian X, Losert W, Cummins H Z. Phys Rev E. 1993;48:489–499. doi: 10.1103/physreve.48.489. ; erratum 48, 4862. [DOI] [PubMed] [Google Scholar]
- 20.Chou H, Cummins H Z. Phys Rev Lett. 1988;61:173–176. doi: 10.1103/PhysRevLett.61.173. [DOI] [PubMed] [Google Scholar]
- 21.de Cheveigne S, Guthmann C, Lebrun M-M. J Phys (Paris) 1986;47:2095–2103. [Google Scholar]


