Abstract
The DNA-intercalating chromophore [Ru(phen)2dppz]2+ has unique photophysical properties, the most striking of which is the “light-switch” characteristic when binding to DNA. As a dimer, it acts as a molecular staple for DNA, exhibiting a remarkable double-intercalating topology. Herein, we report femtosecond dynamics of the monomeric and the covalently linked dimeric chromophores, both free in aqueous solution and complexed with DNA. Transient absorption and linear dichroism show the electronic relaxation to the lowest metal-to-ligand charge-transfer (CT) state, and subpicosecond kinetics have been observed for this chromophore for what is, to our knowledge, the first time. We observe two distinct relaxation processes in aqueous solution with time constants of 700 fs and 4 ps. Interestingly, these two time constants are very similar to those observed for the reorientational modes of bulk water. The 700-fs process involves a major dichroism change. We relate these observations to the change in charge distribution and to the time scales involved in solvation of the CT state. Slower processes, with lifetimes of ≈7 and 37 ps, were observed for both monomer and dimer when bound to DNA. Such a difference can be ascribed to the change of the structural and electronic relaxation experienced in the DNA intercalation pocket. Finally, the recombination lifetime of the final metal-to-ligand CT state to the ground state, which is a key in the light-switch process, is found in aqueous solution to be sensitive to structural modification, ranging from 260 ps for [Ru(phen)2dppz]2+ and 360 ps for the monomer chromophore derivative to 2.0 ns for the dimer. This large change reflects the direct role of solvation in the light-switch process.
The DNA-intercalating substitution inert metal complex [Ru(L)2dppz]2+ (where L is 2,2-bipyridine or 1,10-phenanthroline and dppz = dipyrido[3,2-a:2′-3′-c]phenazine) has attracted great attention because of the remarkable increase (>103) in emission quantum yield on binding to DNA compared with its value in water solution (1–6). On photoexcitation with visible light, an electron is transferred from a ruthenium d orbital to an antibonding π* orbital of one of the ligands, forming a charge-separated state of triplet character (7). From studies of [RuII(L)2dppz]2+ in various solvents, it has been concluded that it is the dppz ligand that is reduced in the lowest excited state, forming the metal-to-ligand charge-transfer (MLCT) state [RuIII(L)2dppz⋅−]2+ (8–11).
The rate of ground-state recovery depends on environment: the lifetime is long (hundreds of nanoseconds) when the molecule is dissolved in acetonitrile or ethanol or when bound to DNA. In water, however, the emission is almost totally quenched and virtually impossible to detect with steady-state methods. Therefore, ultrafast measurements are needed to investigate the relaxation mechanism for these systems.
A study of Ru(bipy)3 dissolved in acetonitrile indicated that most of the relaxation from the initial excited state(s) to the lowest excited state is complete within a couple of hundred femtoseconds after excitation (12), although changes on the picosecond time scale were later reported with another excitation wavelength (13). Olson et al. (1) concluded, from excited-state relaxation of [Ru(phen)2dppz]2+ in different environments (acetonitrile, water, and DNA), that dynamics in water take place on the time scale of several picoseconds, not observed in acetonitrile and DNA.
These dynamics in water were proposed to be due to interconversion between two dppz-localized MLCT states, where the lowest state (MLCT′′) has more charge density localized on the phenazine nitrogens. The interconversion was measured to have a rate constant of 1/3 ps−1 and was suggested to be rate limited by hydrogen-bond formation of water to the reduced ligand. The lifetime of the MLCT′′ state was found to be 250 ps in H2O compared with 560 ps in 2H2O, supporting the assertion that hydrogen bonding of water is important for the rate of nonradiative deactivation.
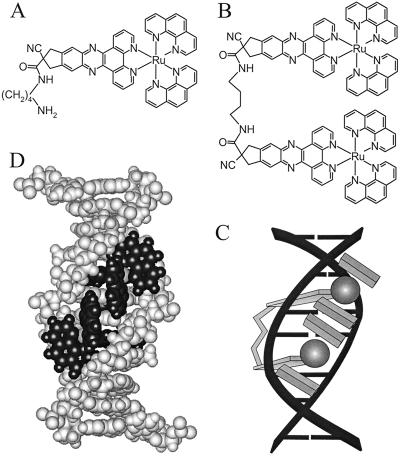
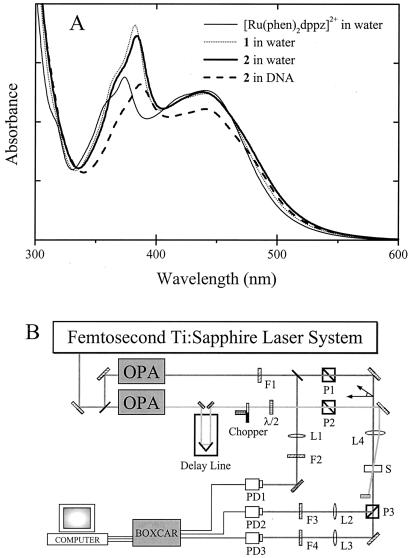
In this study, we focus on the excitation relaxation processes of two newly synthesized ruthenium complexes, structurally similar to [Ru(phen)2dppz]2+: the monomeric unit 1, [Ru(phen)2cpdppzC4NH2]2+, and the dimeric species 2, [μ-c4(cpdppz)2-(phen)4Ru2]4+,¶ in which two moieties of 1 are tethered together via the dppz ligands (Fig. 1 A and B). The similarity between their absorption spectra (Fig. 2A) confirms that 1 and 2 may be regarded as made up of identical chromophores. Measurements were also performed on [Ru(phen)2dppz]2+ for comparison. As recently reported with flow linear dichroism (LD) spectroscopy (14), 1 and 2 exhibit very similar DNA binding properties, with the dppz ligands of each molecule fully intercalating between the base pairs (2, thus, bisintercalating).
Figure 1.
Structures of 1 (A) and 2 (B) and schematic picture of the binding of 2 (Δ,Δ isomer) to DNA (C). Molecular model of 2 (Δ,Δ isomer) bound to a duplex decanucleotide (D), with the ruthenium centers situated in the minor groove (obtained by energy minimization in the hyperchem software package with the Amber force field).
Figure 2.
(A) Absorption spectra of the molecules studied. (B) Experimental layout of femtosecond transient absorption apparatus. OPA, optical parametric amplifier; F, optical filters; P, prism polarizers; λ/2, half-wave plate; L, lens; PD, photodiode; S, sample cell.
For both the mono and bis compound, the emission quantum yield shows an ≈1,000-fold increase on binding to DNA in a water solution. Fig. 1C shows a schematic model of the manner in which 2 binds to DNA, based on the LD and steric considerations (14), as further illustrated by the molecular model of Fig. 1D. This mode of binding is interesting, because it implies that the dimer has either to thread its bulky Ru(phen)2 moieties through the DNA double helix or to sling the linker around two coherently opening base pairs. Because the subunits of 2 are kept by the linker at a close distance from each other, this compound could also be an interesting model system for studying electron transfer or intramolecular energy redistribution between the subunit chromophores.
Materials and Methods
Apparatus and Procedures.
Measurements were performed in the Laboratory for Molecular Sciences facility at the California Institute of Technology. Details of the apparatus (Fig. 2B) have been described (15). Briefly, the output of a femtosecond amplified titanium-sapphire laser system was split into two pulse trains to pump two optical parametric amplifiers, providing pump and probe pulses with independent wavelength tunability. The pump pulse passed through a computer-controlled optical delay line, a chopper, and a polarizer and crossed the probe beam in the sample cell at a small angle (≈2°). The probe beam was also passed through a polarizer that was adjusted to produce a linear polarization at the sample at an angle of 54.7° with respect to that of the pump beam. Pulse energies at the sample were typically 3 μJ for the pump and 50 nJ for the probe, with beam diameters of ≈0.5 mm.
After traversing the sample, the probe pulse was passed through a polarizer for separation of light polarized parallel and perpendicular to the pump beam. The respective energies of the two beams were measured on two separate photodiodes. Their values were normalized with respect to the probe energy measured before the sample cell by a third photodiode. The ratio between normalized transmitted probe energies in the presence and absence of excitation of the sample by the pump pulse formed the basis of the polarization-resolved ΔA transients, recorded as a function of the time delay t between passage of the pump and probe pulses. The LD signal was calculated as (ΔA∥ − ΔA⊥), and the isotropic signal was calculated as (ΔA∥ + 2ΔA⊥). The normalized dichroism—or transient anisotropy—is the LD divided by the isotropic signal. As a calibration of the experimental setup, the anisotropy decay of rhodamine 6G in methanol was measured, giving a consistent lifetime of 120 ± 10 ps, which is in good agreement with previous measurement (16).
The pump pulse was tuned to 502 ± 2 nm. The sample concentrations were chosen such that the absorbance in the sample cells, with either 1-mm or 5-mm path length, was between 0.2 and 1 at 500 nm. No difference in lifetimes was found for different concentrations. When using cells with a 5-mm path length, the samples were stirred with a magnet. The pure solvent response was monitored and was not found to contribute significantly to the total signal from our samples. All measurements were performed at a temperature of 24°C.
The measured transients were analyzed by fitting to a sum of exponential terms of amplitude Ai and lifetime τi, S(t) = ΣAi exp(−t/τi), with the minimum number of components required to leave no systematic deviation of the residuals. Convolution with a Gaussian response function was included in the fitting procedure.
Materials.
Δ-[Ru(phen)2dppz]Cl2 was prepared as described elsewhere (17). The monomer chromophore (1), Δ-[Ru(phen)2cpddpzC4NH2](PF6)2, and the dimer (2), Δ,Δ-[μ-c4(cdppz)2-(phen)4Ru2]Cl4, were prepared analogously by condensation of Δ-[Ru(phen)2(1,10-phenanthroline-5,6-dione)]2+ with the appropriate 5,6-diaminoindan derivative in acetonitrile solution (14, 17). The products were isolated as their hexafluorophosphate salts and purified by chromatography on alumina, with acetonitrile/acetic acid (20:1 vol/vol) and pure acetonitrile as eluents for 1 and 2, respectively. The hexafluorophosphate salt of 1 was sufficiently soluble in water, but 2 had to be converted to the water-soluble chloride salt by precipitation with tetra-n-butylammonium chloride in acetone.
The solvent was deionized water (milli-Q), except for the DNA samples, for which we used a buffer (5 mM phosphate/50 mM NaCl, pH 7, aqueous solution). Measurements were performed under ambient conditions. An absorption spectrum was recorded on the sample before and after each laser run to ensure the quality of the sample throughout the course of the measurement. No significant degradation of the samples was found.
Results and Discussion
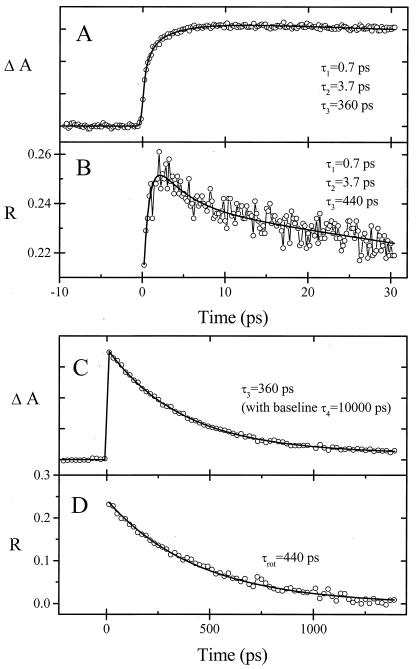
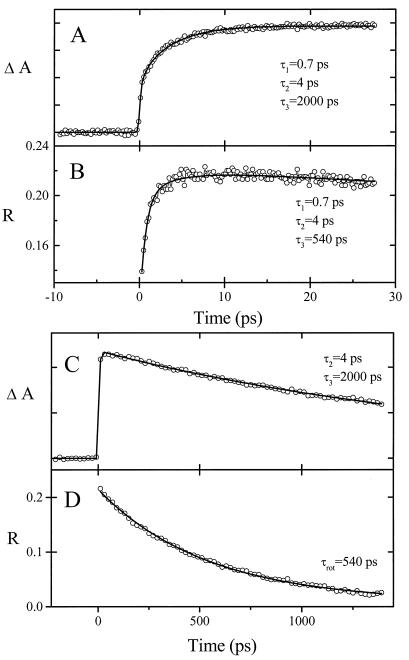
Transient LD‖ was measured for the monomer 1 (Fig. 3) and the dimer 2 (Fig. 4) in H2O and when bound to DNA (Fig. 5). The anisotropy is a useful probe, particularly in resolving the initial dynamics, because it is sensitive to changes in the direction of the transition moment(s) caused by changes of electronic structure. Thus, although the transient isotropic absorption frequently could be fitted over the time scale of tens of picoseconds with only one exponential component of a few picoseconds, the anisotropy required two exponential lifetimes in this time range. For the short time traces, both anisotropy and isotropic transients were fitted with the same set of time constants, because the rotational depolarization occurs on a much longer time scale (see below).
Figure 3.
Transient absorption (A and C) and anisotropy (R) (B and D) of 1 (Δ isomer) in water on two different time scales. The pump wavelength was 502 ± 2 nm, and the probe wavelength was 566 ± 2 nm. Time constants are indicated. Inclusion of a long lifetime decay (with an amplitude of 6–14% at all wavelengths) was required for a good fit of the relaxation to the ground state (see text).
Figure 4.
Transient absorption (A and C) and anisotropy (B and D) of 2 (Δ,Δ isomer) in water on two different time scales. Pump and probe wavelengths are as described for Fig. 3. Time constants are indicated.
Figure 5.
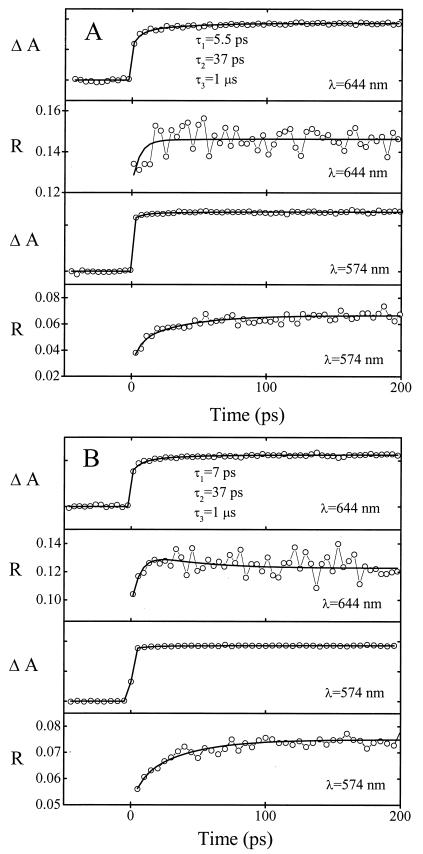
Long time scale transient absorption and anisotropy of 1 (A) and 2 (B) bound to DNA (mixed-sequence calf thymus DNA). Short time scale traces (up to t = 20 ps, not shown) were included in the global fitting of the time constants shown. The samples contained 75 μM Ru(phen)2dppz subunits and 1.5 mM DNA bases in 5 mM phosphate (pH 7) and 50 mM NaCl aqueous solution. The pump wavelength was 502 ± 2 nm. The probe wavelengths and time constants are indicated.
In all experiments, the excitation (pump) wavelength was 502 ± 2 nm, which is on the red side of the first MLCT absorption band (see Fig. 2A). Although the molecular extinction coefficient is substantially lower in this region of the spectrum, far from the absorption maximum, this wavelength was chosen to minimize the effect of overlapping transitions. As has been reported for [Ru(phen)2dppz]2+ (18) and confirmed for 1 and 2 (not shown), the absorption at wavelengths above λ = 500 nm is dominated (≈70–80%) by a component that is polarized along the 2-fold symmetry axis of the metal complex, i.e., parallel to the long axis of the dppz ligand.
For a probe wavelength of 566 nm (Fig. 3), both absorption and anisotropy transients for 1 in water are consistent with three significant lifetimes: τ1 = 0.7 ps, τ2 = 3.7 ps, and τ3 = 360 ps. Fig. 4 shows the corresponding transients for 2 dissolved in water. Also for this case, three significant lifetimes are obtained: τ1 = 0.7 ps, τ2 = 4 ps, and τ3 = 2,000 ps. Two time constants (0.7 and ≈3 ps) were also found in the short time behavior of the unsubstituted [Ru(phen)2dppz]2+ in water, for which the recombination lifetime was measured as 260 ± 25 ps, in agreement with the reported value (1). For both monomers, a minor fourth component was detected, with constant amplitude over our time range (see Fig. 3). Our results show that the two short lifetimes are almost identical for 1 and 2 and strongly indicate that the chromophores of molecules 1 and 2 follow a similar route to equilibration to the lowest excited state. In the discussion below, we shall propose that solvation plays a key role in the equilibration process.
The longest lifetime (τ3) of 2 has been identified with the 1.9-ns lifetime (preexponential factor 98%) of its lowest emitting state, as measured with a SPEX Fluorolog-τ2 phase modulated instrument (with a 5-W CW Spectra-Physics argon ion laser exciting at 458 nm). The dimer (2) relaxes to the ground state about six times more slowly than the monomer (1). Various experimental results (see below) indicate that the subunits of 2 interact with each other. We believe that such interactions are the main reason for the difference in τ3 found between 1 and 2 in water solvent.
Figs. 3D and 4D show the decay of the anisotropy on a long time scale. Once the lowest excited state is reached, the decay of the anisotropy shows the rotational relaxation of the molecules (19). All of the rotational relaxation curves correspond to single exponential decays, in some cases to a constant nonzero background value. The rotational relaxation lifetimes (τrot) for 1 and 2 were estimated to be 440 ± 100 ps and 540 ± 100 ps, respectively. The time constant for rotational relaxation for unsubstituted [Ru(phen)2dppz]2+ (not shown) was measured to be 300 ± 50 ps, thus approximately twice as fast as for the dimer. According to the Stokes–Einstein–Debye hydrodynamics theory** (20), under the assumption that the molecules may be approximated hydrodynamically as spheres, the rotational lifetimes correspond to molecular radii of 6.9 Å for [Ru(phen)2dppz]2+, 7.9 Å for 1, and 8.4 Å for 2. These values are in reasonable agreement with distances measured from molecular models of the monomers, as well as for 2 when it is assumed to exist in a contracted conformation. These observations point toward a folded conformation of 2 in water solution. The monoexponential decay of the anisotropy for 2 also indicates that the molecule adopts a rigid, folded conformation in water.
There are additional indications that the subunits of 2 interact with each other in the ground state in aqueous solution: in the CD spectrum of 2, an induced CD band at the position of the 380 nm π → π* dppz transition indicates short-distance interactions of the two subunits (results not shown). Also, the absorption spectrum of 2 in water, in contrast to [Ru(phen)2dppz]2+, shows broadening at low temperature, indicating the presence of interactions between the linked chromophores. The driving force could be hydrophobic and dispersive interactions between the aromatic moieties. Because the lifetime of the lowest excited state (apparently) depends sensitively on water solvation, the folded conformation and associated disruption of the water shell could explain the longer lifetime observed for 2.
Solvation and Relaxation.
Absorption of light of 500 nm initially leads to a mixture of charge-separated states, in which one electron is transferred from the metal to either a phen or the dppz ligand. This transfer increases the dipole moment of the excited state, compared with that of the ground state (21, 22). The solvent around the chromophore equilibrates in response to the electric field of the new, stronger dipole to minimize the energy. This equilibration is fast because of the high transverse and rotational mobility of the small water molecules (23–25). Recent studies have shown that rotational reorientation of water molecules in the bulk liquid takes place on two time scales, with associated time constants of about τ = 0.7 ps and τ = 4 ps, respectively (26, 27). The biphasic behavior is inferred to be due to rotation of weakly and strongly hydrogen-bonded molecules, respectively. It is interesting to note that these times almost exactly coincide with the two fast relaxation times (described by τ1 and τ2) that we note for both compounds 1 and 2. This observation leads us to propose that solvation of the charge-separated state plays a key role in the relaxation to the lowest excited state.
The relatively large change in the anisotropy (≈+0.1) associated with the 700-fs time constant of 1 and 2 when probing at 566 nm, where absorption is dominated by the low-lying π–π* transitions of the anion radicals, indicates that the corresponding process is associated with significant changes of the electronic states. An obvious source of a large charge reorganization is the charge transfer phen⋅ → dppz⋅ for an initially phen-localized MLCT state. The resulting rotation of a large dipole moment can be expected to be coupled strongly to the collective field of water dipoles, without interaction with any specific water molecules.
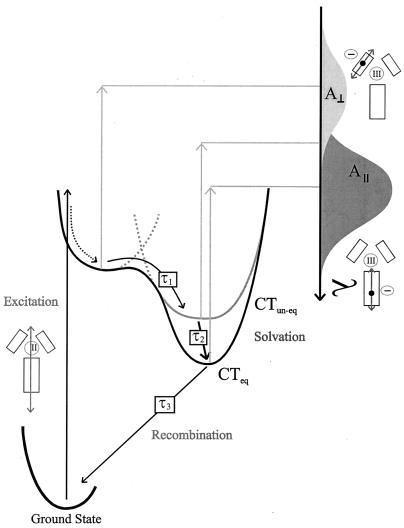
The time constant for the second process (τ2 ≈ 4 ps), visible in both the anisotropy and the isotropic absorption, coincides with that of reorientation of strongly hydrogen-bonded water. This fact suggests that solvent reorientation is rate-limiting, but the total process may involve formation or reinforcement of hydrogen bonds between water and aza lone-pairs of the dppz ligand anion radical, interactions that will lower the energy of the radical's half-filled highest occupied molecular orbital. The rather small anisotropy change associated with the second phase could be a result of a minor solvatochromic change of overlap between short- and long-axis polarized bands in the dppz anion radical. Fig. 6 depicts schematically how we envisage the relaxation processes of 1 and 2 in water solvent.
Figure 6.
Schematic for the proposed relaxation pathways of 1 and 2 in water solution. The pump pulse selects overlapping MLCT singlet transitions (dominated by the indicated A polarized transition), populating MLCT states in which either the dppz or one of the phen ligands is reduced. Solvent field reorientation facilitates the phen⋅ → dppz⋅ transfer of charge such that all initially excited states end up in the dppz-localized MLCT state (CTun-eq). This transfer occurs in 700 fs (τ1). The solvent equilibration process continues (with an associated time constant, τ2, of 4 ps) involving reinforcement of hydrogen bonds and, as a consequence, a further lowering of energy (CTeq). The final modified MLCT state has a fast radiationless deactivation in water: a lifetime (τ3) of 360 ps is observed for 1, and a lifetime of 2,000 ps is observed for 2. Overlapping excited state absorption bands of orthogonal polarizations schematically illustrate how relaxation may lead to changes in anisotropy and/or isotropic absorption.
When the dimer (2) is dissolved in 2H2O, τ2 increases from 4 to 5 ps (results not shown), which correlates very well with an isotope effect of ≈0.8 (τH2O/τ2H2O) measured for the reorientation of water at room temperature (28). Also the lifetime of the final MLCT state is increased significantly in 2H2O compared with H2O (from 2 ns to 7 ± 2.5 ns), similar to the effect observed for [Ru(phen)2dppz]2+ (1). When the molecules are dissolved in alcohol, the emission lifetime increases dramatically, and the equilibration to the lowest excited state is evidently slowed down significantly compared with that in water.
DNA Interactions.
When the molecules 1 and 2 are bound to DNA (Fig. 5), two relaxation processes on the picosecond time scale are found for both complexes (τ1 ≈ 7 ps; τ2 ≈ 37 ps). No indication was found of the subpicosecond relaxation process observed in water solution. The processes in DNA have low amplitudes in the isotropic absorbance as well as in the anisotropy at the studied wavelengths and have not been reported in previous studies of [Ru(phen)2dppz]2+ (pumping at 355 nm; ref. 1). However, reinvestigating [Ru(phen)2dppz]2+ (pumping at 500 nm) when bound to DNA, we found that the dynamics of this unsubstituted chromophore are similar to those of 1 and 2 and do indeed show these picosecond processes. When probing at 574 nm, change is barely significant in the isotropic transient signal, whereas it is clearly visible in the anisotropy; when probing at 644 nm, the dynamics are also evident in the isotropic transients.
The fast processes (τ1 ≈ 7 ps and τ2 = 37 ps) found for both compounds when bound to DNA are due to structural and electronic equilibration of the Ru(ligand)-DNA complex. Fast introduction of a negative charge on the ligand situated between the base pairs of DNA could be anticipated to have a significant effect on the interactions between this ligand and the DNA bases. The whole complex will have to adopt to the new and quite different electrostatic situation. The subsequent solvation process may involve structural rearrangement of the DNA binding pocket as well as changes of the location of the metal complex in it. However, changed polarization caused by angular reorientation can be expected to be small on this time scale. Instead, the changes in dichroism are most probably due to changed overlap of probed transitions as a result of such subtle structural rearrangements.
Lifetime measurement on the nanosecond time scale (with the phase modulation spectrofluorometer; excitation at 458 nm) showed that there is no significant difference in recombination time between 1 and 2 when bound to DNA, in contrast to the results in water solution. This finding confirms that the two subunits of 2 bind to DNA as two separate chromophores without mutual interactions that significantly affect their excited-state lifetimes. The trend of recombination lifetime—from hundreds of nanoseconds in DNA, acetonitrile, and alcohols, to 2 ns for the dimer in water, to subnanoseconds for the monomers in water—could indicate a reversal of ordering of MLCT states in different solvents, as previously suggested (1), or that the relaxation of the lowest MLCT state is dramatically and progressively accelerated by hydrogen-bonding interactions with water.
Conclusions
In this study, we have resolved time scales of charge redistribution (700 fs), equilibration (4 ps), and recombination (260 ps and longer) for the [Ru(phen)2dppz]2+ chromophore in water. The time scales of charge redistribution and equilibration are very similar to the two time scales of bulk water orientational relaxation attributed to collective reorientation of weakly and strongly hydrogen-bonded water molecules, suggesting that the latter processes are rate-limiting steps of the solvated chromophore relaxation. The time scale for recombination depends on the molecular structure, thereby shedding new light on the nature of the “light-switch” mechanism. The dramatic lengthening of the recombination time of the dimer in water is probably due to stacking interactions of the two planar dppz moieties, which affect the degree of solvation of the excited state. On intercalation of the chromophores in DNA, the observed relaxation processes have time constants of ≈7 ps, 37 ps, and hundreds of nanoseconds, again indicating the critical role of solvent environment. The lengthening of equilibration time scales can be related to the exclusion of mobile water molecules and to the relative rigidity of the DNA intercalation pocket.
Acknowledgments
B.Ö. would like to thank The Royal Swedish Academy of Sciences for the Berzelianum Scholarships of 1998 and 1999 that made his visit to the California Institute of Technology possible. The Swedish part of the project was supported by the Natural Science Research Council (NFR). The Laboratory for Molecular Sciences at the California Institute of Technology is supported by the National Science Foundation.
Abbreviations
- CT
charge-transfer
- MLCT
metal-to-ligand CT
- LD
linear dichroism
Footnotes
cpdppzC4NH2 = N-(12-cyano-12,13-dihydro-11H-cyclopenta[b]dipyrido[3,2-h:2′,3′-j]phenazine-12-carbonyl)-1,4-diaminobutane; c4(cdppz)2 = N,N′-bis(12-cyano-12, 13-dihydro-11H-cyclopenta[b]dipyrido[3,2-h:2′,3′-j]phenazine-12-carbonyl)-1,4diaminobutane.
Article published online before print: Proc. Natl. Acad. Sci. USA, 10.1073/pnas.100127397.
Article and publication date are at www.pnas.org/cgi/doi/10.1073/pnas.100127397
A macroscopically oriented uniaxial sample is prepared by photoselective excitation. This sample will behave anisotropically to light that is polarized parallel and perpendicular to the exciting light pulse (pump). The maximum value of the anisotropy for an immobile chromophore is 0.4, a value rarely reached for various reasons. In particular, if the transition moments of the two transitions involved in the pump-probe experiment have different directions, the maximum R is reduced by a factor of (3cos2x − 1)/2, where x is the angle between the two transition moments. This effect is inevitable when absorption bands of transitions with different transition moments overlap, as occurs in the entire range of the ground state absorption spectrum in these ruthenium chromophores (18). Therefore, the relaxation from the initial photoselected population, distributed over several excited states, may lead to a complicated decay of the dichroism.
According to the Stokes–Einstein–Debye hydrodynamic theory of rotational motion, the rate of rotation depends on the size and shape of the molecule and the viscosity of the solvent. If the molecule has a shape that cannot be approximated by a sphere, the relative directions of the transition moments in the molecule are also important. Under a spherical approximation, the anisotropy is expected to decay according to the equation R(t) = R0 exp(−6Dt), with D the rotational diffusion coefficient, given by D = kT/(6Vη). Here, V is the volume of the molecule, and η is the viscosity of the solvent. If the molecule instead is approximated by an ellipsoid with transition moments parallel to its long axis, the equation must include a correction factor (f) that depends on the ratio between the long and short axes: D = kTf/(6Vη). Molecular volumes were approximated with molecular models made in the software package hyperchem.
References
- 1.Olson E J C, Hu D, Hörmann A, Jonkman A M, Arkin M R, Stemp E D A, Barton J K, Barbara P F. J Am Chem Soc. 1997;119:11458–11467. [Google Scholar]
- 2.Turro C, Bossmann S H, Jenkins Y, Barton J K, Turro N J. J Am Chem Soc. 1995;117:9026–9032. [Google Scholar]
- 3.Sabatini E, Nikol H D, Gray H B, Anson F C. J Am Chem Soc. 1996;118:1158–1163. [Google Scholar]
- 4.Friedman A E, Chambron J-C, Sauvage J-P, Turro N J, Barton J K. J Am Chem Soc. 1990;112:4960–4962. [Google Scholar]
- 5.Jenkins Y, Friedman A E, Turro N J, Barton J K. Biochemistry. 1992;31:10809–10816. doi: 10.1021/bi00159a023. [DOI] [PubMed] [Google Scholar]
- 6.Holmlin E R, Stemp E D A, Barton J K. Inorg Chem. 1998;37:29–34. doi: 10.1021/ic970869r. [DOI] [PubMed] [Google Scholar]
- 7.Krausz E, Ferguson J. Prog Inorg Chem. 1989;37:293–390. [Google Scholar]
- 8.Amouyal E, Homsi A, Chambron J-C, Sauvage J-P. J Chem Soc Dalton Trans. 1990;6:1841–1845. [Google Scholar]
- 9.Chambron J-C, Sauvage J-C, Amouyal E, Koffi P. Nouv J Chim. 1985;9:527–529. [Google Scholar]
- 10.Coates C G, Jacquet L, McGarvey J J, Bell S E J, Al-Obaidi A H R, Kelly J M. J Am Chem Soc. 1997;119:7130–7136. [Google Scholar]
- 11.Schoonover J R, Bates W D, Meyer T J. Inorg Chem. 1995;34:6421–6422. [Google Scholar]
- 12.Damrauer N H, Cerullo G, Yeh A, Boussie T R, Shank C V, McCusker J K. Science. 1997;275:54–57. doi: 10.1126/science.275.5296.54. [DOI] [PubMed] [Google Scholar]
- 13.Damrauer N H, McCusker J K. J Phys Chem A. 1999;103:8440–8446. [Google Scholar]
- 14.Önfelt B, Lincoln P, Nordén B. J Am Chem Soc. 1999;121:10846–10847. [Google Scholar]
- 15.Fiebig T, Wan C Z, Kelly S O, Barton J K, Zewail A H. Proc Natl Acad Sci USA. 1999;96:1187–1192. doi: 10.1073/pnas.96.4.1187. [DOI] [PMC free article] [PubMed] [Google Scholar]
- 16.Philips L A, Webb S P, Clark J H. J Chem Phys. 1985;83:5810–5821. [Google Scholar]
- 17.Hiort C, Lincoln P, Nordén B. J Am Chem Soc. 1993;115:3448–3454. [Google Scholar]
- 18.Lincoln P, Broo A, Nordén B. J Am Chem Soc. 1996;118:2644–2653. [Google Scholar]
- 19.Henseler A, Vautely E. Chem Phys Lett. 1994;228:66–72. [Google Scholar]
- 20.Debye P. Polar Molecules. New York: Dover; 1929. [Google Scholar]
- 21.Shin Y-g K, Brunschwig B S, Creutz C, Sutin N. J Phys Chem. 1996;100:8157–8169. [Google Scholar]
- 22.Karki L, Hupp J T. Inorg Chem. 1996;36:3318–3321. doi: 10.1021/ic961349j. [DOI] [PubMed] [Google Scholar]
- 23.Jimenez R, Fleming G R, Kumar P V, Maroncelli M. Nature (London) 1994;369:471–473. [Google Scholar]
- 24.Jarzeba W, Walker C G, Johnson A E, Kahlow M A, Barbara P F. J Phys Chem. 1988;92:7039–7041. [Google Scholar]
- 25.Gale G M, Gallot G, Hache F, Lascoux N, Bratos S, Leicknam J-C. Phys Rev Lett. 1999;82:1068–1071. doi: 10.1103/physreve.61.5211. [DOI] [PubMed] [Google Scholar]
- 26.Woutersen S, Emmerichs U, Bakker H J. Science. 1997;278:658–660. [Google Scholar]
- 27.Woutersen S, Bakker H J. Nature (London) 1999;402:507–509. [Google Scholar]
- 28.Rønne C, Åstrand P-O, Keiding S R. Phys Rev Lett. 1999;82:2888–2891. [Google Scholar]


