

Abstract
Active expression of putative ammonia monooxygenase gene subunit A (amoA) of marine group I Crenarchaeota has been detected in the Black Sea water column. It reached its maximum, as quantified by reverse-transcription quantitative PCR, exactly at the nitrate maximum or the nitrification zone modeled in the lower oxic zone. Crenarchaeal amoA expression could explain 74.5% of the nitrite variations in the lower oxic zone. In comparison, amoA expression by γ-proteobacterial ammonia-oxidizing bacteria (AOB) showed two distinct maxima, one in the modeled nitrification zone and one in the suboxic zone. Neither the amoA expression by crenarchaea nor that by β-proteobacterial AOB was significantly elevated in this latter zone. Nitrification in the suboxic zone, most likely microaerobic in nature, was verified by 15NO2− and 15N15N production in 15NH4+ incubations with no measurable oxygen. It provided a direct local source of nitrite for anammox in the suboxic zone. Both ammonia-oxidizing crenarchaea and γ-proteobacterial AOB were important nitrifiers in the Black Sea and were likely coupled to anammox in indirect and direct manners respectively. Each process supplied about half of the nitrite required by anammox, based on 15N-incubation experiments and modeled calculations. Because anammox is a major nitrogen loss in marine suboxic waters, such nitrification–anammox coupling potentially occurring also in oceanic oxygen minimum zones would act as a short circuit connecting regenerated ammonium to direct nitrogen loss, thus reducing the presumed direct contribution from deep-sea nitrate.
Keywords: ammonia-oxidizing bacteria, amoA gene expression, marine group, Crenarchaeota, marine nitrogen loss
Nitrification, the stepwise oxidation of ammonium to nitrite and then nitrate, is a key process in marine nitrogen cycling. It is responsible for the formation of the large deep-sea nitrate reservoir. It connects the recycling of organic nitrogen to the ultimate nitrogen loss from the oceans, because its products are substrates for denitrification and anaerobic ammonium oxidation (anammox), the only two presently known nitrogen loss processes. In productive waters such as upwelling regions, high fluxes of organic matter and thus remineralization create strong subsurface oxygen minima, enabling denitrification (1–4) or anammox (5–8) to occur. Nitrogen losses from these oxygen minimum zones (OMZs) are estimated to account for 30–50% of total nitrogen loss from the oceans (9, 10). Because remineralization also releases large amounts of ammonium, high nitrification rates are often associated with these OMZs (11), implying that nitrification may play an important role in promoting marine nitrogen loss.
The Black Sea is the largest marine anoxic basin in the world. A 20- to 40-m-thick suboxic transitional zone, characterized by low oxygen (<5 μM) and undetectable sulfide, persists throughout the basin between the surface oxic layer and the sulfidic anoxic deep water (≥100 m) (12, 13). The exact depth zonation varies according to the location within the basin because of circulation and gyre formation, but similar concentrations of chemical species can be traced along isopycnals or density (σt) surfaces throughout the basin (12). Therefore, the Black Sea provides an ideal model system to study nitrogen cycling processes along oxygen gradients. Nitrification has been reported in the lower oxic zone (14) and so has nitrogen loss via anammox in the suboxic zone (15). Nevertheless, the identity and abundance of the responsible nitrifiers, or any coupling between nitrification and nitrogen losses, remain poorly documented.
The first and rate-limiting step of nitrification is aerobic ammonia oxidation. It is a microbially mediated reaction. For decades, only specific groups of β- and γ-proteobacteria have been found to exhibit this capability. However, recent metagenomic studies in the Sargasso Sea (16, 17) and later of a marine sponge symbiont (18) have identified in marine group I (MGI) Crenarchaeota genes encoding proteins resembling ammonia monooxygenase (AMO), the key enzyme in aerobic ammonia-oxidizing bacteria (AOB). This chemoautotrophic ammonia-oxidizing potential was confirmed in Candidatus “Nitrosopumilus maritimus,” an MGI crenarchaeon isolated from a marine aquarium (19). This crenarchaeon is highly similar to the Sargasso Sea phylotypes based on their 16S rRNA (>98% sequence identity) and putative AMO (93–98% amino acids homology) sequences. This putative AMO is, however, only 38–51% (amino acids) homologous to those of AOB. Since then, similar sequences of crenarchaeal AMO gene subunit A (amoA) (69–99% amino acid homology) have been detected in various marine water columns and sediments, including the Black Sea (20). Because nonthermophilic MGI Crenarchaeota constitute a significant portion of oceanic picoplankton (up to 30%) (21, 22) and a considerable fraction are likely autotrophic (23, 24), it is speculated that these MGI Crenarchaeota could be more important nitrifiers in the oceans than the usually less abundant AOB (18, 19). Indeed, crenarchaeal amoA genes were reported to be more abundant than bacterial amoA in a North Atlantic study (25). However, no published data to date have shown crenarchaeal amoA expression in marine environments.
In this study, we provide direct evidence of crenarchaeal amoA activities in the Black Sea water column. Its expression was compared quantitatively with that of bacterial amoA. In addition, coupling between nitrification and anammox was examined by using a combination of gene abundance and expression analyses, high-resolution chemical profiling, reaction-diffusion modeling, and 15N incubation experiments.
Results and Discussion
Hydrochemical Settings.
In accord with previous findings, dissolved oxygen in the central Black Sea (43°14.9′N, 34°00.0′E) [supporting information (SI) Fig. 5] decreased from fully oxic to <5 μM at 85 m (σt = 15.83, for comparison with studies in other parts of the basin) (Fig. 1). The suboxic zone extended from this depth to 112 m (σt = 16.15) below which sulfide started to accumulate. Nitrate formed a distinct maximum (≈5 μM) centered ≈76 m (σt = 15.61), but dropped to background or below detection shallower than 55 m or deeper than 100 m. Nitrite was slightly elevated (20–42 nM) at ≈55, 80 and 105 m, and was otherwise close to detection limit. Ammonium levels were <80 nM in the oxic zone except for slight elevations at 20 m and 78 m, and increased substantially upon nitrate disappearance to micromolar levels below 100 m. From the NOx− concentration profile, a reaction-diffusion model was used to calculate total net NOx− production rates of up to 10 nM day−1 at 78 m (Fig. 2d), which were within the range of the potential nitrification rates (5–50 nM day−1) previously measured (14). Our model showed that net nitrification occurred only within a narrow zone (71–81 m) (Fig. 2).
Fig. 1.

Vertical distribution of inorganic nitrogen (a), O2 and sulfide (b), light transmission, particulate MnOx, and total reduced Mn (c), and anammox bacterial abundance and 15N2 production rates (d).
Fig. 2.

Vertical distribution of amoA expression (mean ± SD from 3× qPCR) by, and cellular abundance of: putative ammonia-oxidizing crenarchaea (a), βAOB (b), and γAOB (c). Abundance of putative ammonia-oxidizing crenarchaea was estimated as crenarchaeal CARD-FISH cell counts multiplied by amoA:16S rRNA gene ratios (except for 100 m and 105 m where ratio was >1, crenarchaeal CARD-FISH counts were used directly). γAOB were direct CARD-FISH counts, and βAOB abundance was estimated as βAOB:γAOB amoA gene copy ratios × γAOB cell counts ÷ 3 [typical amoA gene copies in βAOB (59)]. (d) Modeled production and consumption rates of NH4+ and NOx−.
Active Microbial Community Structure.
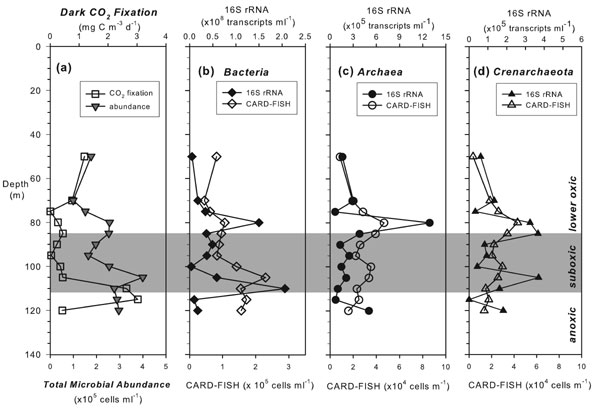
Bacteria (38–60% of total microbial abundance as DAPI-stained cells) dominated over Archaea (5–20% DAPI) in all sampled depths based on 16S rRNA-targeted catalyzed reporter deposition (CARD)-FISH results (SI Fig. 6). The highest bacterial abundance and 16S rRNA transcript levels [measured by reverse-transcription quantitative PCR (qPCR)] were reached at the nitrate maximum and the oxic–anoxic interface, coinciding with elevated dark CO2 fixation rates (SI Fig. 6). The archaeal populations were largely Crenarchaeota (41–95% of total Archaea), whose contribution to the total community peaked at the nitrification zone (19% DAPI). Active archaeal communities at 80 m, 100 m, and 105 m comprised exclusively of MGI Crenarchaeota, as revealed by phylogenetic analyses of reverse-transcribed 16S rRNA. The majority shares 92–99% sequence identity with the ammonia-oxidizing isolate Candidatus“N. maritimus”, and belong to the large MGI α-cluster (SI Fig. 7). Sequences retrieved from different depths did not form disparate subclusters. Anammox bacteria were present only in the suboxic zone, as verified by CARD-FISH and quantified by qPCR of their 16S rRNA genes, reaching a maximum at 100 m (2.6 × 10³ cells ml−1) where the highest anammox rate was measured (M.M.J., B.T., G.L., and M.M.M.K., unpublished results) (Fig. 1). The highest γ-proteobacterial AOB abundance (5.4 × 10³ cells ml−1) was also observed at this depth (Fig. 2).
Active Expression of Crenarchaeal Putative amoA Genes.
Crenarchaeal putative amoA was strongly expressed within the narrow nitrification zone, whereas close to background levels were measured at other depths (Fig. 2). In comparison, high gene abundance was also observed near the oxic–anoxic interface, where there were secondary maxima in crenarchaeal cellular and 16S rRNA transcript abundance. The identities of crenarchaeal amoA genes were confirmed by clone library screening at both DNA and mRNA levels at 80 m, 100 m, and 110 m, representing the lower oxic, suboxic zones, and oxic–anoxic interface, respectively. The sequences retrieved are 70–91% homologous to the amoA of Candidatus “N. maritimus” at the nucleotide level, but only 33–37% and 30–37% to those of β- and γ-proteobacterial ammonia-oxidizing bacteria (βAOB and γAOB), respectively. Eleven operational taxonomic units (OTUs) were identified in total, with three unique to 80 m (BS157-G8/-D4/-H3) and two to 100 m (BS160-F11/-G4). More diverse crenarchaeal amoA were expressed in the nitrification zone compared with the two deeper depths (Fig. 3). Most of the obtained sequences fell into the marine clusters A, B, and C (20), but three OTUs fell into the “sediment” cluster, which also included Candidatus “N. maritimus.”
Fig. 3.

A maximum likelihood tree of bacterial and crenarchaeal amoA obtained in the Black Sea water column. Branching patterns are supported by >50% bootstrap values (1,000×) by means of maximum parsimony and distance methods, and their respective %bootstrap values are denoted. Only representative OTUs (<98% sequence identity) are shown (in bold). An OTU marked with an asterisk indicates its uniqueness to that depth. The marine A, B, and C and sediment clusters previously defined (20) are also shown. The symbols (stars, squares, circles) indicate expressed sequences.
Crenarchaeal Versus Bacterial Ammonia Oxidation in the Lower Oxic Zone.
Despite the barely detectable gene abundance, strong amoA expression by AOB was detected within the nitrification zone (Fig. 2). γAOB amoA expression, in particular, was up to nearly 3-fold greater than that of crenarchaea. If we assume AOB cellular nitrification rates of 6–20 fmol of N cell−1 day−1 (26, 27), the abundance of AOB (≤1,400 cells ml−1) present might support at most a rate of 7–24 nM day−1. Although this rate estimate lies in the same range as the modeled net nitrification rate (10 nM day−1), it is insufficient to meet the upper range of 5–50 nM day−1 previously measured (14). Some other organisms had to be nitrifying at the same time, and would most likely be the highly abundant MGI Crenarchaeota (4.3 × 10⁴ cells ml−1).
The striking correspondence of the maximum crenarchaeal amoA gene expression and gene abundance, to the NOx− maxima and the narrow modeled nitrification zone, indicates that MGI Crenarchaeota were involved in nitrification in the lower oxic zone. Compared with total AOB amoA, crenarchaeal amoA genes were 43-fold more abundant (SI Table 1). This crenarchaeal amoA predominance is consistent with the observations in the two environmental studies that compared crenarchaeal and bacterial ammonia-oxidizers (25, 28). If we assume a crenarchaeal cellular nitrification rate of 2–4 fmol of N cell−1 day−1 (25) and that each crenarchaeal cell contains at most one copy of amoA gene, based on the metagenome of Cenarchaeum symbiosum (18), amoA-containing crenarchaea in the nitrification zone (2.3 × 10⁴ cells ml−1) could account for an NOx− production of 46–92 nM day−1. The lower end of this estimate would have already been sufficient to explain the previously measured rate (5–50 nM day−1) (14) and exceeds our modeled rate (10 nM day−1).
Whereas an increase in amoA mRNA levels within the same group of organisms might indicate their respective elevated nitrification rates, as suggested in some transcription studies with AOB (29–32) and a soil crenarchaeon (33) upon NH4+ stimuli, the absolute quantities of amoA mRNA should not be singularly used to compare nitrifying activities amongst different groups. This is because transcriptional regulation involves a complex network of global and specific regulators that the amount of amoA mRNA transcribed per mole of NH3 oxidized would almost certainly vary amongst species, physiological states or environmental conditions. Different species might possess different numbers of amoA gene copies per cell, such as the variations in crenarchaeal amoA:16S rRNA gene ratios observed in the Black Sea water column (oxic, 0.3–0.7; suboxic, 1.2–2.8; anoxic, 0.01–0.04) (SI Table 1) or in the North Atlantic study (25), although the possibility of other unknown organisms possessing amoA-like genes such as in the suboxic zone cannot be ruled out either. In addition, the stability and maintenance levels of amoA mRNA might differ from one group to another. At least some AOB are known to maintain low amoA mRNA levels even after prolonged starvation (29). It is possible that AOB in the Black Sea maintained a higher background amoA mRNA level than their crenarchaeal counterparts, and so a consistently higher bacterial amoA mRNA level despite low cell abundance. Besides, the gene encoding hydroxylamine oxidoreductase (hao), the enzyme responsible for the final energy-yielding step of ammonia oxidation, has not been identified in the metagenome of C. symbiosum (18). Considering also the different organization of amo subunits in a crenarchaeal genome versus AOBs (17, 18), ammonia-oxidizing crenarchaea may have an alternative energy-yielding system. Their amoA mRNA synthesis and degradation rates are not necessarily the same.
By using a statistical approach, a multiple stepwise linear regression demonstrated that within the lower oxic zone, crenarchaeal and γAOB amoA mRNA were the only valid predictors (out of the variables measured in this study) for nitrite distributions (r2 = 0.81, P < 0.05), the direct product of ammonia oxidation. Crenarchaeal amoA mRNA variation can explain 74.5% of the nitrite variation within the oxic zone, whereas γAOB amoA mRNA only accounts for 6.5%. This statistical analysis suggests that nitrite distribution and therefore nitrification in this zone was mainly controlled by crenarchaeal amoA expression.
Direct Nitrification–Anammox Coupling in the Suboxic Zone.
Since the first discovery of anammox in marine water columns (15, 34), where NH4+ and NO2− combine to produce gaseous N2, it has been an enigma whether NO2− comes from nitrification or nitrate reduction or both. Anammox occurred in the Black Sea suboxic zone and peaked at 100 m (≈11 nmol of N2 liter−1 day−1), where NO3− and NH4+ profiles intersected (Fig. 1) (M.M.J., B.T., G.L., and M.M.M.K., unpublished results). The reaction-diffusion model revealed a narrow zone (90–102 m) of net NH4+ loss reaching 14.1 nM day−1 at 100 m, or an integrated rate of 75.2 μmol of N m−2 day−1 (Fig. 2d). This NH4+ loss is double the total net NOx− consumption rate around these depths (≤ 7.0 nM day−1 or 36.7 μmol of N m−2 day−1). The total NOx− production in the oxic zone (55.5 μmol of N m−2 day−1) also could not match this NH4+ loss because of anammox, which consumes 1 mol of NO2− per mol of NH4+ oxidized. Therefore, an additional local source of NO2− and/or an additional loss of NH4+ must be present to reconcile the difference.
The best candidate to explain this phenomenon is microaerobic or anaerobic nitrification, whose direct coupling with anammox, the so-called completely autotrophic nitrogen removal over nitrite (CANON), has been demonstrated in bioreactors (35, 36). At 100 m, nitrification was evidenced by the production of 15NO2− (12.9 nM day−1) in incubations with 15NH4+ + 14NO2− and no measurable oxygen (Fig. 4). Parallel incubations with the addition of allylthiourea, an inhibitor specific for aerobic ammonia oxidation, yielded no 15NO2− production. Exposure to 5 μM of oxygen almost doubled the 15NO2− production rate (25.8 nM day−1) and previous oxic incubations have measured rates of ≈82 nM day−1 (14), thus supporting the presence and activities of the normally aerobic ammonia-oxidizers. Furthermore, coupling with anammox was directly shown in anammox rate measurements (M.M.J., B.T., G.L., and M.M.M.K., unpublished results) based on isotope pairing. Because of the 1-to-1 NH4+:NO2− stoichiometry and the fact that only one of these nitrogen pools was labeled with 15N at a time, anammox should produce 15N14N (and 14N14N) in all 15N incubations, and denitrification should produce 15N15N, 15N14N (and 14N14N) in 15NO2−incubations. Surprisingly, N2 gas in the form of 15N15N (4.6 ± 0.7 nmol of N2 liter−1 day−1) was produced at similar rates as 15N14N (6.8 ± 1.0 nmol of N2 liter−1 day−1) in incubations with 15NH4+ alone; but no 15N15N was produced in incubations with 15NO2− or 15NH4++14NO2− (Figs. 1 and 4). Clearly, the production of 15N15N in 15NH4+ incubations was a result of anammox being linked to nitrifiers when no other NO2− was readily available for anammox, whereas the lack of 15N15N produced in 15NO2− incubations indicates the absence of denitrification. In other words, both the modeled fluxes and 15N-incubations indicate that the NO2− flux from the lower oxic zone could only fuel about half of the total anammox N2 production, whereas the rest of NO2− likely came from in situ nitrification. Consequently, the total NH4+ loss because of direct nitrification-anammox coupling and regular anammox (2 × 15N15N and 1 × 14N15N production, because the NH4+ pool was essentially all 15N) would amount to ≈17 nM day−1 at 100 m, which is in good agreement with our modeled net NH4+ consumption (14.1 nM day−1). In addition, if the excess modeled net NH4+ loss over net NOx− loss (i.e., 14.1 − 7.0 = 7.1 nM day−1) was totally channeled to direct nitrification-anammox coupling, in which half of the NH4+ was taken up directly by anammox and the rest indirectly as NO2− after nitrification, then a total anammox rate as N2 production would be: 7.0 + (7.1 ÷ 2) = 10.55 nmol of N2 liter−1 day−1. This estimate is essentially the same as the rate measured by isotope-pairing (11.1 ± 1.7 nmol of N2 liter−1 day−1) (M.M.J., B.T., G.L., and M.M.M.K., unpublished results).
Fig. 4.

15N-incubation experiments with production of 14N15N and 15N15N from 15NH4+ (a), 14N15N and 15N15N from 15NO2− (b), and 14N15N, 15N15N, and 15NO2− from 15NH4+ + 14NO2− (c).
Further evidence of nitrification at 100 m is provided by the strong expression of γAOB amoA, which formed a distinct secondary maximum, along with their highest cell abundance (5.4 × 10³ cells ml−1). The identity of this expressed γAOB amoA was verified by a clone library constructed for this depth, retrieving sequences of 97% nucleotide sequence identity as Nitrosococcus oceani (Fig. 3). γAOB amoA expression was consistent with the inhibition of 15NO2−-production by allylthiourea. Assuming a cellular nitrification rate of 6–20 fmol of N cell−1 day−1, these γAOB might potentially support nitrification rates of 32–108 nM day−1, or 328–1,094 μmol of N m−2 day−1 integrated over 98–113 m, which is in the same order as the integrated anammox rates (293–406 μmol of N m−2 day−1) over the suboxic zone (M.M.J., B.T., G.L., and M.M.M.K., unpublished results). The cooccurrence of AOB and anammox bacteria at this depth was also reflected in their correlated abundances (Kendall τ = 0.62, P < 0.05 for βAOB and Pearson-correlation R = 0.86, P < 0.05 for γAOB), as well as their clustering in a principal component analysis (see SI Appendix).
The occurrence of nitrification in the absence of measurable oxygen is intriguing. By using a free-falling CTD equipped with an oxygen sensor (detection range 0–120% saturation, accuracy 2% sat.), we observed considerable temporal fluctuations in oxygen in the suboxic layer within a day (SI Fig. 8). These fluctuations were most likely lateral intrusions of oxygenated water, as the injections of foreign waters with different physical properties were evident from the deviations in temperature-salinity signatures and particle concentrations (% transmission) (SI Fig. 8). Whether these trace lateral oxygen intrusions were remnants of shelf-mixing brought in by the fringe of the Rim Current (37), or fossil turbulence from past local instabilities (38) or lateral intrusions of the Bosporus plume (39) reaching this far, remains to be determined. Despite a usual preference for oxic conditions by AOB, because of NH4+ availability AOB are often found actively nitrifying near oceanic OMZs (2, 3, 26), or even in virtually anoxic conditions (40, 41). At least some communities have shown low-oxygen adaptations by having a much higher oxygen affinity than their counterparts inhabiting high-oxygen settings (42). Although O2 was hardly detectable at 100 m, the amount of nitrification occurring at this depth required only nanomolar levels of O2, which is far below the detection limits of the instrumentation or chemical analyses currently available (≈1.5–2 μM). Alternatively, Mn(III)/(IV) may potentially serve as electron acceptors for anaerobic nitrification (43, 44), and they were detected as particulate MnOx right around this depth (Fig. 1). Nonetheless, as the oxidation of dissolved Mn(II)/(III) diffusing from below required oxygen, the presence of the oxidative product particulate MnOx itself at this depth indicated the presence of oxygen. Because nitrification with oxygen is thermodynamically more favorable than with MnO2 (ΔGR pH = 7 = −341 kJ mol−1 versus −175 kJ mol−1) (44), the former reaction would expectedly be preferred when both electron acceptors are present.
Despite their high abundance and metabolic activities (revealed by 16S rRNA levels) of the potentially ammonia-oxidizing crenarchaea, their putative amoA genes were not expressed at significantly elevated levels in the Black Sea suboxic zone. These observations may imply that in such suboxic settings, these crenarchaea were not using their nitrifying capabilities much but some other energy-acquisition pathways. For instance, MGI Crenarchaeota have been shown to take up amino acids in the North Atlantic, and the proportion of organotrophy, as reflected by the uptake ratio of d- to l-amino acids, increased with depth in the meso- and bathypelagic realms (45). In contrast, the significantly enhanced amoA expressions provide evidence for microaerobic nitrification by γAOB in the suboxic zone of the Black Sea.
Whether γAOB are the main microaerobic nitrifiers or not, our results clearly show that in the Black Sea suboxic waters, microaerobic nitrification is directly coupled to anammox by providing the latter a direct local source of nitrite. Similarly, direct nitrification-anammox coupling has been suggested in the Benguela upwelling system (5), where anammox was only detected in incubations with 15NH4+ but not with 15NO3− at one site or more, implying that nitrification rather than nitrate reduction was the source of nitrite for anammox in those cases. Currently, 30–50% of global marine nitrogen loss is estimated to occur in oceanic OMZs (9, 10) and increasing evidence has pointed to the prevalence of anammox over denitrification (5–8). If the same nitrification-anammox coupling, as observed in the Black Sea suboxic waters, also occurs in oceanic OMZs, then a substantial portion of total oceanic nitrogen loss would have come from regenerated NH4+ from the surface ocean, and not directly from deep-sea nitrate (SI Fig. 9).
Conclusions
A combination of microbial abundance and gene expression analyses, high-resolution chemical profiling, modeling, 15N incubation experiments and statistical analyses, shows that ammonia-oxidizing crenarchaea and γAOB were both important nitrifiers in the Black Sea water column. Our data suggest that crenarchaeal ammonia-oxidizers were mainly responsible for the NOx− production in the lower oxic zone. This NOx− indirectly supported about half of the anammox activities in the suboxic zone after downward diffusion and nitrate reduction. Meanwhile, γAOB resided alongside the anammox bacteria and remained actively nitrifying in the suboxic zone, thus providing anammox bacteria with a local nitrite source. Whether the same niche-differentiation occurs in other marine environments, whether other nitrifiers remain to be found, and whether all MGI Crenarchaeota are capable of and do autotrophic nitrification, should be investigated. Because anammox is a major nitrogen loss in the marine environment, nitrification-anammox coupling acts as a short circuit channeling regenerated N to direct N loss, reducing the presumed direct contribution from deep-sea nitrate.
Materials and Methods
Water Sampling, Chemical Analyses, and Dark Carbon Fixation.
A free-falling conductivity-temperature-depth (CTD) system (SBE 9plus; Sea-Bird Electronics, Washington, DC) equipped with an oxygen sensor (SBE 43; Sea-Bird Electronics; sampling at 24 Hz, range: 0–120%Sat, accuracy 2%Sat) was used to examine temporal variations in the physical properties of the water column. Water samples were collected by a pumpcast-CTD in high-resolution intervals, or by Go-Flo bottles on a CTD-rosette system. NH4+ was analyzed onboard fluorometrically (46), and NO2− and NO3− with an autoanalyzer in a shore-based laboratory. Sulfide concentration was measured onboard spectrophotometrically (47). Total dissolved Mn were determined with inductively coupled plasma and optical emission spectroscopy after filtering seawater through 0.45-μm cellulose acetate membrane filters and acidification with 250 μl of concentrated HNO3. Particulate MnOx were collected by in situ large-volume filtration (120–1,000 liters) onto glass fiber filters (GF/F; 14-cm diameter, 0.7-μm nominal pore-size). Particulate Mn was dissolved from 2-cm-diameter subsampled filter with 4 ml of 0.29 M hydroxylamine hydrochloride in 0.1 M HCl for 20 h (48) and then analyzed with flame atomic absorption spectrometry. Dark inorganic carbon fixation rates were determined as in ref. 24 with incubation time of 30–33 h.
15N Incubations and Analyses.
Anammox rates were measured by means of isotope-pairing (M.M.J., B.T., G.L., and M.M.M.K., unpublished results). 15NO2− production was measured in the same anoxic 15N incubation vials as in the anammox rate measurements, but 15NO2− was analyzed as N2 after a two-step reduction by acidified sodium iodide and then by copper at 650°C. Stable isotopic composition for N2 was determined by gas chromatography isotopic ratio mass spectrometry. Parallel samples were incubated with allylthiourea (86 μM final conc.), and/or with 5 μM oxygen, then 15NO2− production was determined.
CARD-FISH and Flow Cytometry.
Sampling and processing for CARD-FISH followed previously described protocols (49, 50). The oligonucleotides probes EUB338 I-III (51, 52), Nscoc128 (53, 54), Cren554 (55), and Eury806 (56) were used to enumerate Bacteria, γAOB, cren- and euryarchaea respectively. Abundance of total Archaea was taken as the sum of cren- and euryarchaea. Anammox bacteria was verified by CARD-FISH with the probe BS820 (15), but strong background fluorescence precluded accurate enumeration and qPCR was used for quantification. Total microbial abundance was measured by flow cytometry (57).
Qualitative and Quantitative PCR, RT-PCR, and Phylogenetic Analyses.
DNA samples were collected by large-volume in situ filtration onto cellulose acetate membrane filters (0.2-μm pore size), and RNA samples were collected by filtering 5–10 liters of seawater onto Sterivex filters (0.22-μm pore size; Millipore). Nucleic acids extraction, qualitative and real-time PCR and RT-PCR, and subsequent phylogenetic analyses followed established protocols (see SI Materials and Methods). Sequences retrieved in this study have been deposited in the GenBank under accession numbers EF414229–EF414283.
Reaction-Diffusion Modeling.
Assuming steady state, fluxes of NH4+ and NOx− were calculated with a reaction-diffusion model solving the equation
where z is depth, C is NH4+ or NOx−concentration, R is production or consumption, and D is diffusivity. Rearranging the equation:
Because the concentration gradients (∂C/∂z) can be computed by means of curve fitting for the concentration profiles and D can be reconstructed from in situ density (58), then ∂D/∂z and ∂2C/∂z2 can be calculated by using finite-differences formulae and subsequently R.
Supplementary Material
Acknowledgments
We thank Karsten Lettmann for model development; Daniela Franzke, Gabriele Klockgether, and Dagmar Wöbken for sampling and analytical assistance; Marc Strous and Mike Jetten (Radboud University Nijmegen, Nijmegen, The Netherlands), and Eva Spieck (University of Hamburg, Hamburg, Germany) for providing bacterial cultures; the captain and crew on the R/V Professor Vodyanitskiy for technical support; and two anonymous reviewers for constructive comments. P.L. was supported by the Deutsche Forschungsgemeinschaft (DFG) and Max-Planck-Gesellschaft (MPG); G.L., M.M.M.K., and R.A. were supported by the MPG; M.M.J. and B.T. were supported by the Danish National Research Foundation; and D.F.M., B.M., and C.J.S. were supported by the Eidgenössische Anstalt für Wasserversorgung, Abwasserreinigung und Gewässerschutz (EAWAG), and Eidgenössiche Technische Hochschule (ETH).
Abbreviations
- AOB
ammonia-oxidizing bacteria
- βAOB
β-proteobacterial AOB
- γAOB
γ-proteobacterial AOB
- MGI
marine group I
- amoA
ammonia monooxygenase gene subunit A
- OMZ
oxygen minimum zone
- AMO
ammonia monooxygenase
- CARD
catalyzed reporter deposition
- qPCR
quantitative PCR
- OTU
operational taxonomic unit.
Footnotes
The authors declare no conflict of interest.
This article is a PNAS direct submission.
Data deposition: The sequences reported in this paper have been deposited in the GenBank database (accession nos. EF414229–EF414283).
See Commentary on page 6881.
This article contains supporting information online at www.pnas.org/cgi/content/full/0611081104/DC1.
References
- 1.Codispoti LA, Christensen JP. Mar Chem. 1985;16:277–300. [Google Scholar]
- 2.Ward BB, Zafiriou OC. Deep-Sea Res. 1988;35:1127–1142. [Google Scholar]
- 3.Lipschultz F, Wofsy SC, Ward BB, Codispoti LA, Friedrich G, Elkins JW. Deep-Sea Res. 1990;37:1513–1541. [Google Scholar]
- 4.Naqvi SWA, Noronha RJ. Deep-Sea Res. 1991;38:871–890. [Google Scholar]
- 5.Kuypers MMM, Lavik G, Woebken D, Schmid M, Fuchs BM, Amann R, Jorgensen BB, Jetten MSM. Proc Natl Acad Sci USA. 2005;102:6478–6483. doi: 10.1073/pnas.0502088102. [DOI] [PMC free article] [PubMed] [Google Scholar]
- 6.Kuypers MMM, Lavik G, Thamdrup B. In: Past and Present Marine Water Column Anoxia, NATO Science Series IV: Earth and Environmental Series. Neretin LN, editor. Vol 64. Dordrecht, The Netherlands: Springer; 2006. pp. 311–336. [Google Scholar]
- 7.Hamersley MR, Lavik G, Woebken D, Rattray JE, Lam P, Hopmans EC, Sinninghe Damsté JS, Krüger S, Graco M, Gutiérrez D, Kuypers MMM. Limnol Oceanogr. 2007 in press. [Google Scholar]
- 8.Thamdrup B, Dalsgaard T, Jensen MM, Ulloa O, Farías L, Escribano R. Limnol Oceanogr. 2006;51:2145–2156. [Google Scholar]
- 9.Gruber N, Sarmiento JL. Glob Biogeochem Cycles. 1997;11:235–266. [Google Scholar]
- 10.Codispoti LA, Brandes JA, Christensen JP, Devol AH, Naqvi SWA, Paerl HW, Yoshinari T. Sci Mar. 2001;65:85–105. [Google Scholar]
- 11.Ward BB. In: Encyclopedia of Environmental Microbiology. Bitton G, editor. New York: Wiley; 2002. pp. 2144–2167. [Google Scholar]
- 12.Sorokin YI. The Black Sea: Ecology and Oceanography. Leiden, The Netherlands: Backhuys Publishers; 2002. [Google Scholar]
- 13.Murray JW, Codispoti L, Friederich GE. In: Aquatic Chemistry: Interfacial and Interspecies Processes. Huang CP, O'Melia CR, Morgan JJ, editors. Washington, DC: Am Chem Soc; 1995. pp. 157–176. [Google Scholar]
- 14.Ward BB, Kilpatrick KA. In: Black Sea Oceanography. Iydar E, Murray JW, editors. Dordrecht, The Netherlands: Kluwer; 1991. pp. 111–124. [Google Scholar]
- 15.Kuypers MMM, Sliekers AO, Lavik G, Schmid M, Jørgensen BB, Kuenen JG, Damsté JSS, Strous M, Jetten MSM. Nature. 2003;422:608–611. doi: 10.1038/nature01472. [DOI] [PubMed] [Google Scholar]
- 16.Venter JC, Remington K, Heidelberg JF, Halpern AL, Rusch D, Eisen JA, Wu D, Paulsen I, Nelson KE, Nelson W, et al. Science. 2004;304:66–74. doi: 10.1126/science.1093857. [DOI] [PubMed] [Google Scholar]
- 17.Schleper C, Jurgens G, Jonuscheit M. Nat Rev Microbiol. 2005;3:479–488. doi: 10.1038/nrmicro1159. [DOI] [PubMed] [Google Scholar]
- 18.Hallam SJ, Mincer TJ, Schleper C, Preston CM, Roberts K, Richardson PM, DeLong EF. PLoS Biol. 2006;4:e95. doi: 10.1371/journal.pbio.0040095. [DOI] [PMC free article] [PubMed] [Google Scholar]
- 19.Könneke M, Bernhard AE, de la Torre JR, Walker CB, Waterbury JB, Stahl DA. Nature. 2005;437:543–546. doi: 10.1038/nature03911. [DOI] [PubMed] [Google Scholar]
- 20.Francis CA, Roberts KJ, Beman JM, Santoro AE, Oakley BB. Proc Natl Acad Sci USA. 2005;102:14683–14688. doi: 10.1073/pnas.0506625102. [DOI] [PMC free article] [PubMed] [Google Scholar]
- 21.Karner MB, DeLong EF, Karl DM. Nature. 2001;409:507–510. doi: 10.1038/35054051. [DOI] [PubMed] [Google Scholar]
- 22.Massana R, DeLong EF, Pedros-Alio C. Appl Environ Microbiol. 2000;66:1777–1787. doi: 10.1128/aem.66.5.1777-1787.2000. [DOI] [PMC free article] [PubMed] [Google Scholar]
- 23.Ingalls AE, Shah SR, Hansman RL, Aluwihare LI, Santos GM, Druffel ERM, Pearson A. Proc Natl Acad Sci USA. 2006;103:6442–6447. doi: 10.1073/pnas.0510157103. [DOI] [PMC free article] [PubMed] [Google Scholar]
- 24.Herndl GJ, Reinthaler T, Teira E, van Aken H, Veth C, Pernthaler A, Pernthaler J. Appl Environ Microbiol. 2005;71:2303–2309. doi: 10.1128/AEM.71.5.2303-2309.2005. [DOI] [PMC free article] [PubMed] [Google Scholar]
- 25.Wuchter C, Abbas B, Coolen MJL, Herfort L, van Bleijswijk J, Timmers P, Strous M, Teira E, Herndl GJ, Middelburg JJ, et al. Proc Natl Acad Sci USA. 2006;103:12317–12322. doi: 10.1073/pnas.0600756103. [DOI] [PMC free article] [PubMed] [Google Scholar]
- 26.Ward BB, Glover HE, Lipschultz F. Deep-Sea Res. 1989;36:1031–1051. [Google Scholar]
- 27.Ward BB. Deep-Sea Res. 1987;34:785–805. [Google Scholar]
- 28.Leininger S, Urich T, Schloter M, Schwark L, Qi J, Nicol GW, Prosser JI, Schuster SC, Schleper C. Nature. 2006;442:806–809. doi: 10.1038/nature04983. [DOI] [PubMed] [Google Scholar]
- 29.Bollmann A, Schmidt I, Saunders AM, Nicolaisen MH. Appl Environ Microbiol. 2005;71:1276–1282. doi: 10.1128/AEM.71.3.1276-1282.2005. [DOI] [PMC free article] [PubMed] [Google Scholar]
- 30.Aoi Y, Shiramasaa Y, Masakia Y, Tsunedaa S, Hirataa A, Kitayamab A, Nagamune T. J Biotechnol. 2004;111:111–120. doi: 10.1016/j.jbiotec.2004.02.017. [DOI] [PubMed] [Google Scholar]
- 31.Aoi Y, Shiramasa Y, Tsuneda S, Hirata A, Kitayama A, Nagamune T. Water Sci Technol. 2002;46:439–442. [PubMed] [Google Scholar]
- 32.Araki N, Yamaguchi T, Yamazaki S, Harada H. Water Sci Technol. 2004;50:1–8. [PubMed] [Google Scholar]
- 33.Treusch AH, Leininger S, Kletzin A, Schuster SC, Klenk H-P, Schleper C. Env Microbiol. 2005;7:1985–1995. doi: 10.1111/j.1462-2920.2005.00906.x. [DOI] [PubMed] [Google Scholar]
- 34.Dalsgaard T, Canfield DE, Petersen J, Thamdrup B, Acuña-González J. Nature. 2003;422:606–608. doi: 10.1038/nature01526. [DOI] [PubMed] [Google Scholar]
- 35.Third KA, Sliekers AO, Kuenen JG, Jetten MSM. Syst Appl Microbiol. 2001;24:588–596. doi: 10.1078/0723-2020-00077. [DOI] [PubMed] [Google Scholar]
- 36.Third KA, Paxman J, Schmid M, Strous M, Jetten MSM, Cord-Ruwisch R. Microb Ecol. 2005;49:236–244. doi: 10.1007/s00248-004-0186-4. [DOI] [PubMed] [Google Scholar]
- 37.Oguz T, Besiktepe S. Deep-Sea Res. 1999;46:1733–1753. [Google Scholar]
- 38.Stanev EV, Staneva J, Bullister JL, Murray JW. Deep-Sea Res. 2004;51:2137–2169. [Google Scholar]
- 39.Konovalov SK, Luther GW, III, Friederich GE, Nuzzio DB, Tebo BM, Murray JW, Oguz T, Glazer BT, Trouwborst RE, Clement B, et al. Limnol Oceanogr. 2003;48:2369–2376. [Google Scholar]
- 40.Freitag TE, Prosser JI. Appl Environ Microbiol. 2003;69:1359–1371. doi: 10.1128/AEM.69.3.1359-1371.2003. [DOI] [PMC free article] [PubMed] [Google Scholar]
- 41.Mortimer RJG, Harris SJ, Krom MD, Freitag TE, Prosser JI, Barnes J, Anschutz P, Hayes PJ, Davies IM. Mar Ecol Prog Ser. 2004;276:37–51. [Google Scholar]
- 42.Bodelier P, Libochant J, Blom C, Laanbroek H. Appl Environ Microbiol. 1996;62:4100–4107. doi: 10.1128/aem.62.11.4100-4107.1996. [DOI] [PMC free article] [PubMed] [Google Scholar]
- 43.Luther GWI, Sundby B, Lewis PJ, Silverburg N. Geochim Cosmochim Acta. 1997;61:4043–4052. [Google Scholar]
- 44.Hulth S, Aller RC, Gilbert F. Geochim Cosmochim Acta. 1999;63:49–66. [Google Scholar]
- 45.Teira E, van Aken H, Veth C, Herndl GJ. Limnol Oceanogr. 2006;51:60–69. [Google Scholar]
- 46.Holmes RM, Aminot A, Kerouel R, Hooker A, Peterson BJ. Can J Fish Aqaut Sci. 1999;56:1801–1808. [Google Scholar]
- 47.Cline JD. Limnol Oceanogr. 1969;14:454–458. [Google Scholar]
- 48.Schippers A, Neretin LN, Lavik G, Leipe T, Pollehne F. Geochim Cosmochim Acta. 2005;69:2241–2252. [Google Scholar]
- 49.Pernthaler A, Pernthaler J, Amann R. Appl Environ Microbiol. 2002;68:3094–3101. doi: 10.1128/AEM.68.6.3094-3101.2002. [DOI] [PMC free article] [PubMed] [Google Scholar]
- 50.Glöckner FO, Amann R, Alreider A, Pernthaler J, Psenner R, Trebesius K, Schleifer K-H. Syst Appl Microbiol. 1996;19:403–406. [Google Scholar]
- 51.Daims H, Brühl A, Amann R, Schleifer K-H, Wagner M. Syst Appl Microbiol. 1999;22:434–444. doi: 10.1016/S0723-2020(99)80053-8. [DOI] [PubMed] [Google Scholar]
- 52.Amann R, Ludwig W, Schleifer K-H. Microbiol Rev. 1995;59:143–169. doi: 10.1128/mr.59.1.143-169.1995. [DOI] [PMC free article] [PubMed] [Google Scholar]
- 53.Juretschko S. Munich, Germany: Technische Universität; 2000. PhD thesis. [Google Scholar]
- 54.Loy A, Horn M, Wagner M. Nucleic Acids Res. 2003;31:514–516. doi: 10.1093/nar/gkg016. [DOI] [PMC free article] [PubMed] [Google Scholar]
- 55.Massana R, Murray A, Preston C, DeLong E. Appl Environ Microbiol. 1997;63:50–56. doi: 10.1128/aem.63.1.50-56.1997. [DOI] [PMC free article] [PubMed] [Google Scholar]
- 56.Teira E, Reinthaler T, Pernthaler A, Pernthaler J, Herndl GJ. Appl Environ Microbiol. 2004;70:4411–4414. doi: 10.1128/AEM.70.7.4411-4414.2004. [DOI] [PMC free article] [PubMed] [Google Scholar]
- 57.Marie D, Partensky F, Jacquet S, Vaulot D. Appl Environ Microbiol. 1997;63:186–193. doi: 10.1128/aem.63.1.186-193.1997. [DOI] [PMC free article] [PubMed] [Google Scholar]
- 58.Fennel K, Boss E. Limnol Oceanogr. 2003;48:1521–1534. [Google Scholar]
- 59.Norton J, Alzerreca J, Suwa Y, Klotz M. Arch Microbiol. 2002;177:139–149. doi: 10.1007/s00203-001-0369-z. [DOI] [PubMed] [Google Scholar]
Associated Data
This section collects any data citations, data availability statements, or supplementary materials included in this article.