

Abstract
Two new high-resolution cocrystal structures of EcoRV endonuclease bound to DNA show that a large variation in DNA-bending angles is sampled in the ground state binary complex. Together with previous structures, these data reveal a contiguous series of protein conformational states delineating a specific trajectory for the induced-fit pathway. Rotation of the DNA-binding domains, together with movements of two symmetry-related helices binding in the minor groove, causes base unstacking at a key base-pair step and propagates structural changes that assemble the active sites. These structures suggest a complex mechanism for DNA bending that depends on forces generated by interacting protein segments, and on selective neutralization of phosphate charges along the inner face of the bent double helix.
DNA bending has received much attention as a striking example of a conformational change occurring on formation of sequence-specific protein–DNA complexes. As is the case for rearrangements in the protein, bending of DNA has a strong influence on the affinity of the interaction and imposes an energetic cost relative to unbent DNA (1, 2). DNA bending is important to histone-mediated condensation and transcriptional initiation (3, 4), so that an understanding of the underlying forces generating the bend is of considerable biological significance. Asymmetric neutralization of phosphates by positively charged groups on proteins is known to be important in some cases (5, 6). By this mechanism, the DNA itself plays an active role in the process of bending. However, mechanical forces generated by protein binding, such as insertion of hydrophobic residues to unstack adjacent base pairs (7), may also be partially or wholly responsible.
The EcoRV endonuclease–DNA complex provides an excellent model for the investigation of protein-induced DNA bending. This homodimeric type II restriction endonuclease cleaves duplex DNA in a blunt-ended fashion at the center TA step of its GATATC target site, bending the DNA directly at this locus by approximately 50° into the major groove (as measured by the roll angle) (8, 9). The DNA remains largely in the canonical B-form on either side of the scissile phosphates. Comparison of the crystal structures of the unliganded and DNA-bound enzyme shows substantial quaternary structure rearrangements on binding, primarily involving rotation of the two DNA-binding/catalytic domains by 25° with respect to each other. Further, a different 12° rotation between these domains exists between two structures bound to cognate DNA in different lattices (10, 11). Thus, considerable sampling of the enzyme quaternary structure occurs in the ground state enzyme–DNA complex.
Although x-ray crystallographic studies such as these can provide unparalleled high-resolution views of macromolecules and macromolecular complexes, their use as a tool to study conformational flexibility and dynamics, such as are involved in protein-induced DNA bending, has been limited. However, additional views of quaternary states not visualized in a single lattice environment, but nonetheless significantly populated in the ensemble of solution structures, can be observed by extending the analysis to multiple lattices (12, 13). Here we have used this approach to sample the collection of ground state conformations in the 65,000 Mr EcoRV endonuclease–DNA complex. In particular, we sought to distinguish whether different DNA-bending angles are present in the ensemble of ground-state structures and to establish a relationship between bending and enzyme conformations that might help elucidate details of the induced-fit pathway. To accomplish these objectives, the structure of the complex was determined at high resolution in two additional crystal lattices. The new structures reveal a 50% variation in the magnitude of the DNA-bending angle together with correlated protein structure changes, providing direct insight into the induced fit mechanism by which the conformations of both macromolecules are altered en route to formation of a productive specific complex.
Materials and Methods
Purification and Crystallization.
Wild-type EcoRV was prepared as described (11). The oligonucleotides were synthesized for cocrystallization by standard methods and purified on a Rainin PureDNA HPLC column (Rainin Instruments) developed in a gradient of triethyl amine acetate/acetonitrile. Detritylation was performed on the column (14). The DNA was lyophilized and stored at −20°C until ready for use, when it was brought to a concentration of 10 mg/ml in 50 mM Tris (pH 7.5)/1 mM EDTA. EcoRV in 10 mM Hepes, pH 7.5/250 mM NaCl/1 mM EDTA/0.1 mM DTT, and the DNA oligonucleotides were mixed to give a final concentration of 10 mg/ml EcoRV and 1.5-fold molar excess of DNA. Crystals were grown by vapor diffusion. One microliter of the protein–DNA solution was mixed with 1 μl crystallization solution and placed over a well containing the crystallization solution. The crystallization conditions are given in Table 1.
Table 1.
Crystal forms and crystallization conditions for EcoRV-DNA complexes
| Form | Space group | DNA | Cell dimensions | Crystallization conditions | pH |
|---|---|---|---|---|---|
| Nonspecific* | P21 | CGAGCTCG | a = 68.4 Å; b = 79.6 Å; c = 66.4 Å; β = 104.6° | 0.02 M Mes 0.1 M NaCl 1.0–1.5% PEG 4,000 | 6.0 |
| I. Cognate* | C2221 | GGGATATCCC | a = 60.2 Å; b = 78.4 Å; c = 371.3 Å | 0.01 M sodium phosphate 0.08 M NaCl 2.5–3.5% PEG 4,000 | 7.0 |
| II. Cognate | C2221 | GAAGATATCTTC | a = 72.6 Å; b = 120.4 Å; c = 182.7 Å | 1.5 M ammonium sulfate | 5.0 |
| III. Cognate† | P1 | AAAGATATCTT | a = 49.2 Å; b = 50.4 Å; c = 64.1 Å; α = 96.4°; β = 108.9°; γ = 108.5° | 0.1 M Hepes 0.15 M NaCl 10% PEG 4,000 | 7.5 |
| IV. Cognate | P41212 | AAGATATCTTA | a = b = 66.1 Å; c = 299.3 Å | 0.1 M acetate 0.2 M Na, K tartrate 10% PEG 4,000 | 4.5 |
PEG, polyethylene glycol.
From ref. 9. For the nonspecific complex, the hexameric site is 5′-TCGCGA, arising from two abutted 8-mer DNA duplexes. The central phosphates at the GC step are thus missing in this complex. Both form I and the nonspecific complex are determined at 3.0-Å resolution.
X-Ray Structure Determinations and Coordinate Analysis.
Diffraction data were collected at room temperature from crystals mounted directly from the mother liquor into capillaries (form IV) by using a Rigaku (Tokyo) rotating copper anode source or at −160°C from a loop-mounted crystal (form II) soaked in cryoprotectant [1.5 M ammonium sulfate (pH 5.0); 30% glycerol] at SSRL BL1–5. Form IV data were processed and scaled with the hkl suite of programs (15); form II data were processed with mosflm and ccp4 (16). Each of the structures was determined by using molecular replacement techniques. Rotation and translation function calculations were performed with a starting model derived from crystal form III (10) by using xplor (17). xplor was also used for positional, individual B-factor and simulated annealing refinements. Model building used the programs chain (18) and lore (19). Stereochemical parameters for the DNA were those recently described (20). DNA helical parameters were calculated with the program curves (21) by using all base pairs of each complex but excluding any nucleotides overhanging the duplex. The “mini” option was used to find the best curvilinear helical axis. Minor groove widths were measured between the C3′ atom of the first thymine of the recognition site GATATC and the C3′ atom of the cytosine on the complementary strand. Nucleotides at structurally equivalent positions were used for the nonspecific complex. Solvent accessible surface area was calculated by the method of Lee and Richards (22) as implemented in xplor (17). Difference distance plots were calculated by using the program ddmp (Center for Structural Biology, Yale University, New Haven, CT). Correlation coefficients were calculated with the program find_corr (N.C.H.).
Results and Discussion
Structures of two crystal forms of the unliganded EcoRV dimer (9, 11), two crystal forms of the cognate DNA complex [forms I and III; Tables 1 and 3 (10, 11)], and a complex with nonspecific DNA (NS) (9) have been determined previously. We now present high-resolution structures of EcoRV bound to specific DNA in two new crystal forms (forms II and IV; Tables 1–3). Analysis of the cognate complex as visualized in the four different lattices I-IV shows that the magnitude of the DNA-bending angle varies by nearly 50% (Fig. 1; Table 3). Both the extent of the variation and the trend in bending angles are consistent among separate calculations of the overall DNA bend, the bend directly at the center TA step, and the roll angle at the center TA step. Thus, significantly populated ground state conformations of similar energies are compatible with different magnitudes of DNA bending.
Table 3.
DNA structural parameters
| Form | Bend* at center step, ° | Bend overall†, ° | Roll at center step global (local) | Bend* at adjacent steps, ° | Minor groove width at center step, Å | Surface area buried between Q-loop/B-helix and DNA‡, Å2 |
|---|---|---|---|---|---|---|
| I | 35 | 60 | 45.3° (49.9°) | 15, 7 | 11.92 | 1,551 |
| II | 35 | 57 | 53.3° (47.7°) | 9, 10 | 10.57 | 1,402 |
| III | 31 | 46 | 46.7° (51.1°) | 8, 12 | 10.70 | 1,335 |
| IV | 24 | 42 | 33.7° (34.5°) | 7, 8 | 10.70 | 1,241 |
| Nonspecific | 6 | 23 | 12.0° (5.7°) | 13, 15 | 10.77 | – |
Bend is defined as the angle between helical axes on either side of the base pairs (21). The center step is TA for the specific site GATATC and GC for the nonspecific site TCGCGA. To establish the significance of the differences among the angles 24° to 35°, bend angles were calculated for four protein–DNA complexes solved in lattices which contain two independent copies of a complete complex in the asymmetric unit. The structures used are three zinc-finger complexes (34–36) and a leucine zipper protein bound to DNA (37). A total of 74 base-pair steps in these four complexes were analyzed for differences in bend angles between the two asymmetric units of each structure. The mean difference is 0.02° with a standard deviation of 1.5°. It thus appears that the overall 11° variation in bend angle at the center TA step in the EcoRV structures is significant. There is no correlation of bending angle with the solution conditions (ionic strength, precipitating agent, or pH) used for crystallization (Table 1).
†Bend overall of the helical axis as calculated by curves (21) using a best-fit curvilinear axis.
‡Buried surface area is calculated as the sum over both enzyme subunits.
Figure 1.

Ribbon diagram of EcoRV (crystal form III) bound to cognate DNA. The α-helices composed of residues 37–58 from each subunit are shown as red cylinders. The DNA helical axes of the cognate forms (I, dark blue; II, green; III, pink; IV, red) and of the nonspecific complex (light blue) were calculated after superposition of all main chain atoms of each form onto form III. The major-groove recognition loops (R-loops, black) and minor-groove binding Q-loops (purple) are designated R and Q, respectively. The dimer interface and the two DNA-binding/catalytic domains are indicated as DIM, DBD-I, and DBD-II, respectively.
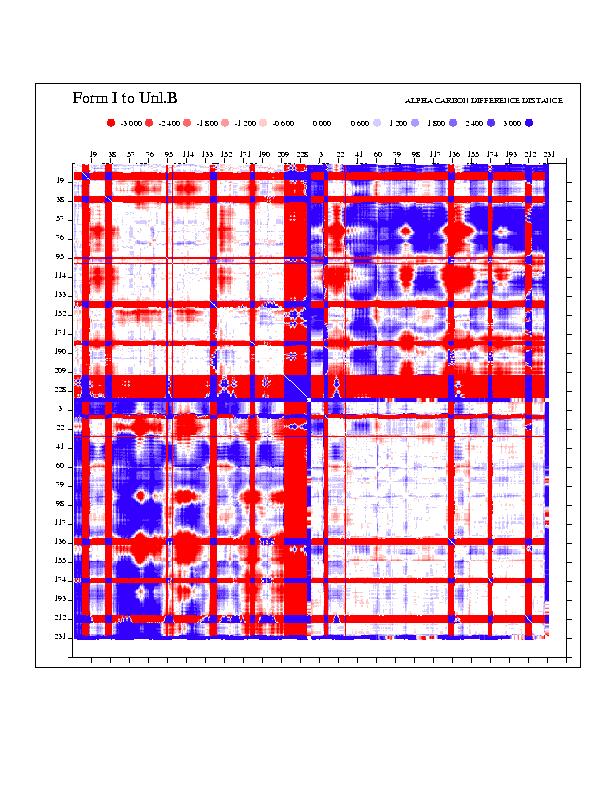
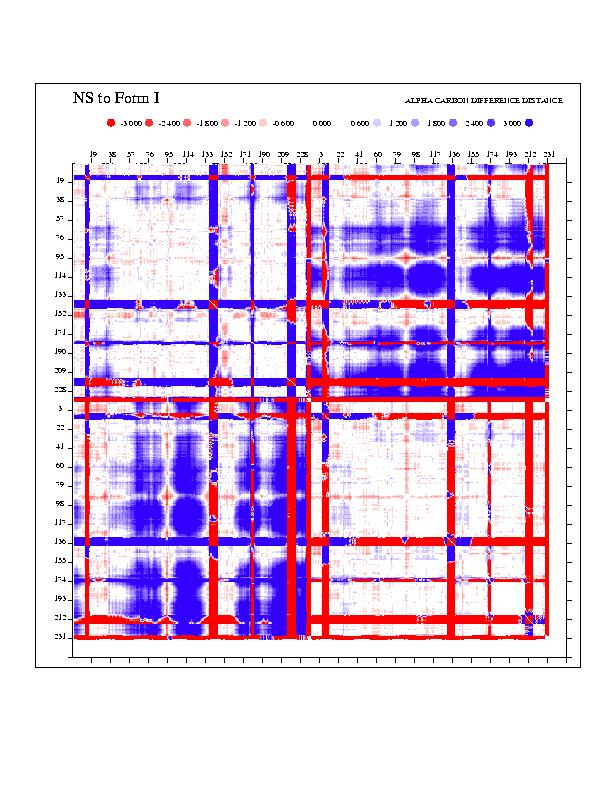
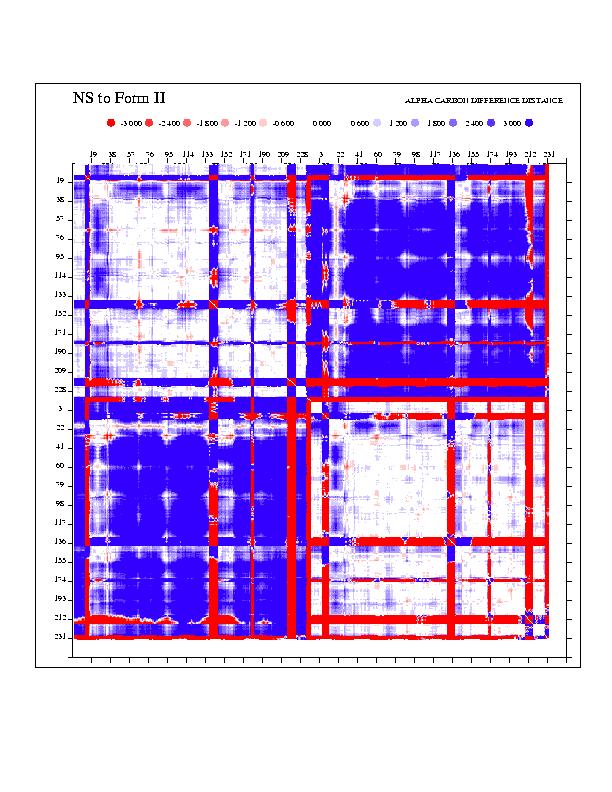
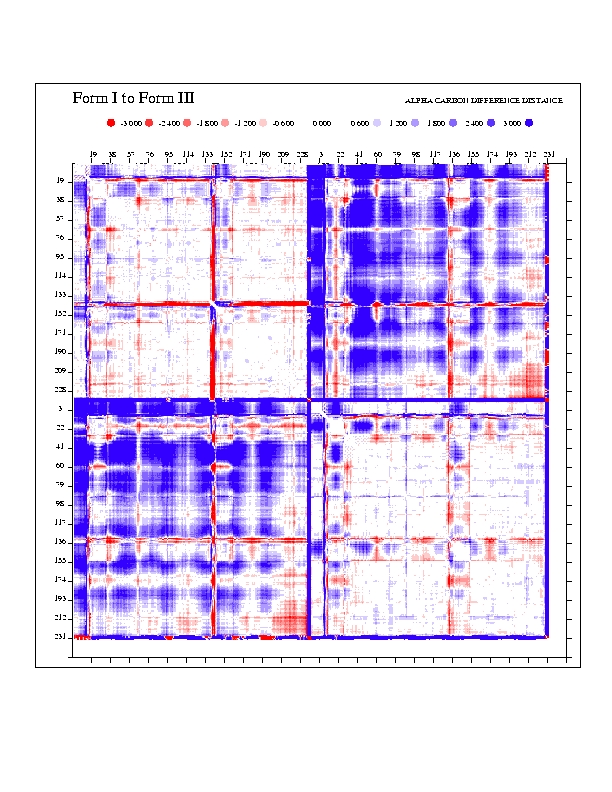
To elucidate the mechanisms by which EcoRV induces DNA bending, differences in conformation among the two unliganded structures, the four specific complexes, and the nonspecific complex were analyzed with difference-distance matrices (a set of 12 matrices is available as supplementary material; see www.pnas.org). This provides an assessment of regions that are identical between pairs of structures, thus revealing subdomains forming rigid units and polypeptide segments functioning as flexible linkers or hinges. The analysis shows that the largest movements always occur between the two monomers of each dimer, although significant changes are also present between the DNA-binding/catalytic domain (DBD) and the dimerization interface within each monomer (Fig. 1). The R-loops and Q-loops binding in the major and minor grooves also move as separate elements. The rotational difference between the two DBD domains in the unliganded vs. the specific DNA-bound forms is approximately 25°, with 10–12° differences among the structures within each set. The NS complex resembles the specific DNA complex more closely than it does the unliganded form, but the two monomers are farther apart. These results confirm and extend previous analyses of EcoRV by difference-distance matrices (11).
Although differences between the form I structure (Table 1) and forms II, III, and IV appear clearly in the difference-distance matrix plots, detailed structural changes among the four specific complexes (which might be correlated with different DNA-bending magnitudes) are not revealed by this analysis. Therefore, a standard linear correlation coefficient, r, was used to assess the correlation between (i) the distance between a pair of α-carbons (i, j) of a structure k (xi), and (ii) the DNA bend angle in structure k (yi). Linear plots for all pairs of α-carbons were made based on the coordinates of five structures: the four specific complexes I–IV and the NS. A matrix representation of r as a function of α-carbon pairs (i, j) was then constructed (Fig. 2A), in which high values of r represent interatomic distances that vary linearly with DNA-bending angle. Interatomic distances having the highest correlations occur between the two subunits, and with a cutoff of |r| > 0.9 appear as patches comprising five segments: (i) residues 37–58 (the B helix); (ii) residues 58–94 (the Q loop and two β-strands of the DNA-binding domain); (iii) residues 100–126 (a β-strand, short helix, and loop of the DNA-binding domain); (iv) residues 170–192 (a β-strand of the DNA-binding domain and the R-loop); (v) residues 199–237 (the carboxyl-terminal domain) (Fig. 2B). A decrease in the distance between any pair of these regions (in separate monomers) correlates with an increase in DNA bending at the center TA step (Fig. 2A). The conformational change giving rise to the correlation of segments ii–v can be described by a rotation of one DNA-binding domain relative to the other, about an axis roughly perpendicular to the dimer 2-fold (approximately parallel to the DNA axis), and a translation of the DNA-binding domain toward the DNA (Fig. 2C). However, the movements of segment i are distinct and involve step changes rather than a continuum of conformations.
Figure 2.

(A) Cross-correlation matrix plot of the distances between α-carbons i and j of each DNA-bound structure, and roll angle of the DNA at the center TA step. Shown is the upper right quadrant of the full matrix. Residues 1–245 of subunit I are on the horizontal axis, and residues 1–245 of subunit II are on the vertical axis. A gray point is placed for α-carbon atom pairs having |r| > 0.90 (i.e., the distance between these atoms is significantly correlated with roll angle for the five structures I-IV and NS). Shading of points from gray to black indicates values of |r| ranging from 0.9 to 1.0. Colored segments 1 through 5 (Upper and Left) are assigned by inspection of this plot. Residues 184–187 in segment 4 and 221–228 in segment 5 are not included in the calculation because they are disordered in the nonspecific complex; these residues appear as stripes with discrete borders. Similar plots were calculated with each of the other two measures of DNA-bending angle (Table 3) as well as with random values for the bend angle. The total number of points (i, j) having |r| > 0.90 are: using center-step bend of the DNA, 28,251; using roll angle at the center step, 34,681; using overall bend of the DNA, 10,465; using random values for bend angles, 1,893. Segments 1 through 5 appear in the three plots using experimental DNA-bending angles but not in the plot using random bend angles. Inspection of other quadrants of the matrix plot shows no significant correlations for interatomic distances within either subunit. Analysis of cross-correlation coefficients has also been used to assess correlated atomic displacements in molecular dynamics simulations of proteins (32). (B) Ribbon diagram of the specific complex in crystal form IV color coded by segments defined by the plot in A. (C) Schematic drawing of the protein conformational changes occurring with DNA bending. The white and black models represent complexes containing DNA which is bent to a lesser and greater degree, respectively. As the DNA bends, the B helices translate apart and rotate up into the DNA-binding site, and the DNA-binding domains rotate about the axes indicated.
The EcoRV-induced DNA bend is small in the NS complex, increases to 24° in the least-bent specific complex (form IV), and varies up to a maximum of 35° in both forms II and I. In the transition to form I, the minor groove widens by 1.2–1.3 Å, and the scissile phosphates are brought deeper into the active site (Table 3). Correlated movements of the two minor-groove binding B-helices occur in concert with these changes in the DNA, including a translation by one turn with respect to each other (Fig. 3A). This translation decreases the helix–helix interface area and appears only in form I. The B-helix–B-helix interfaces in forms II, III, and IV are similar to each other and to the unliganded enzyme, indicating that this step change occurs only after both DNA binding and bending. Divalent metal crystal soaking experiments have also shown that only form I retains catalytic activity in the crystalline state (refs. 9–11; unpublished data), suggesting that this conformation is close to the transition state for phosphodiester bond cleavage. Although other stable intermediates may be present in solution, the set of structures beginning with the unliganded enzyme and proceeding through crystal forms IV to I provides a model for a functionally relevant trajectory of protein conformations present along the pathway of DNA bending.
Figure 3.

(A) Superposition (based on the R-loop residues 184–187) of the least-bent form IV (red) and the most-bent form I (blue), showing interdigitation of Leu-46, Thr-42, and Val-39 at the B-helix interface. Arrows indicate the antiparallel movements of the helices during the 11° bending of the DNA in progressing from form IV to form I. Distances between Cα T42 (blue) and Cα Thr-42 (red) are 3.4 Å in subunit A and 2.2 Å in subunit B. (B) Propagation of the B-helix conformational changes to DNA bending, with structures superimposed as in A. The B-helices and DNA from crystal form I (blue) and crystal form IV (red) are shown, with coupling between the Thr-37–Thy-8 ribose contact and the B-helix translation also illustrated. Thr-37 and the ribose sugar in form I are shown in green in thicker bonds for clarity. These groups in form IV are shown in gold. (C) Plot of the center-step DNA-bending angle as a function of distance between Thr-37Cβ and Thy-8-C4′. Error bars for crystal forms II and IV reported here indicate coordinate error as calculated with the program sigmaa. The error bars for crystal forms I and III (9, 10) were estimated from the resolutions of the data sets, based on calculations from truncated penicillopepsin data, and may represent underestimates (33). The points represent the average Thr-37(Cβ)-ribose(C4′) distance for the two monomer subunits of each dimer. Roman numerals adjacent to the data points indicate the crystal form (Tables 1 and 3). (D) Propagation of the B-helix conformational change into the adjacent Q-loops. Residues in the active sites Glu-45, Glu-65, and Asp-74 are shown, as is the Thr-37–Gln-69 contact in crystal form I (blue) and crystal form IV (red). The superposition was done as in A.
The interdigitation of B-helix side chains in the NS complex resembles that of form I, but their placement relative to the DNA-binding site is more distant than observed in any specific complex. This conformation may not be relevant to cleavage events in which EcoRV directly binds specific DNA (as in reactions with short synthetic oligonucleotide duplexes). However, because EcoRV can reach its target site by scanning nonspecific DNA, it must be capable of transforming from the NS conformation to the form I conformation without dissociation. According to the structural models, this would require three changes to the B-helix interface: once on binding DNA (unliganded to NS), next at the initial stages of bending (NS to form IV), and finally to produce the catalytically active conformation (form II to form I). By contrast, a pathway invoking simultaneous binding and bending of the specific site requires only one helical interface translation.
The direct force applied to facilitate bending may arise from contacts of Thr-37, at the extreme amino termini of the B-helices, with the ribose sugar at the center thymine nucleotide of each ATC half site (Fig. 3B). As the DNA bends by 11° in proceeding through the conformational states in crystal forms IV through I, the side chain of Thr-37 rotates to generate a hydrophobic contact between Cγ and the thymine ribose ring, and these two groups move closer together. Close van der Waals contact is made at the stage in bending corresponding to crystal forms I-II (Fig. 3C). The Thr-37 movements also affect the conformations of the adjacent minor-groove binding Q-loops (residues 67–70), via an intersubunit contact between Thr-37 and Gln-69 (Fig. 3D). As the DNA bend increases, more surface area is buried between the Q-loops/B-helices and the minor groove (Table 3). The energy cost associated with DNA bending may be roughly compensated by this increased buried surface area, allowing the capture of intermediate states. Ultimately, sufficient binding energy is liberated to provide the driving force for the B-helices to translate apart into the form I conformation (Figs. 2C and 3A). The importance of the Thr-37–Gln-69 minor groove contact in facilitating these conformational changes is supported by the severe effects on catalysis observed on mutation of either residue (23, 24).
The Q-loop/B-helix rearrangements occurring in concert with bending in turn help to assemble the active sites, as important carboxylates at Glu-45 and Asp-74 alter their relative positions in the more sharply bent as compared with the less bent structures (Fig. 3D) (25). Complete assembly of the active site requires accurate juxtaposition of Asp-90/Lys-92 in the central β-sheet with Asp-74 and Glu-45, for ligation of required divalent cations that bind between these side chains and the DNA phosphates (25–27). A lattice contact on the amino-terminal helix of the enzyme, present in all crystals except the active form I, appears to prevent the B-helix movements (Fig. 3A) required for precise active-site assembly in forms II to IV.
DNA sequence specificity may be determined in part by the intrinsic high bendability of the TA step. In proceeding through the conformations observed in crystal forms IV through I, the DNA bend also increases, but by a smaller amount, at the two adjacent AT-steps of GATATC (Table 3). These adjacent steps are the sites of direct interaction with Thr-37. The TA step has on average a 50% greater roll angle than does the AT step (28) and is known from thermodynamic and theoretical studies to be the most easily unstacked of any base-pair step (29, 30). The superior bendability of TA thus may have a significant effect on the precise position at which deformation preferentially occurs in response to the Thr-37 contact. A study of base analogs at the center TA step also suggested that the differential free-energy cost of base-pair unstacking is an important mechanism by which EcoRV distinguishes the cognate DNA sequence via indirect readout (31).
This characterization of intermediate states along the EcoRV protein-induced DNA-bending pathway, accomplished by trapping these states in different lattice environments, provides perhaps the most detailed view to date of an induced-fit transition in a protein–nucleic acid complex. Although the final stage of DNA bending and active-site assembly appears to be driven by mechanical forces generated by the protein, the initiation of bending may instead depend significantly on asymmetric phosphate charge neutralization on one face of the double helix (5, 6). It is notable that the 30-aa carboxyl-terminal subdomains of EcoRV (Fig. 1), which are disordered in the unliganded enzyme (11), possess a net + 5 electrostatic charge and interact with flanking regions of the DNA on the inside of the bend. Mutation of Arg-226 in this subdomain, which removes a distal phosphate interaction, produces large decreases in catalytic rate (23). Thus, initial encounter of the specific GATATC site may be accompanied by a smaller bend, originating from flanking-sequence interactions near the major groove. This might then set the stage for application of direct mechanical force in the minor groove to increase the bend magnitude. Further work to distinguish the respective quantitative contributions of the two mechanisms in EcoRV should provide insight into the energetic requirements for assembly of higher-order protein–DNA complexes, with important implications for the packaging and expression of chromosomal DNA.
Supplementary Material
Table 2.
Crystallographic data collection and refinement statistics
| Form | Temperature of data collection | Resolution, Å | Total reflections | Unique reflections | Completeness* | Rmerge†, % | Form | Asymmetric unit | Rcryst‡, % | Rfree§, % | No. solvent | rms bond lengths, Å | rms bond angles |
|---|---|---|---|---|---|---|---|---|---|---|---|---|---|
| II | −160° | 2.16 | 50,635 | 21,638 | 82% (41%) | 4.8 | II | One dimer | 23.1 | 31.6 | 248 | 0.012 | 2.1° |
| IV | Room temperature | 2.61 | 96,208 | 18,023 | 78% (50%) | 10.3 | One DNA duplex | ||||||
| IV | One dimer | 18.1 | 30.2 | 71 | 0.011 | 1.8° | |||||||
| One DNA duplex |
*Completeness in the highest resolution shell is given in parentheses.
†Rmerge = (ΣhΣi|〈Fh〉 − Fhi|)/(ΣhFh), where 〈Fh〉 is the mean structure factor magnitude of i observations of symmetry-related reflections with Bragg index h.
‡Rcryst = (ΣhΣi||Fobs| − |Fcalc||)/(Σ|Fobs|), where Fobs and Fcalc are the observed and calculated structure factor magnitudes.
§Rfree is calculated with removal of 5% of the data as the test set, followed by simulated-annealing refinement of the final model.
Acknowledgments
We are grateful to Kevin Plaxco for critical reading of the manuscript. This work was supported by National Institutes of Health grant GM53763 and ACS-PRF grant 30427-G4 (to J.J.P.) and by American Cancer Society Postdoctoral Fellowship PF-98–015-GMC (to N.C.H.).
Footnotes
This paper was submitted directly (Track II) to the PNAS office.
Abbreviation: NS, nonspecific DNA complex.
Data deposition: The atomic coordinates have been deposited in the Protein Data Bank, www.rcsb.org (PDB ID codes 1EOO and 1EOP).
Article published online before print: Proc. Natl. Acad. Sci. USA, 10.1073/pnas.090370797.
Article and publication date are at www.pnas.org/cgi/doi/10.1073/pnas.090370797
References
- 1.Spolar R S, Record M T., Jr Science. 1994;263:777–784. doi: 10.1126/science.8303294. [DOI] [PubMed] [Google Scholar]
- 2.Horton N C, Perona J J. J Mol Biol. 1998;277:779–787. doi: 10.1006/jmbi.1998.1655. [DOI] [PubMed] [Google Scholar]
- 3.Mirzabekov A D, Rich A. Proc Natl Acad Sci USA. 1979;76:1118–1121. doi: 10.1073/pnas.76.3.1118. [DOI] [PMC free article] [PubMed] [Google Scholar]
- 4.Tjian R, Maniatis T. Cell. 1994;77:5–8. doi: 10.1016/0092-8674(94)90227-5. [DOI] [PubMed] [Google Scholar]
- 5.Stauss J K, Maher L J., III Science. 1994;266:1829–1834. doi: 10.1126/science.7997878. [DOI] [PubMed] [Google Scholar]
- 6.Paolella D N, Liu Y, Fabian M A, Schepartz A. Biochemistry. 1997;36:10033–10038. doi: 10.1021/bi970515b. [DOI] [PubMed] [Google Scholar]
- 7.Rhodes D, Schwabe J W, Chapman L, Fairall L. Philos Trans R Soc London B. 1996;351:501–509. doi: 10.1098/rstb.1996.0048. [DOI] [PubMed] [Google Scholar]
- 8.Schildkraut I, Banner C D B, Rhodes C S, Parekh S. Gene. 1984;27:327–329. doi: 10.1016/0378-1119(84)90078-7. [DOI] [PubMed] [Google Scholar]
- 9.Winkler F K, Banner D W, Oefner C, Tsernoglou D, Brown R S, Heathman S P, Bryan R K, Martin P D, Petratos K, Wilson K S. EMBO J. 1993;12:1781–1795. doi: 10.2210/pdb4rve/pdb. [DOI] [PMC free article] [PubMed] [Google Scholar]
- 10.Kostrewa D, Winkler F K. Biochemistry. 1995;34:683–696. doi: 10.1021/bi00002a036. [DOI] [PubMed] [Google Scholar]
- 11.Perona J J, Martin A M. J Mol Biol. 1997;273:207–225. doi: 10.1006/jmbi.1997.1315. [DOI] [PubMed] [Google Scholar]
- 12.Vonrhein C, Schlauderer G J, Schulz G E. Structure (London) 1995;3:483–490. doi: 10.1016/s0969-2126(01)00181-2. [DOI] [PubMed] [Google Scholar]
- 13.Zhang X J, Wozniak J A, Matthews B W. J Mol Biol. 1995;250:527–552. doi: 10.1006/jmbi.1995.0396. [DOI] [PubMed] [Google Scholar]
- 14.Aggarwal A K. Methods Companion Methods Enzymol. 1990;1:83–90. [Google Scholar]
- 15.Otwinowski Z. Proceedings of the CCP 4 Study Weekend. Daresbury, U.K.: Science and Engineering Research Council Daresbury Laboratory; 1993. pp. 56–62. [Google Scholar]
- 16.Collaborative Computational Project No. 4. Acta Crystallogr Sect D. 1994;50:760–766. [Google Scholar]
- 17.Brunger A T, Kuriyan J, Karplus M. Science. 1987;235:458–460. doi: 10.1126/science.235.4787.458. [DOI] [PubMed] [Google Scholar]
- 18.Sack J S. J Mol Graphics. 1988;6:224–225. [Google Scholar]
- 19.Finzel B C. Acta Crystallogr Sect D. 1995;51:450–457. doi: 10.1107/S0907444994013508. [DOI] [PubMed] [Google Scholar]
- 20.Parkinson G, Vojtechovsky J, Clowney L, Brunger A T, Berman H M. Acta Crystallogr D. 1996;52:57–64. doi: 10.1107/S0907444995011115. [DOI] [PubMed] [Google Scholar]
- 21.Lavery R, Sklenar H. J Biomol Struct Dyn. 1989;6:655–667. doi: 10.1080/07391102.1989.10507728. [DOI] [PubMed] [Google Scholar]
- 22.Lee B, Richards F. J Mol Biol. 1971;55:379–400. doi: 10.1016/0022-2836(71)90324-x. [DOI] [PubMed] [Google Scholar]
- 23.Wenz C, Jeltsch A, Pingoud A. J Biol Chem. 1996;271:5565–5573. doi: 10.1074/jbc.271.10.5565. [DOI] [PubMed] [Google Scholar]
- 24.Hancox E L, Halford S E. Biochemistry. 1997;36:7577–7585. doi: 10.1021/bi970156k. [DOI] [PubMed] [Google Scholar]
- 25.Selent U, Ruter T, Kohler E, Liedtke M, Thielking V, Alves J, Oelgeschager T, Wolfes H, Peters F, Pingoud A. Biochemistry. 1992;31:4808–4815. doi: 10.1021/bi00135a010. [DOI] [PubMed] [Google Scholar]
- 26.Baldwin G S, Vipond I B, Halford S E. Biochemistry. 1995;34:705–714. doi: 10.1021/bi00002a038. [DOI] [PubMed] [Google Scholar]
- 27.Horton N C, Newberry K J, Perona J J. Proc Natl Acad Sci USA. 1998;95:13489–13494. doi: 10.1073/pnas.95.23.13489. [DOI] [PMC free article] [PubMed] [Google Scholar]
- 28.Olson W K, Gorin A A, Lu X-J, Gock L M, Zhurkin V B. Proc Natl Acad Sci USA. 1998;95:11163–11168. doi: 10.1073/pnas.95.19.11163. [DOI] [PMC free article] [PubMed] [Google Scholar]
- 29.Johnson T, Zhu J, Wartell R M. Biochemistry. 1998;37:12343–12350. doi: 10.1021/bi981093o. [DOI] [PubMed] [Google Scholar]
- 30.Hunter C A, Lu X-J. J Mol Biol. 1997;265:603–619. doi: 10.1006/jmbi.1996.0755. [DOI] [PubMed] [Google Scholar]
- 31.Martin A M, Sam M D, Reich N O, Perona J J. Nat Struct Biol. 1999;6:269–277. doi: 10.1038/6707. [DOI] [PubMed] [Google Scholar]
- 32.Swaminathan S, Harte W E, Jr, Beveridge D L. J Am Chem Soc. 1991;113:2717–2721. [Google Scholar]
- 33.Brunger A T. Methods Enzymol. 1997;277:366–396. doi: 10.1016/s0076-6879(97)77021-6. [DOI] [PubMed] [Google Scholar]
- 34.Kim C A, Berg J M. Nat Struct Biol. 1996;3:940–945. doi: 10.1038/nsb1196-940. [DOI] [PubMed] [Google Scholar]
- 35.Nolte R T, Conlin R M, Harrison S C, Brown R S. Proc Natl Acad Sci USA. 1998;95:2938–2943. doi: 10.1073/pnas.95.6.2938. [DOI] [PMC free article] [PubMed] [Google Scholar]
- 36.Schwabe J W R, Chapman L, Finch J T, Rhodes D. Cell. 1993;75:567–578. doi: 10.1016/0092-8674(93)90390-c. [DOI] [PubMed] [Google Scholar]
- 37.Glover J N M, Harrison S C. Nature (London) 1995;373:257–261. doi: 10.1038/373257a0. [DOI] [PubMed] [Google Scholar]
Associated Data
This section collects any data citations, data availability statements, or supplementary materials included in this article.