

Abstract
One of the major problems in angiogenesis research remains the lack of suitable methods for quantifying the angiogenic response in vivo. We describe the development and application of the directed in vivo angiogenesis assay (DIVAA) and demonstrated that it is reproducible and quantitative. This assay consists of subcutaneous implantation of semiclosed silicone cylinders (angioreactors) into nude mice. Angioreactors are filled with only 18 μl of extracellular matrix premixed with or without angiogenic factors. Vascularization within angioreactors is quantified by the intravenous injection of fluorescein isothiocyanate (FITC)-dextran before their recovery, followed by spectrofluorimetry. Angioreactors examined by immunofluorescence show cells and invading angiogenic vessels at different developmental stages. The minimally detectable angiogenic response requires 9 days after implantation and ≥50 ng/ml (P < 0.01) of either fibroblast growth factor-2 or vascular endothelial growth factor. Characterization of this assay system demonstrates that the FITC-labeled dextran quantitation is highly reproducible and that levels of FITC-dextran are not significantly influenced by vascular permeability. DIVAA allows accurate dose-response analysis and identification of effective doses of angiogenesis-modulating factors in vivo. TNP-470 potently inhibits angiogenesis (EC50 = 88 pmol/L) induced by 500 ng/ml of fibroblast growth factor-2. This inhibition correlates with decreased endothelial cell invasion. DIVAA efficiently detects differences in anti-angiogenic potencies of thrombospondin-1 peptides (25 μmol/L) and demonstrates a partial inhibition of angiogenesis (∼40%) in a matrix metalloprotease (MMP)-2-deficient mouse compared with that in wild-type animals. Zymography of angioreactors from MMP-deficient and control animals reveals quantitative changes in MMP expression. These results support DIVAA as an assay to compare potencies of angiogenic factors or inhibitors, and for profiling molecular markers of angiogenesis in vivo.
Therapeutic targeting of angiogenesis is a novel approach to cancer therapy that has achieved proof-of-principle in animal models of tumor progression. 1-4 The recent discovery of specific molecular targets that modulate endothelial cell responses has given further impetus for the development and therapeutic application of angiogenesis-targeted therapy. 3,4 However, one of the major problems in angiogenesis research, both at the basic and applied levels, remains the development of suitable methods for assessing and quantifying the angiogenic response in vivo. 5,6
In the adult population angiogenesis is the principal mechanism leading to the formation of a functional and well-developed blood supply. 7,8 Angiogenesis refers to the formation of endothelial sprouts from existing capillary networks. Targeting blood vessel development associated with chronic diseases in the adult, such as ischemic cardiovascular disease, cancer, and arthritis, has focused on therapeutic intervention in the process of vascular sprout formation. 4,8
Several key steps in the process of endothelial sprouting have been identified. 2,8 The process begins with vasodilatation and an increase in vascular permeability, initiated by vascular endothelial growth factor (VEGF) produced in response to hypoxia. Increased vascular permeability results in extravasation of plasma proteins that become organized into a provisional matrix that, along with the subendothelial basement membrane, form a physical barrier that must be crossed by migrating endothelial cells. Changes in the adhesion of endothelial cells to the extracellular matrix, induction of protease activities and cell migration, as well as endothelial cell proliferation have also been reported. Finally, endothelial sprouts undergo lumen formation, anastomosis, and initiation of blood flow.
Investigators have developed both in vitro and in vivo assays that allow further characterization of the cellular events described above. 5,6 However, in vitro angiogenesis assays, based on endothelial cell cultures or tissue explants, focus on isolated endothelial cell functions (eg, endothelial cell proliferation, migration, or invasion) and do not examine the coordination of cell functions required for a successful angiogenic response. 5,6,9,10 In contrast, in vivo angiogenesis assays examine the entire spectrum of molecular and cellular processes, with the endpoint being formation of new, functional blood vessels. However, these in vivo angiogenesis assays are not only expensive and technically difficult to perform, but also require substantial amounts of test compound and most rely on selective morphometric analysis (eg, vessel counts, vascular morphology, and so forth) for quantitation. 5,6 Because of these limitations, current drug development strategies for identification and testing of novel angiogenic compounds and inhibitors depend principally on the use of in vitro systems. Although in vitro angiogenesis assays have been useful for identification of potential molecular targets to augment, alter, or block endothelial cell responses and preliminary screening of novel pharmacological agents, they frequently cannot be correlated with in vivo angiogenesis measurements. 9,10 This is most likely the result of the complex and multiple cellular mechanisms evoked during new blood vessel formation in vivo.
The current approaches to development of targeted therapeutic agents for angiogenesis, and further understanding of pathogenic mechanism of angioproliferative diseases lack an in vivo assay that utilizes technically simple, reproducible methodology that is easily quantified and independent of morphological parameters. 6,11 Such an in vivo assay would complement the current in vitro approach to development of novel angiogenic agents, as well as to study the temporal and spatial expression in vivo of molecular markers in pathological angiogenesis. We describe the development and application of a novel, murine in vivo angiogenesis assay that is reproducible, and quantitative that requires only microliter assay volumes. We demonstrate the utility of this assay in characterization of an induced angiogenic response to known angiogenic factors, as well as inhibition of this response by several compounds with different mechanisms of action.
Materials and Methods
Reagents
Matrigel and fibroblast growth factor (FGF)-2 were obtained from Collaborative Research (Becton Dickinson, Bedford, MA). Recombinant, murine VEGF-A was obtained from R&D Systems (Minneapolis, MN). TNP-470 was obtained from the Developmental Therapeutics Program, Frederick Cancer Research and Development Center (FCRDC), National Cancer Institute, Frederick, MD. Purified, human platelet thrombospondin-1 (TSP-1), as well as D-reverse peptides p416 and p545, derived from the central stalk region of TSP were kindly supplied by Dr. David Roberts, Laboratory of Pathology, National Cancer Institute. Adrenomedulin was obtained from Peninsula Laboratories (San Carlos, CA), fluorescein isothiocyanate (FITC)-labeled dextran was obtained from Sigma Chemical Co. (St. Louis, MO) and FITC-labeled Griffonia (Bandeiraea) simplicifolia lectin I, isolectin B4 (FITC-lectin) was obtained from Vector Laboratories (Burlingame, CA).
Directed in Vivo Angiogenesis Angioreactor
Sterile, surgical silicone tubing (0.15-cm internal diameter) was cut to standard 1-cm lengths using a Plexiglas template and single edge razor blade. These were plugged at one end with a 1/16 inch outer diameter × 4-mm solid stainless steel rod or seal with silicone, and sterilized by steam autoclave. These are referred to as “angioreactors.” Using a Hamilton syringe, sterilized angioreactors were filled at 4°C with 18 μl of Matrigel with or without angiogenic factors. These were incubated at 37°C for 1 hour to allow gel formation, before subcutaneous implantation into the dorsal flank of C57/BL6, C57/BL6 MMP-2-deficient (provided by Dr. David Muir, University of Florida, Gainesville, FL) or athymic nude mice (females, 6 to 8 weeks of age; National Cancer Institute, Frederick, MD). Before collection of the angioreactors, mice received a 100-μl injection of 25 mg/ml of FITC-dextran in phosphate-buffered saline (PBS) via tail vein. Quantification was performed by removal of the Matrigel and digestion in 200 μl of Dispase solution (Collaborative Research) for 1 hour at 37°C. After digestion, the incubation mix was cleared by centrifugation (5 minutes at 15,000 × g, room temperature in a benchtop centrifuge (Eppendorf/Brinkman. Westbury, NY) and fluorescence of the supernatant aliquots were measured in 96-well plates using an HP model spectrofluorimeter (excitation 485 nm, emission 510 nm; Perkin Elmer, Boston, MA). The mean relative fluorescence ± SD for five replicate assays were determined. Statistical analysis (nonparametric Student’s t-test; nonlinear regression, one-site competition) were performed using Prism Software Package for Macintosh (Graph Pad, San Diego, CA).
Characterization of Vascular Permeability during DIVAA
The contributions of vascular permeability to the FITC-dextran signal during quantification of angiogenic responses in the DIVAA assay were determined. The time course of FITC-dextran accumulation within the angioreactor in response to 500 ng/ml of either FGF-2 or VEGF were obtained at 9 days after implantation in angioreactors containing either FGF-2 or VEGF. Mice were injected intravenously with 100 μl of FITC-labeled dextran by tail vein. Angioreactors were then recovered at 10, 30, and 45 minutes and 1 hour after intravenous injection. FITC-dextran levels were assayed after Dispase digestion by fluorescence spectrometry as described.
Endothelial Cell Invasion Assay
FITC-labeled Griffonia lectin (FITC-lectin), an endothelial cell selective reagent, was used to quantify invading endothelial cells into the Matrigel. Briefly, after recovery of DIVAA angioreactors and digestion with Dispase as described above, cell pellets and insoluble fractions were collected by centrifugation and 5000 × g for 2 minutes at room temperature in a tabletop centrifuge. The cell pellets were resuspended in 1 ml of phosphate-buffered saline (PBS) and washed three times with PBS. After the final wash the cells were again collected by centrifugation and resuspended in 200 μl of 25 μg/ml of FITC-lectin and incubated at 4°C overnight. The stained cell pellets were again centrifuged and washed three times with cold PBS. The final pellet was resuspended in 100 μl and relative fluorescence was determined for triplicate assays as described above. Mean relative fluorescence units ± SD were determined as above.
Histological Examination
Nine days after implantation, angioreactors together with the immediate surrounding tissue were dissected and fixed in 10% neutral buffered formalin. Histological sections of paraffin–embedded assays were prepared by 10-μm sectioning and stained by conventional hematoxylin and eosin methods. Sections were also stained using Griffonia lectin (FITC-lectin). Stained sections were examined and photographed using a Zeiss Axioscope fluorescent microscope with a digital camera attachment (Spot model 1.3.0; Diagnostic Instruments, Sterling Heights, MI). The FITC-dextran signals within whole implants were examined using an inverted fluorescent microscope (Olympus IX70) and photographed as above.
Gelatinase Activity
Biochemical analysis of the gelatinase (MMP-2 and MMP-9) activity was performed by zymogram analysis. 12 Matrigel is removed from recovered implants and resuspended in 200 μl of PBS. After mechanical disruption with a pipette tip samples were centrifuged (15,000 × g for 5 minutes at room temperature, tabletop centrifuge). Aliquots of the supernatant were prepared with 2× Novex Tris-glycine sample buffer (Invitrogen, Carlsbad, CA) and applied to Novex 10% zymogram gels. Electrophoresis and zymogram analysis were performed as previously described. 12
Results
Directed in Vivo Angiogenesis Assay (DIVAA) Design
Our objective in the development of the DIVAA is to replicate the angiogenic response induced during chronic disease states. In these pathological conditions angiogenesis develops in response to an imbalance of positive and negative effectors that results in a gradient of positive angiogenic stimulus, with the direction of initial endothelial sprouting occurring along the axis of this gradient. 2 A relevant in vivo model should reproduce (or amplify) this vectorial component of the angiogenic response. Several geometric configurations (discoid, spheroid, and so forth) were tested before selecting a cylindrical shape generated by a section of silicone tubing. This configuration amplified the directional response to angiogenic stimuli. Subsequent modifications minimize the assay volume and amount of test material required. The final prototype configuration of the angioreactor utilizes a 1-cm segment of sterile silicone tubing sealed at one end containing a specified volume (18 μl) of reconstituted extracellular matrix premixed to give a final fixed concentration of angiogenic factor(s) (Figure 1) ▶ . The present report exclusively utilizes Matrigel, although alternative extracellular matrix gels (eg, fibrin or type I collagen) are also functional in this assay (data not shown). All data generated in the present report, with the exception of those obtained in the MMP-2 knockout experiments, are obtained using a single, Matrigel-containing angioreactor per mouse. Up to four assays per mouse, two on each side of the dorsal midline, can be implanted without an adverse effect on the interassay variation (data not shown).
Figure 1.

DIVAA. Angioreactor: A 0.15 cm × 1-cm long silicone rubber tubing is plugged at one end and filled with 16 μl of Matrigel with or without FGF-2 or VEGF as explained in Materials and Methods (A). Multiple angioreactors are implanted subcutaneously into the dorsal areas of athymic nude or C57/BL6 mice. Typically two assays are implanted per mouse with their open ends away from the surgical incision as depicted, but as many as four (two per dorsal flank) have been implanted per animal (B).
Kinetics of Vascularization
At various times after implantation (2 to 15 days), angioreactors were dissected and visually inspected for angiogenesis. Vascularization within the angioreactor was readily observed at day 6 after implantation. Figure 2 ▶ shows both FGF-2 and control (without exogenous angiogenic factor) assays from various time points after subcutaneous implantation in athymic nude mice. With increasing duration of implantation, the angiogenic response within the FGF-2-containing angioreactors (upper row) progressively invades deeper into the Matrigel. Measurement of the linear extent of angiogenesis within the angioreactor (Figure 2 ▶ , bottom) demonstrates that a stable difference between the FGF-2 assay and negative control is achieved at approximately day 9. Nine days after implantation, the occasional presence of an angiogenic response is observed in a few negative control assays. However, the extent of this response is usually minimal and clearly much later in the time course than the response obtained with FGF-2-positive controls. Matrigel is an extract of basement membrane proteins from the murine Englebreth-Holm-Swarm tumor. 13 There are reports of minimal angiogenic responses to Matrigel alone, because of the presence of low concentrations of endogenous growth factors, either co-purified or bound to extracellular matrix components in the Matrigel preparations. 5
Figure 2.
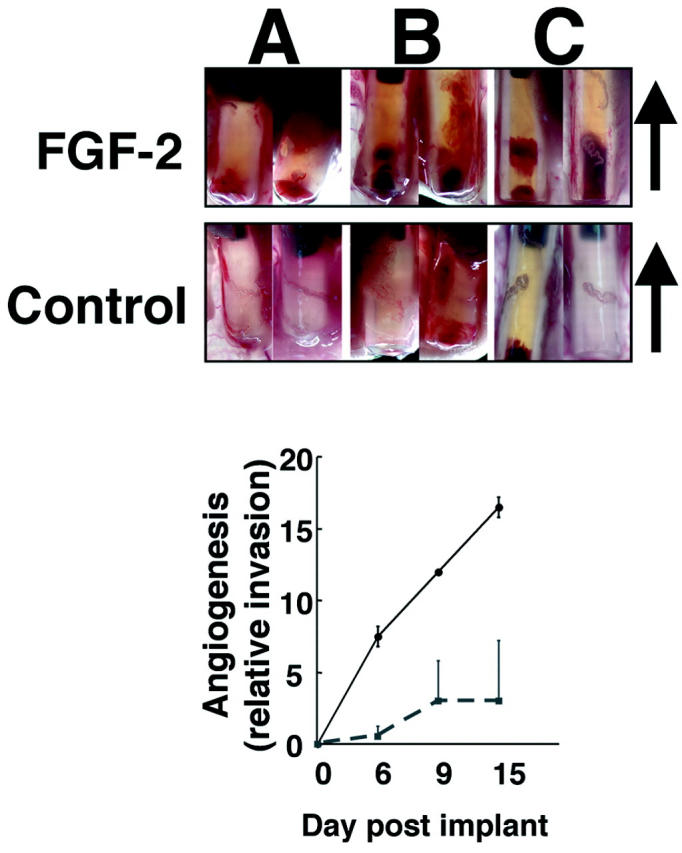
Kinetics of angiogenesis invasion into FGF-2-containing DIVAA. Angioreactors were prepared and implanted as described. On removal from the mouse, angioreactors are photographed using a Leica MZ125 microscope connected to a digital camera (Spot; Diagnostic Instruments, Sterling Heights, MI). Top: Paired angioreactors recovered at 6 (A), 9 (B), and 15 days (C) after implantation with FGF-2 or without (control) containing Matrigel. Angioreactors are oriented with open end at bottom and sealed end at top, arrow indicates direction of invasion from open end. Progression of angiogenic response is observed with increased vascular tissue within the lumen. Bottom: The relative distance of the extent of invasion of the vascular response from the open end of the assay is plotted versus the day of recovery after implantation. A mild angiogenic response is observed in two of four DIVAAs recovered at days 9 and 15 after implantation into athymic nude mice. We selected day 9 for further characterization of the assay. Original magnifications, ×10.
Histological Examination
Angioreactors recovered at 9 days reveal a mild inflammatory infiltrate (granulation tissue) in both the FGF-2 and control (without angiogenic factor) assays (Figure 3A) ▶ . However, unlike the histology of control angioreactors with no angiogenic factor, assays containing an angiogenic factor (FGF-2) reveal numerous blood vessels near the open end (compare Figure 3A ▶ ), that invade the Matrigel to form vascular structures at various stages of development. Vascular structures containing red blood cells within the FGF-2/Matrigel angioreactors are readily appreciated (Figure 3A) ▶ . In addition, the response to FGF-2-containing angioreactors also shows clear organization in the direction of the long axis, consistent with the directed nature of the response. Matrigel invasion and early organization of endothelial cell-containing structures is revealed by immunofluorescent staining with fluorescein Griffonia (Bandeiraea) simplicifolia lectin 1 staining (isolectin B4), an endothelial cell selective marker. 14,15 This staining reveals endothelial cell invasion into angioreactors containing angiogenic factor, both as individual and multicellular aggregates, with and without lumen formation (Figure 3B) ▶ .
Figure 3.
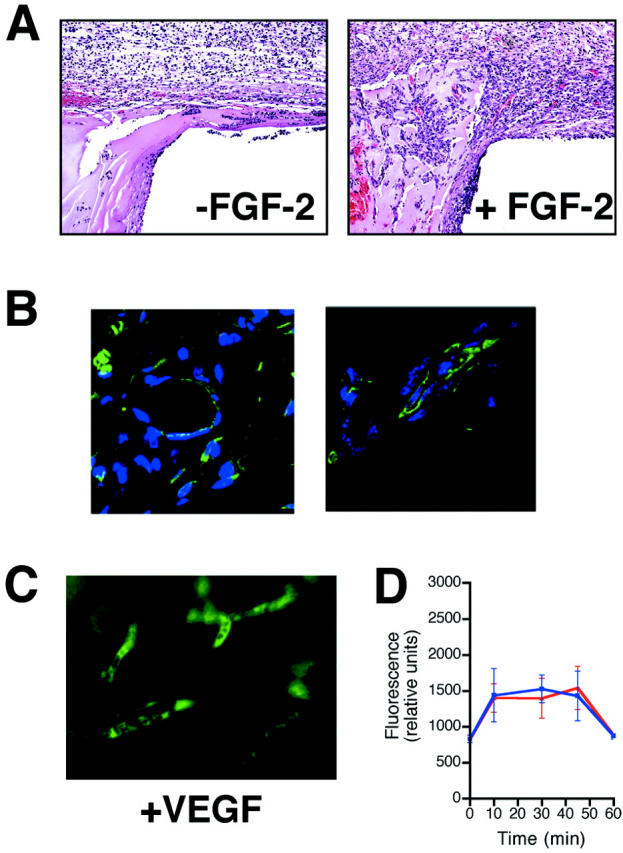
Histology and immunofluorescence microscopy of angioreactors. A: H&E-stained section from control (−FGF-2) and angiogenic factor-containing (+FGF-2) implants (day 9) showing interface at open end. Loose granulation tissue containing a modest mononuclear cell infiltrate is observed. However, there is only occasional cellular invasion of the Matrigel, with no evidence of vascular invasion. In the section from the FGF-2 (500 ng/ml) implant the granulation tissue response at the open end of the implant is enhanced and numerous vascular structures, some containing red blood cells are obvious, both within the granulation tissue as well as invading the Matrigel. Overall the invading vascular structures are oriented parallel to the long axis. B: Section from Matrigel of FGF-2-containing angioreactor stained for endothelial cells with Griffonia lectin (FITC-lectin). Cell surface of endothelial cells are positive for FITC-lectin (green signal). Sections are counterstained with DAPI for nuclear localization (blue signal). The figures show FITC-lectin-positive organizes vascular structures with lumen formation, as well as clusters and individual endothelial cells that are not yet organized into vascular structures. C: Fluorescence microscopy of FITC-dextran signal. Angioreactors containing either FGF-2 or VEGF were examined as whole mount preparations without fixation using an inverted fluorescent microscope. Representative images of angioreactor containing VEGF (500 ng/ml) (+VEGF) showing clearly demarcated vascular structures present only in the VEGF containing angioreactor, confirming the quantitation of fluorescent signal as representative of vascular volume within the angioreactor. D: Time course analysis of FITC-dextran response in FGF-2- and VEGF-induced angiogenesis. Angioreactors containing either FGF-2 or VEGF were prepared and implanted as described. At 9 days after implantation, mice were injected intravenously with FITC-labeled dextran. At indicated time points after intravenous FITC-dextran injection, angioreactors were recovered and analyzed for FITC-dextran by fluorescence spectrometry. The levels of FITC-dextran remain steady during the 10 to 45 minutes time course of this experiment. This includes the 20-minutes time point after FITC-dextran used for routine analysis in other experiments. At the 1-hour time point levels of FITC-dextran are decreased to background levels, demonstrating that no significant levels of FITC-dextran accumulate within the angioreactors. Blue, FGF-2-induced angiogenesis; Red, VEGF-induced angiogenesis. Original magnification, ×200 (C).
Quantification of Angiogenesis
Direct quantification of angiogenic response is obtained by intravenous injection of FITC-dextran (average molecular weight, 150,000 d) 20 minutes before sacrificing the mice, as explained in Materials and Methods. Quantitation of the fluorescence within angioreactors reflects the internal vascular volume and is expected to correlate with the extent of the angiogenic response provided that there is no significant leakage of the FITC-dextran. Examination of the FITC-dextran fluorescence in whole mount samples of angioreactors using either FGF-2 or VEGF as an angiogenic stimulus revealed sharply delineated vascular structures without leakage of FITC-dextran into the angioreactor’s perivascular space, Figure 3C ▶ .
To specifically examine the possible contribution of vascular permeability and/or leakage of FITC-dextran to the angiogenic responses, we determined the time course of FITC-dextran that accumulates within the angioreactor after intravenous injection. The results of this experiment are shown in Figure 3D ▶ . The data clearly demonstrate that between 10 and 45 minutes, which includes the 20-minute time point used for routine analysis, the levels of FITC-dextran within the angioreactor remain constant in response to either FGF-2- or VEGF-induced angiogenesis. However, by 60 minutes, the levels of FITC-dextran have decreased in both the FGF-2- and VEGF-induced assays to baseline levels (present in angioreactors without angiogenic factors). This observation suggests that the FITC-dextran is cleared from the functional vessels within the angioreactor and that the level of FITC-dextran leakage is undetectable over background. The results of this experiment conclusively demonstrate that the angiogenic response determined by intravenous FITC-dextran quantification is not significantly altered by changes in vascular permeability and/or the use of FITC-labeled dextran (molecular weight, 150,000). This result does not preclude the presence of vascular permeability but does demonstrate that these effects are not of sufficient magnitude to be detectable in the present assay system. These findings probably account for the highly consistent and reproducible responses observed in the DIVAA system.
Furthermore, there is a direct correlation between the extent of the angiogenic response within the implant and the amount of angiogenic factor used in the assay system. The results of dose-response experiments using both FGF-2 and VEGF are shown in Figure 4A ▶ . The results demonstrate that DIVAA requires doses higher than 50 ng/ml for both angiogenic factors. However, at a dose of 500 ng/ml of FGF-2 is slightly more potent than the equivalent concentration of VEGF in ng/ml. Although, on a molar basis VEGF would be approximately three times more potent in this assay system.
Figure 4.
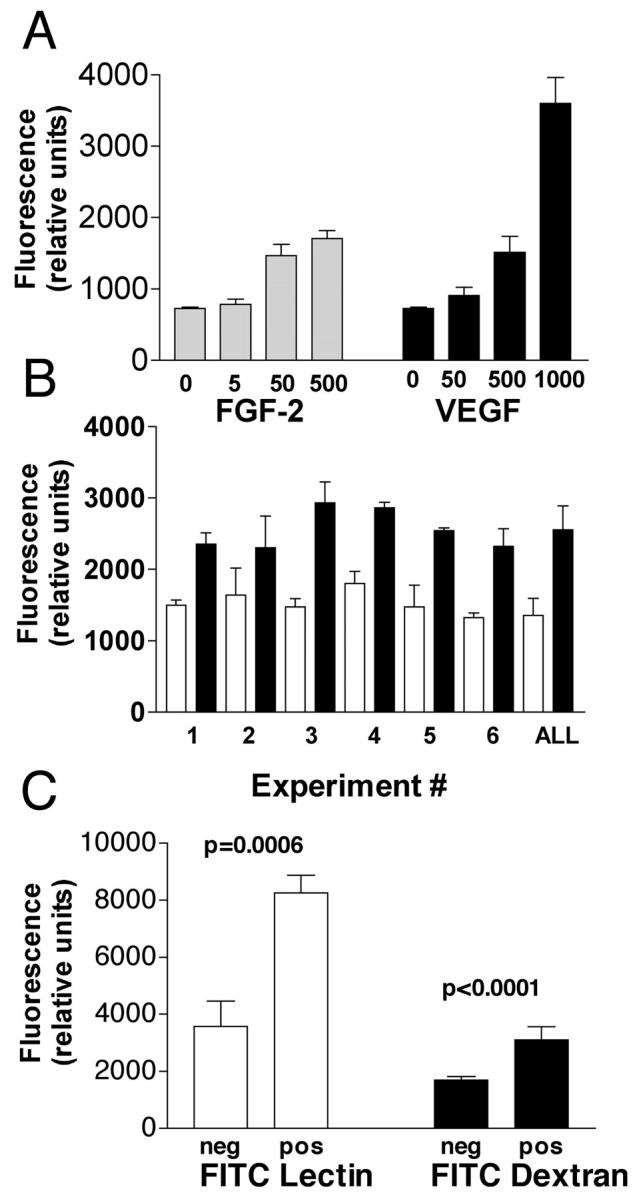
Quantification of DIVAA by FITC-dextran injection and validation of endothelial responses. Angioreactors are prepared and surgically implanted subcutaneously in nude mice as in Materials and Methods. A: Before recovery of the angioreactors each animal received a single tail-vein injection of 100 μl of 25 mg/ml FITC-dextran dissolved in phosphate-buffered saline. Twenty minutes after this injection the animals were sacrificed and the angioreactors recovered. Responses in both FGF-2 (5 to 500 ng/ml)- and VEGF (50 to 1000 ng/ml)-containing Matrigel and Matrigel without angiogenic factors at 9 day after implantation are determined by fluorescence quantitation of FITC-dextran after Dispase digestion, as explained in Materials and Methods. Results are expressed as relative fluorescence units of FITC-dextran. The results demonstrate that the level of angiogenic response is proportional to the dose of angiogenic factor in both FGF-2- and VEGF-containing angioreactors. B: Results of six independent experiments, each using five replicate determinations, comparing response to negative control (white bars) with FGF-2-induced angiogenesis (black bars). Student’s t-test comparison of results for FGF-2 and negative controls indicates statistically significant differences (P < 0.01) in five of six experiments (only experiment 2 failed). In addition pooled results from all six experiments were tested for variation around the mean and interassay variation. The two-way coefficient of variation (CV) for the pooled assays is ∼10% (95% confidence interval = 8.3 to 13%). This low CV value indicates that DIVAA is suitable for interassay comparison of results. C: Comparison of FITC-lectin (endothelial cell response) and DIVAA in control assays. Angioreactors with (pos) and without (neg) FGF-2 are prepared and implanted for 9 days as before. After recovery of angioreactors, the angiogenic response is quantified by DIVAA or for direct endothelial cell invasion using FITC-lectin staining of Dispase cell pellets, as described in Materials and Methods. Results demonstrate that the FGF-2 (positive) angioreactors contain increased numbers of FITC-lectin-stained endothelial cells and FITC-dextran signal than implants without this well-characterized angiogenic factor. Although the signal intensity is greater in the endothelial invasion assay (FITC-lectin), there are also larger SDs (error bars) and background (greater signal in negative control) associated with this assay.
DIVAA Interassay Variation
We characterize the interassay variation using FITC-dextran. Figure 4B ▶ shows FITC-dextran quantification of angiogenesis at 9 day after implantation for six independent experiments (comparing quintuplicate FGF-2 versus quintuplicate negative controls in each experiment). These data demonstrate consistently high levels of fluorescence in angioreactors containing FGF-2 as compared with the negative control assays (without FGF-2) and that the difference between the means for the FGF-2-containing and negative controls readily achieve statistical significance in five of six experiments (P < 0.01; only experiment 2 fails). In addition, the collective individual data points from all six experiments are pooled and tested in a two-way analysis of variance (variation around the mean and between assays). The low interassay variation (two-way analysis CV = 10%, 95% confidence interval = 8.3 to 13%) demonstrates that the assay described above is a useful system for comparison of relative effectiveness of different angiogenesis agents or inhibitors performed in independent experiments. We subsequently refer to this assay, using our designed angioreactors and FITC-dextran for quantitation, as the directed, in vivo angiogenesis assay, or DIVAA.
Endothelial Cell Responses in DIVAA
Intravenous injection of FITC-dextran is a measurement of blood volume within the angioreactor and is not necessarily a direct measure of endothelial cell responses. To directly demonstrate the endothelial cell responses, and correlate this with the DIVAA determinations, we use fluorescein-labeled Griffonia (Bandeiraea) simplicifolia lectin 1 (FITC-lectin) to quantify murine endothelial cell numbers within the angioreactor. 14,15 The results of the FITC-lectin determination of endothelial cell invasion are compared with results from an identical DIVAA (Figure 4C) ▶ . The assay of endothelial cell invasion using the FITC-lectin again demonstrates statistically significant differences between positive (FGF-2-containing) and negative controls with slightly higher variation (larger SD, error bars) compared with DIVAA (FITC-dextran). These data demonstrate that DIVAA, using FITC-dextran for quantitation, is representative of a true endothelial cell response, as shown by FITC-lectin staining of invasive endothelial cells, which results in new vessel formation as observed in histological sections (Figure 3) ▶ .
Accurate Determination of the TNP-470 Anti-Angiogenic Activity by DIVAA
Fumagillin, isolated from the Aspergillus fumigatus, is known to be a potent anti-angiogenic compound. 16 In 1992, TNP-470, a synthetic analogue of fumagillin, entered clinical trials as the first anti-angiogenic agent. 17,18 Basic and clinical research efforts support TNP-470 as a prototype anti-angiogenic agent. 19 The efficacy of TNP-470 to inhibit angiogenesis is examined in DIVAA and the FITC-lectin assay of endothelial cell invasion, Figure 5 ▶ . Angioreactors containing FGF-2 with or without varying concentrations of TNP-470 are prepared as described above. Results using DIVAA indicate that TNP-470 inhibits the FGF-2-induced angiogenic response with an EC50 = 88 × 10−12 mol/L. This value compares favorably with EC50 ∼600 × 10−12 mol/L in the FITC-lectin assay and the low pmol/L IC50 reported for in vitro inhibition of endothelial cell growth. 16 Comparison of the FITC-lectin measurement of endothelial cell invasion with the DIVAA (FITC-dextran) determinations demonstrates that the FITC-lectin assay is somewhat less sensitive to TNP-470 inhibition. This decreased sensitivity of the FITC-lectin assay is probably because of the requirement for a threshold number of endothelial cells to be present within the angioreactor before detection of a fluorescence signal over the background. However, these results confirm our conclusion that DIVAA represents a true angiogenic response involving an increase in the number of invading endothelial cells, and that these invasive endothelial cells are seen isolated or forming vascular structures of varying stages of development (Figure 3) ▶ .
Figure 5.

DIVAA determination of EC50 for TNP-470. Angioreactors containing FGF-2 with indicated concentrations of TNP-470 were prepared and assayed at 9 days as before. Results show a dose-response of decrease in the angiogenic response with increasing TNP-470 concentration. DIVAA determination reveals an EC50 = 88 pmol/L with a high correlation for the curve fit analysis (R2 = 0.91). Complete inhibition of the angiogenic response in this assay is observed around 10 nmol/L. These results compare favorably with those obtained using the FITC-lectin determination of endothelial cell invasion (bottom). In the FITC-lectin assay the TNP-470 EC50 = 600 pmol/L, also with a high coefficient curve fitting (R2 = 0.94), but maximal inhibition was observed at ∼100 nmol/L concentration of TNP-470.
Comparison of DIVAA with Other in Vivo Angiogenesis Assays
To demonstrate that DIVAA can be used to quantify the angiogenic response involving other mechanisms of angiogenesis inhibition, we examined the activity of peptide fragments of an endogenous angiogenesis inhibitor, as well as a genetic model involving inactivation of the matrix metalloproteinase-2 (MMP-2) expression.
TSP-1 is an extracellular matrix glycoprotein that functions to modulate cell-matrix interactions 20 and has been shown to inhibit endothelial cell function in vitro, as well as angiogenesis using both in vivo and ex vivo techniques. 20-24 The anti-angiogenic activity of TSP-1 has been assigned to specific domains within the molecule. 20,22 The anti-angiogenic effects of native soluble TSP-1 and two TSP-1 peptides (25 μmol/L final concentration) are tested using DIVAA (Figure 6A) ▶ . TSP-1 at a 0.1 μmol/L final concentrations significantly inhibits the angiogenic response to FGF-2 (∼60%) in experiments using DIVAA. Potent inhibition of FGF-2 induced angiogenesis is also observed with TSP-1 peptides p545 (∼97% inhibition) and p416 (∼78% inhibition). These results validate the anti-angiogenic effects of TSP-1 peptides reported using other in vivo angiogenesis assays and demonstrate the relative efficacy of different TSP-1 domains to inhibit FGF-2-induced angiogenesis. Moreover, previous reports using the neonatal rat retinal angiogenesis 21 and chick chorioallantoic membrane 22 assays to demonstrate the anti-angiogenic activity of TSP-1 peptides required 10-fold more peptide for these assays than DIVAA. These results suggest that anti-angiogenic agents of diverse mechanisms of action can be characterized using DIVAA. Most importantly, quantification of the angiogenic response by DIVAA is objective and does not require multiple observers (as in the retinal angiogenesis assays), the use of digital image analysis as in the chick chorioallantoic membrane assay, 21,22 or selection of areas for vessel counts. DIVAA is an observer-independent and objective assay that requires substantially less test material. All these are critical parameters for an in vivo quantitative assay of angiogenesis.
Figure 6.

DIVAA characterization of angiogenesis inhibition. To demonstrate that DIVAA is useful in a characterization of a variety of angiogenesis inhibitors experiments using endogenous angiogenesis inhibitors (TSP-1) and a genetic model (MMP-2-deficient murine model) are conducted. A: Angioreactors are prepared with FGF-2 alone (FGF-2), FGF-2 plus 0.1 μmol/L final concentration of TSP-1 (FGF+TSP-1), as well as FGF-2 plus 25 μmol/L final concentration of the following TSP-1 peptides, p 416, p545, and p641. DIVAA is performed as described. Results are corrected for negative control (Matrigel without FGF-2) and plotted as relative fluorescence units. DIVAA results demonstrate ∼60% inhibition by 0.1 μmol/L TSP-1, with the following rank order of TSP-1 peptides (25 μmol/L final concentration) for inhibition of angiogenesis: p545> p416. These results are consistent with previous reports describing the relative anti-angiogenic potency of TSP-1 peptides. Data represent the mean ± SD of five replicate determinations. B: DIVAA quantitation of angiogenesis in a murine gene-targeted model. C57/BL6 mice with targeted disruption of the matrix metalloproteinase-2 (MMP-2) gene (KO) and wt C57/BL6 (WT) mice were implanted with angioreactors containing FGF-2 or without (negative control, C) and the angiogenic responses quantitated by DIVAA. No detectable differences in the negative controls (WT versus KO) are observed. The FGF-2-induced angiogenic response in KO mice is reduced by 35% compared with responses observed in WT mice (P < 0.01), consistent with previous reports. Data represent mean ± SD of five replicate determinations. C: Comparison of MMP-2 and MMP-9 expression in angioreactors recovered from WT and KO mice by zymogram analysis. 12 Lane 1, negative control, Matrigel alone; lanes 2 and 3, angioreactors from WT mice; lanes 4 and 5, implants from KO animals; lane 6, MMP-2 and MMP-9 standards. Results show complete loss of MMP-2 (pro- and active forms) in KO mice without significant change in MMP-9 expression. Zymogram gel loading is normalized to total protein concentration.
Angiogenesis involves remodeling and invasion of the extracellular matrix. Like tumor cell invasion, matrix metalloprotease (MMP) activities, particularly MMP-2, MMP-9, and MT-1-MMP, are pivotal during angiogenesis. 25-27 We use DIVAA to quantify angiogenesis in mice with a homozygous MMP-2 gene deletion and compare this response with that of wild-type animals (Figure 6B) ▶ . FGF-2-induced vascularization is decreased in the MMP-2 knockout mice (P < 0.01) to 35% of the response observed in wild-type animals (Figure 6B) ▶ . This is in agreement with a previous study in which MMP-2-deficient animals demonstrated a 31% reduction in angiogenic response (quantitated by vessel counting) compared to wild-type animals. 27 The results of these studies confirm that MMP-2 plays at least a partial role in the angiogenesis induced by FGF-2.
The DIVAA technique also allows material contained in the assay to be recovered for additional biochemical, cellular, or genetic testing. To demonstrate this, DIVAA from both MMP-2 mutant and wild-type mice are recovered and analyzed by zymogram for MMP-2 and MMP-9 activity. As shown in Figure 6C ▶ , expression of pro- or active MMP-2 is completely absent in the knockout animals. Levels of pro- or active MMP-9 inside the angioreactor did not change in the MMP-2 knockout mice in comparison to levels present in wild-type control experiments. These findings are consistent with previous reports in which MMP-2 and MMP-9 are shown to function independently of one another during tumor-induced angiogenesis. 28 This analysis of the DIVAA demonstrates the potential for detailed molecular analysis of cellular and tissue mechanisms involved during the angiogenic response. Thus DIVAA provides an opportunity to examine, at the molecular level, multiple new targets and/or markers for anti-angiogenic therapy in cancer patients.
Discussion
Despite important breakthroughs in angiogenesis research, animal models that allow objective and quantitative assessment of the in vivo angiogenic response remains as the major limitation to the development of effective anti-angiogenic therapies. 5,6,9,11 Currently, novel angiogenesis targeted therapies lack in vivo screening models suitable for objective, quantitative preclinical testing, making it difficult to obtain dose-response analyses and estimate therapeutic doses before initiating clinical trials. 4-6 Previous in vivo assays of angiogenesis, although helpful in developing our understanding of the angiogenic process, have proven difficult to objectively quantify. 5,6,11
This report describes development of the DIVAA that meets the criteria for quantification that is essential for a useful preclinical model of angiogenesis. The geometry and semienclosed configuration of the angioreactor maintains constant and constrained matrix volume, fixed concentration of angiogenic factor(s), as well as defined local concentration of test compounds. In addition, the angioreactor’s design makes it possible to amplify the angiogenic or anti-angiogenic effects in a small test volume (<20 μl), as well as to organize and direct the growth of angiogenic vessels. All this is what differentiates DIVAA from previously described in vivo angiogenesis assays. In summary, our findings demonstrate that DIVAA: 1) recapitulates the vectorial component (directional response) that is characteristic of angiogenesis associated with chronic disease states; 2) is objectively quantifiable and highly reproducible; 3) directly correlates with increased numbers of endothelial cells within the extracellular matrix of the assay and that these invading endothelial cells form vascular structures of varying degrees of maturity (solid endothelial cell aggregates, isolated single cell invasion, and mature vascular structures with lumen formation and red blood cells); 4) is highly sensitive to effects of angiogenesis inhibitors; thus, it is useful to generate dose-response analysis in preclinical testing of angiogenesis inhibitors; and 5) can be used with angiogenesis inhibitors of diverse mechanisms of action or genetic backgrounds (MMP-2-deficient mouse) to quantitatively measure and compare angiogenic responses. The correlation between the responses observed in the DIVAA with the direct assessment of endothelial cell invasion (FITC-lectin assay) demonstrates that DIVAA quantitation represent a true endothelial cell-mediated angiogenic response. Furthermore, we demonstrate that recovery of the DIVAA angioreactors can facilitate further biochemical analysis (protease activity, and so forth) of the angiogenic response. Ongoing experiments further demonstrate that we can monitor the effectiveness of systemic administration of angiogenesis inhibitors using DIVAA as well as analysis of angioreactors by microtechniques for gene expression profiling (cDNA and protein microarrays). Progress in development of angiogenesis-targeted therapies is hampered by the lack of appropriate in vivo assays. The DIVAA provides a reproducible model that is objectively quantifiable and in which the directed response simulates the spectrum of endothelial cell responses associated with vascular sprouting. The design of this assay should prove a useful in vivo research tool for mechanistic studies of pro- and anti-angiogenic agents, and molecular profiling of angiogenesis, as well as a potential screening assay for drug development.
Acknowledgments
We thank Kimberly Proctor and Dr. Alfredo Martinez for technical assistance and preparation of the FITC-lectin stained samples, respectively; Dr. David Venzon, Biostatistics and Data Management Section, National Cancer Institute for advice and assistance with the statistical analyses; Dr. David D. Roberts, Biochemical Pathology Section, Laboratory of Pathology, Center for Cancer Research, National Cancer Institute for his generous contribution of TSP-1 and peptide reagents; and Dr. Frank Cuttitta, Cancer and Cell Biology Branch, Center for Cancer Research, National Cancer Institute, for helpful discussions.
Footnotes
Address reprint requests to Liliana Guedez, Ph.D., Laboratory of Pathology, Center for Cancer Research, National Cancer Institute, National Institutes of Health, Bldg. 10, Rm. 2A33 MSC 1500, Bethesda, MD 20892. E-mail: lquedezm@mail.nih.gov.
References
- 1.Folkman J: Tumor angiogenesis: therapeutic implications. N Engl J Med 1971, 285:1182-1186 [DOI] [PubMed] [Google Scholar]
- 2.Hanahan D, Folkman J: Patterns and emerging mechanisms of the angiogenic switch during tumorigenesis. Cell 1996, 86:353-364 [DOI] [PubMed] [Google Scholar]
- 3.Hanahan D, Weinberg RA: The hallmarks of cancer. Cell 2000, 100:57-70 [DOI] [PubMed] [Google Scholar]
- 4.Folkman J, Browder T, Palmblad J: Angiogenesis research: guidelines for translation to clinical application. Thromb Haemost 2001, 86:23-33 [PubMed] [Google Scholar]
- 5.Jain RK, Schlenger K, Hockel M, Yuan F: Quantitative angiogenesis assays: progress and problems. Nat Med 1997, 3:203-208 [DOI] [PubMed] [Google Scholar]
- 6.Auerbach R, Akhtar N, Lewis RL, Shinners BL: Angiogenesis assays: problems and pitfalls. Cancer Metast Rev 2000, 19:167-172 [DOI] [PubMed] [Google Scholar]
- 7.Risau W: Mechanisms of angiogenesis. Nature 1997, 386:671-674 [DOI] [PubMed] [Google Scholar]
- 8.Carmeliet P, Jain RK: Angiogenesis in cancer and other diseases. Nature 2000, 407:249-257 [DOI] [PubMed] [Google Scholar]
- 9.Akeson AL, Brooks SK, Thompson FY, Greenberg JM: In vitro model for developmental progression from vasculogenesis to angiogenesis with a murine endothelial precursor cell line, MFLM-4. Microvascular Res 2001, 61:75-86 [DOI] [PubMed] [Google Scholar]
- 10.Burbridge MF, West DC: Rat aorta ring. Murray JC eds. Methods in Molecular Medicine: Angiogenesis Protocols. 2001. Humana Press, Inc., Totowa
- 11.Auerbach R, Auerbach W: Assays to study angiogenesis. Voest EE D’Amore PA eds. Tumor Angiogenesis and Microcirculation. 2001:pp 91-102 Marcel Dekker, Inc., New York
- 12.Kleiner DE, Stetler-Stevenson WG: Quantitative zymography: detection of picogram quantities of gelatinases. Anal Biochem 1994, 218:325-329 [DOI] [PubMed] [Google Scholar]
- 13.Kleinman HK, McGarvey ML, Liotta LA, Gehron-Robbey P, Tryggvasson K, Martin GR: Isolation and characterization of type IV procollagen, laminin, and heparan sulfate proteoglycan from EHS sarcoma. Biochemistry 1982, 24:6188-6193 [DOI] [PubMed] [Google Scholar]
- 14.Laitinen L: Griffonia simplicifolia lectins bind specifically to endothelial cells and some epithelial cells in mouse tissues. Histochem J 1987, 19:225-234 [DOI] [PubMed] [Google Scholar]
- 15.Bastaki M, Nelli EE, Dell’Era P, Rusnati M, Molinari-Tosatti MP, Parolini S, Auerbach R, Ruco LP, Possati L, Presta M: Basic fibroblast growth factor-induced angiogenic phenotype in mouse endothelium. A study of aortic and microvascular endothelial cell lines. Arterioscler Thromb Vasc Biol 1997, 17:454-464 [DOI] [PubMed] [Google Scholar]
- 16.Zhang Y, Griffith EC, Sage J, Jacks T, Liu JO: Cell cycle inhibition by the anti-angiogenic agent TNP-470 is mediated by P53 and P21waf1/CIP-1. Proc Natl Acad Sci USA 2000, 97:6427-6432 [DOI] [PMC free article] [PubMed] [Google Scholar]
- 17.Ingber D, Fujita T, Kishimoto S, Sudo K, Kanamuro T, Brem H, Folkman J: Synthetic analogues of fumagillin that inhibit angiogenesis and suppress tumour growth. Nature 1990, 348:555-557 [DOI] [PubMed] [Google Scholar]
- 18.Kruger EA, Figg WD: TNP-470: an angiogenesis inhibitor in clinical development. Expert Opin Invest Drugs 2000, 9:1383-1396 [DOI] [PubMed] [Google Scholar]
- 19.Twardowski P, Gradishar WJ: Clinical trails of antiangiogenic agents. Curr Opin Oncol 1997, 9:584-589 [DOI] [PubMed] [Google Scholar]
- 20.Lawler J: The functions of thrombospondin-1 and 2. Curr Opin Cell Biol 2000, 12:634-640 [DOI] [PubMed] [Google Scholar]
- 21.Shafiee A, Penn JS, Krutzch HC, Inman JK, Roberts DD, Blake DA: Inhibition of retinal angiogenesis by peptides derives from thrombospondin-1. Invest Ophthalmol Vis Sci 2000, 41:2378-2388 [PubMed] [Google Scholar]
- 22.Iruela-Arispe ML, Lombardo M, Krutzsch HC, Lawler J, Roberts DD: Inhibition of angiogenesis by thrombospondin-1 is mediated by 2 independent regions within the type 1 repeats. Circulation 1999, 100:1423-1431 [DOI] [PubMed] [Google Scholar]
- 23.Bogdanov AJ, Marecos E, Cheng HC, Chandrasekaran L, Krutzsch HC, Roberts DD, Weissleder R: Treatment of experimental brain tumors with thrombospondin-1 derived peptides: an in vivo imaging study. Neoplasia 1999, 1:438-445 [DOI] [PMC free article] [PubMed] [Google Scholar]
- 24.Guo N, Krutzsch HC, Inman JK, Shannon CS, Roberts DD: Antiproliferative and antitumor activities of D-reverse peptides derived from the second type-1 repeat of thrombospondin-1. J Peptide Res 1997, 50:210-221 [DOI] [PubMed] [Google Scholar]
- 25.Jia M, Schwartz MA, Sang QA: Suppression of human microvascular endothelial cell invasion and morphogenesis with synthetic matrixin inhibitors. Maragoudakis ME eds. Angiogenesis from the Molecular to Integrative Pharmacology. 2000:pp 181-194 Kluwer Academic Plenum Publishers, New York [DOI] [PubMed]
- 26.Fang J, Shing Y, Wiederschain D, Yan L, Butterfield C, Jackson G, Harper J, Tamvakopoulos G, Moses MA: Matrix metallaproteinase-2 is required for the switch to the angiogenic phenotype in a tumor model. Proc Natl Acad Sci USA 2000, 97:3884-3889 [DOI] [PMC free article] [PubMed] [Google Scholar]
- 27.Itoh T, Tanioka M, Yoshida H, Yoshioka T, Nishimoto H, Itohara S: Reduced angiogenesis and tumor progression in gelatinase-A deficient mice. Cancer Res 1998, 58:1048-1051 [PubMed] [Google Scholar]
- 28.Bergers G, Brekken R, McMahon G, Vu TH, Itoh T, Tamaki K, Tanzawa K, Thorpe P, Itohara S, Werb Z, Hanahan D: Matrix metalloproteinase-9 triggers the angiogenic switch during carcinogenesis. Nat Cell Biol 2000, 2:737-744 [DOI] [PMC free article] [PubMed] [Google Scholar]