Abstract
The purpose of the experiments described here was to investigate global image processing using methods that require global processing while eliminating or compensating for low level abnormalities: visibility, shape perception and positional uncertainty. In order to accomplish this we used a closed figure made up of Gabor patches either in noise or on a blank field. The stimuli were circular or elliptical contours, formed by N equally spaced Gabor patches. We performed two separate experiments: In one experiment we fixed N and varied the aspect ratio using a staircase to determine the threshold aspect ratio; in the second experiment we held the aspect ratio constant (at twice the threshold aspect ratio) and varied N in order to measure the threshold number of elements required to judge the shape.
Our results confirm and extend previous studies showing that humans with naturally occurring amblyopia show deficits in contour processing. Our results show that the deficits depend strongly on spatial scale (target size and spatial frequency). The deficit in global contour processing is substantially greater in noise (where contour-linking is required) than on a blank field. The magnitude of the deficits is modest when low-level deficits (reduced visibility, increased positional uncertainty, and abnormal shape perception) are minimized, and does not seem to depend much on acuity, crowding or stereoacuity. The residual deficits reported here cannot be simply ascribed to reduced visibility or increased positional uncertainty, and we therefore conclude that these are genuine deficits in global contour segregation and integration.
Introduction
Amblyopic humans (Hess et al., 1997; 1999; Levi & Sharma, 1998; Kovacs et al., 2000; Mussap & Levi, 1999; 2000; Chadna et al., 2001) and monkeys (Kozma & Kiorpes, 2003) show difficulties in detecting contours in noise. Much debate has centered on whether these difficulties are a consequence of low-level abnormalities (e.g., reduced visibility, or positional uncertainty) and whether they are found in both strabismic and anisometropic amblyopes. Amblyopes also show abnormalities in integration of global orientation and global motion in noise (Simmers et al., 2003; 2004, 2005) and this abnormality is more severe with second-order (contrast-defined) stimuli than with first-order (luminance-defined) stimuli.
There is considerable debate about the underlying cause of the loss in noise (i.e., abnormal integration versus abnormal segregation – Mansouri et al., 2005). However, amblyopes also show abnormalities in integration of global shape (Levi & Sharma, 1998) and global orientation in the absence of noise (Popple & Levi, 2000; Norcia et al., 2005), where segregation is irrelevant.
Despite the lack of agreement on the mechanism, each of these abnormalities has been taken as evidence for abnormalities downstream of the initial losses in V1 (see Levi, 2006; Kiorpes 2006 for recent reviews). We note that these “higher level” abnormalities are often present in both eyes, indicating a binocular site. While it is clear that strabismic amblyopes show deficits in certain tasks involving perceptual grouping, it is uncertain whether the deficits are a consequence of the reduced extent of global, integrative processes (Kovacs et al., 2000), or whether they simply reflect deficits carried over from cortical units feeding into these global processes (e.g., Hess et al., 1997; Levi & Sharma, 1998). In support of the latter, Hess et al. demonstrated that poor perceptual grouping performance in strabismics can be modeled by increased positional uncertainty (i.e., uncalibrated neural jitter) of cortical units, and we (Levi and Sharma, 1998) showed that some context-dependent integration operates normally in strabismic amblyopes when their contrast sensitivity deficits are taken into account. Abnormalities in classical (local) receptive field properties of amblyopes include reduced spatial resolution and contrast sensitivity, sparse cortical sampling and possibly topographical jitter (although there has never been any anatomical or physiological demonstration to support this notion). In their studies, Hess and co-workers “scaled” the spatial frequency of their Gabor patches to the observer's grating acuity; however, they did not scale the contrast to compensate for reduced contrast sensitivity. Kovacs et al scaled neither spatial frequency nor contrast. Mussap & Levi (2000) used dots that were “scaled” in size to the observer's acuity. Popple & Levi (2000) used low spatial frequency (3 c/deg) Gabor patches that were well within the pass-band where many amblyopes show little or no loss of contrast sensitivity, but did not compensate for any loss of contrast sensitivity.
The purpose of the experiments described here was to investigate global image processing using methods that eliminate or compensate for low level abnormalities: visibility, shape perception and positional uncertainty and that require global processing (Yu and Kuai, 2006).
Methods
Stimuli
In order to investigate contour integration under conditions that control for possible low-level deficits, we used a closed figure made up of Gabor patches (Gaussian windowed sinusoidal gratings) either in noise (see Fig. 1 for an example) or on a blank field. The stimuli were circular or elliptical contours with the same geometric area, formed by N equally spaced Gabor patches. The patches were positioned on the contour with a random starting point. The contour was centered on the screen so that its elements were located at the same radius, thus minimizing positional uncertainty. The spatial frequencies of the Gabor stimuli were 6, 3, and 1.5 cpd at 1, 2, and 4 deg retinal eccentricities. Variations in spatial scale (spatial frequency/eccentricity) were achieved by varying the viewing distance. The standard deviation of the Gabor Gaussian envelope (σ) was always equal to 0.425 times the Gabor wavelength (λ), and the carrier orientation was co-circular.
Fig 1.
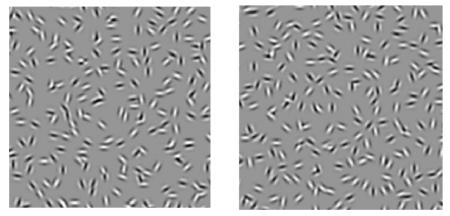
Contour discrimination stimuli
The contours were embedded in a full-screen field of noise patches - randomly distributed and oriented Gabor patches, 252 in total. The screen was divided into 18 × 14 grids. The center of each random Gabor was randomly positioned within ±0.5 grid size in both horizontal and vertical directions from the grid center. A new random noise background was generated on each trial (and in each interval). To eliminate density cues, each contour element replaced a random Gabor element in the same grid. All Gabor patches, both noise and contour elements, were physically identical except for their locations, orientations and phases. The phases of neighboring contour elements alternated at 0 and 180 deg, while the phases of the noise patches were randomized at 0 or 180 deg.
The contrast of both the noise and contour patches was always identical. For the amblyopic eyes it was 0.90; for the non-amblyopic eyes the contrast was set to be an equal multiple of the detection threshold (measured in separate experiments) to that of the amblyopic eye. This procedure equated for visibility, rather than using the same physical contrast in the two eyes (e.g., Hess et al., 1997; 1998; Kovacs et al., 2000). In control experiments we also evaluated the role of contrast.
The stimuli were generated in real time by a Matlab-based WinVis program (Neurometrics Institute, Oakland, CA) and presented on a 21-inch Sony color monitor with 120 Hz frame rate, at a mean luminance of 40 cd/m2). Luminance of the monitor was linearized by an 8-bit look-up table. Experiments were run in a dimly lit room.
Tasks
We measured contour discrimination thresholds with a temporal 2AFC staircase procedure (Yu & Kuai, 2006). In one interval the figure was a perfect circle (non-target), in the other, an ellipse (target - see Fig 1). Each interval was 200 msec, with an inter-stimulus interval was 500 msec. The observer's task was to judge which interval contained the ellipse. A central fixation cross preceded (by 100 msec) each trial, and remained on throughout the trial. Auditory feedback was given on incorrect responses. To ensure that the observer had to attend to the entire figure rather than using local cues, the axis of elongation was randomly varied. In order to minimize uncertainty (either about the shape or its locus) the radius was fixed, and we equalized visibility in the two eyes by making the patterns the same multiple of the detection threshold for each (measured in separate experiments).
We performed two separate experiments: In one experiment we fixed N (the number of contour elements) and varied the aspect ratio using a staircase to determine the threshold aspect ratio; in the second experiment we held the aspect ratio constant (at twice the threshold aspect ratio) and varied N in order to measure the threshold number of elements required to judge the shape. In both cases, we used a 3-down-1-up staircase rule, which resulted in a 79.4% convergence level (Wetherill & Levitt, 1965). The staircase, which always began well above threshold, consisted of four preliminary reversals and six experimental reversals. The mean aspect ratio (Experiment 1) or number of contour elements (Experiment 2) at 6 experimental reversals was taken as the threshold for each staircase run. In the first experiment the staircase varied the aspect ratio. The step size was 0.05 log units. In the second experiment, the staircase varied the number of the contour elements in a step size of one contour element. A typical run (one staircase) required approximately 30 trials. Each condition was repeated 4 times. In separate runs we varied the circle radius (1, 2 and 4 degrees) by varying the observer's viewing distance. This had the effect of also varying the patch size and spatial frequency. Viewing was monocular with the non-tested eye patched.
In order to minimize the effects of stimulus visibility we first measured contrast detection thresholds for our stimuli using a 2-AFC task (one interval contained a circle made up of 10 Gabor patches; the other a blank screen). The timing and other details were identical to the main experiments, and we used the same staircase to vary the contrast of the patches to estimate contrast thresholds (79.4% correct). Each condition was repeated 4 times and the thresholds reported are the geometric mean of the four separate estimates.
Observers
Seven normal and twelve amblyopic observers (5 anisometropic; 3, strabismic; and 4 with both strabismus and anisometropia) participated in our experiments. Note that in many of the figures we use color to code amblyopia type (green – anisometropic; red – strabismic; blue for both). Not all observers performed every experiment. The visual characteristics of our amblyopic observers are given in Table 1. Most were highly experienced psychophysical observers and all were given practice on our tasks prior to data collection.
Table 1.
Observer Characteristics
| Observer | Age (yrs) |
Gender | Strabismus (at 6 m) |
Eye | Refractive error |
Line letter acuity (Single letter acuity)* |
|---|---|---|---|---|---|---|
| Strabismic | ||||||
| AP | 19 | F | L EsoT 4Δ & L hyper 2 Δ |
R L |
−1.50/−0.50×180 −0.75/−0.25×5 |
20/12.5−2 20/50 (20/32+1) |
| JT | 52 | F | L EsoT 5Δ | R L |
−1.00/−0.50×10 −0.75/−0.50×90 |
20/16+2 20/63−1 (20/25−2) |
| JS | 22 | F | L EsoT 6−8Δ & hyperT 4−6 Δ |
R L |
+1.25 +1.00 |
20/16 20/40 (20/32+1) |
| Anisometropic | ||||||
| JW | 22 | F | None | R L |
+1.75 −2.00 |
20/80−2 (20/80+1) 20/20 |
| SC | 27 | M | None | R L |
+0.50 +3.25/−0.75×60 |
20/16+2 20/50+2 (20/40−2) |
| CJ | 22 | M | None | R L |
−15.00/−1.25×150 −6.00 |
20/125−4 (20/125+1) 20/16−2 |
| STC | 27 | M | None | R L |
0.25/−0.50×19 +4.25/−1.50×10 |
20/12.5−2 20/100 (20/100+2) |
| MLR | 44 | F | None | R L |
+4.0/−1.0×31 +0.75 |
20/125−2 (20/100) 20/20 |
| Strab & Aniso | ||||||
| SM | 55 | F | Alt. ExoT 18Δ | R L |
+2.75/−1.25×135 −2.00 |
20/40 (20/25+1) 20/16−2 |
| JD | 19 | M | L EsoT 3Δ | R L |
+2.50 +5.00 |
20/16 20/125 (20/125+2) |
| AW | 22 | F | R EsoT 4−6Δ & hypoT 4Δ |
R L |
+2.75/−1.0×160 −1.00/−0.50×180 |
20/80−1 (20/50−1) 20/16−1 |
| TM | 20 | M | L EsoT 6Δ & hypoT Δ |
R L |
−14.00/−1.0×70 −3.25/−0.75×120 |
20/100−2 (20/100−2) 20/16+2 |
The acuities listed in Table 1 were determined using a Bailey-Lovie chart, and we specify both the full line letter acuity and the single letter acuity.
Results
In order to minimize effects of stimulus visibility we first measured each observer's contrast detection thresholds for our stimuli (circles comprised of 10 patches without noise – see Methods). Fig. 2 summarizes the results for our amblyopic observers by plotting their contrast threshold as a function of the circle radius (lower abscissa). Note that increasing the radius decreased the Gabor carrier spatial frequency proportionally (top abscissa). At all radii, the 10 patches comprising the circle were separated by ≈ 4 wavelengths, which is within the range of distances for contrast summation along smooth contours (Bonneh & Sagi, 1998).
Fig. 2.
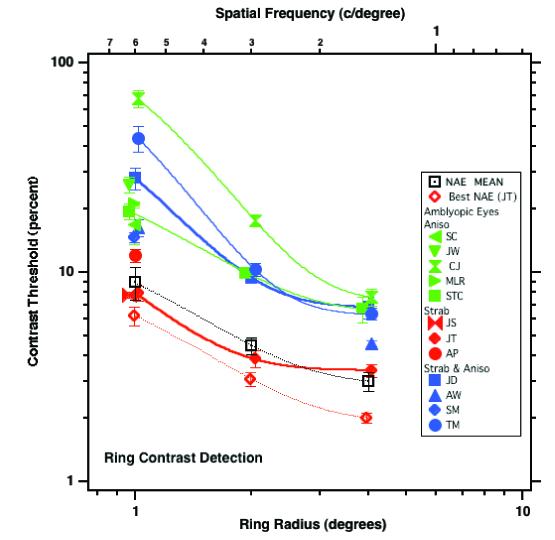
Contrast threshold for detecting a ring comprised of Gabor patches. The open square shows the mean data of the non-amblyopic eyes. Filled symbols are the amblyopic eyes. The lines are exponential functions fit to the data.
Similar to the non-amblyopic eyes (open symbols), contrast thresholds of each of the amblyopic eyes decreased with increasing radius. Almost all of the amblyopes (with the possible exception of JT – red solid diamonds) showed elevated contrast thresholds in the amblyopic eye relative to the mean of the preferred eyes (open squares); note however, that JT's amblyopic eye thresholds were higher than those of her preferred eye (red open diamonds, the preferred eye with the lowest thresholds).
In subsequent experiments, we equated for stimulus visibility by setting the stimulus contrast at 0.9 for the amblyopic eye, and at the same multiple of the observer's detection threshold for their preferred eye. Our tasks are relatively contrast independent in normal eyes (McIlhagga & Mullen, 1996) once the stimulus contrast is higher than 10-15% (about 2-3 times contrast thresholds), and we ensured that stimuli used for the amblyopic eyes were at least 3 times the target detection threshold.
Experiment 1: Shape Discrimination – Ellipse ratio thresholds
In this experiment we used a closed figure made up of N Gabor patches either in noise or on a blank field. In one interval the figure was a perfect circle, in the other, we varied the aspect ratio to make it elliptical while keeping the geometric area constant (the axis of elongation was randomly varied, so the observer had to attend to the entire figure rather than using local cues). The observer's task was to judge which interval contained the ellipse. T\In a given run, the radius was fixed to minimize uncertainty, either about the shape of the contour or its locus (see Discussion), and visibility was equalized in the two eyes (see Methods). In separate runs we varied N.
Fig 3 shows the mean ellipse ratio threshold for a normal control group (n = 4). With no noise (circles – target radius is coded by symbol size), the ellipse ratio threshold improves modestly as N, the number of target patches, increases from 3 to about 8 and saturates at a ratio of ≈ 1.05 (i.e., an aspect ratio of 1.05:1). We note that for N < 4, the task is no longer a global shape discrimination but rather becomes a distance judgment (i.e., observers have to compare the separations of the patches).
Fig. 3.
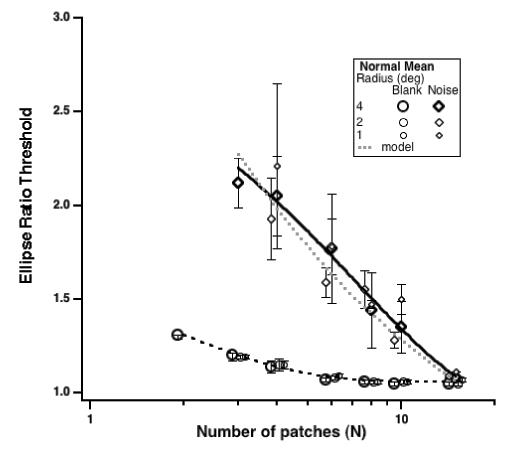
Ellipse ratio thresholds with no noise (circles) or in-noise (diamonds) as a function of the number of patches comprising the figure. The data are mean thresholds for 4 normal observers. Radius is coded by symbol size. Note that the symbols are displaced slightly along the abscissa for clarity.
In the presence of noise (randomly oriented Gabor patches – shown by the diamonds), thresholds are almost as good when N is 15; however, thresholds increase markedly as N is reduced, allowing more noise patches to intrude between the target patches. We note that in this figure and in most of the figures that follow, as N varies from 4 to 15, the separation between the patches comprising the contour decreases from more than 9 wavelengths to ≈ 2.5 wavelengths. The reduction in threshold with N follows more or less the ideal observer square root model (dotted gray line – see Levi et al., 2000). For N < 4, it is very difficult or impossible to perform the task in the presence of noise. Indeed, our normal observers were unable to do this at small radii. Under these conditions the ellipse ratio thresholds exceed two, and observers report failing to see the ellipse, and simply detecting the interval with the circle. Thus, we did not test amblyopic observers with N < 4, and we note that ratio thresholds in excess of 2 should be considered warily. Note that for normal observers, except at N <4, there is little if any effect of target radius (viewing distance).
In contrast, the results for amblyopic eyes are strongly dependent on target radius (viewing distance). Fig. 4 shows data of two observers for radii of 4, 2 and 1 deg (from top to bottom panels). Consider the data of strabismic and anisometropic amblyope JD (left column). At the two largest radii, his two eyes perform nearly identically both with no noise (circles) and with noise (diamonds), and with no noise are quite similar to the normal controls (the best fitting lines from the normal controls are shown by the thick gray lines). In noise, at radii of 4 and 2 deg, both eyes are a bit worse than the normal mean. With the 1 degree radius (bottom left) compared to his preferred eye (open symbols), JD's amblyopic eye (filled symbols) shows a modest increase in thresholds and a stronger dependence on N with no noise (circles), but a complete failure of integration in noise (diamonds) – i.e., his thresholds in noise (solid diamonds) do not improve with N.
Fig. 4.
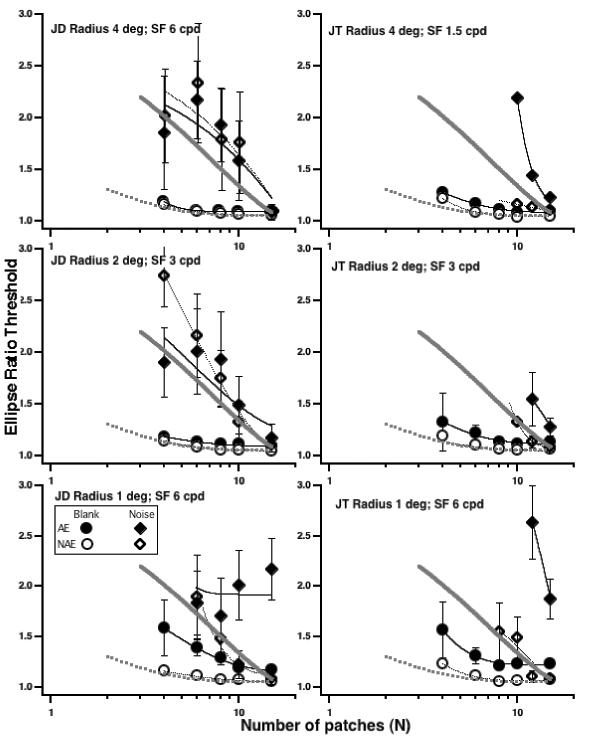
Ellipse ratio thresholds for each eye of two amblyopes as a function of N. No-noise (circles) or in-noise (diamonds). Each row is a different radius. The thick gray curves are the fits to the normal data from Fig. 3.
Strabismic observer, JT (Fig. 4 right column) also shows a strong effect of radius. The pattern of her results with no noise is similar to that of JD, showing a modest loss at the smallest radius; however, the pattern of results in noise is rather different. At all radii – JT shows severe losses in performance with her amblyopic eye as N is reduced. For radius 4 degrees, JT was unable to perform the task in noise with N < 10, for radii of 1 and 2 deg she could not perform the task with N < 12, and at 1 deg, her performance in noise was severely degraded.
Fig. 5 isolates the effect of noise by plotting the ratio of thresholds in noise to those on a blank screen (in-noise:no-noise) for the two observers in Fig 4 and for two other observers. For the normal control group (gray circles) and all but one of the amblyopic eyes (JD with a 1 deg radius) the effect of noise diminishes more or less exponentially as the number of stimulus samples increases. Clearly, contour integration is required to perform the task in noise (see Discussion). Note that the amblyopic data are widely scattered. For anisometrope SC, and for JD at the large radii, the ratios are similar to (or slightly smaller than) normal. However, for the smaller radii (e.g. JT at 1 and 2 deg) they are considerably higher. JD's non-intuitive increasing curve is a result of the saturation of his thresholds in noise.
Fig. 5.
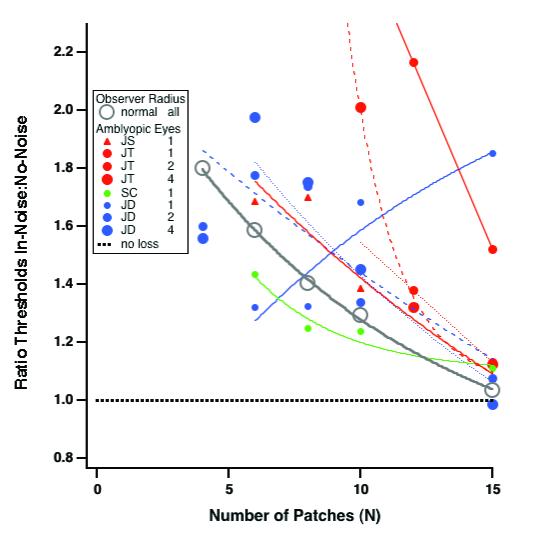
Isolating the effect of noise. This figure plots the ratio of thresholds in noise to those on a blank screen (in-noise:no-noise) for the two observers in Fig 4 and for two other observers.
We summarize these results by plotting the amblyopic eye loss (ratio of amblyopic eye thresholds to those of the normal control group) as a function of the number of elements (Fig. 6) both with no-noise (left panel) and in noise (right panel). Clearly amblyopes show losses both with and without noise. The losses with no noise tend to decrease with N while the losses in noise are generally larger and may be substantial, even when N = 15 (e.g. JD and JS at 1 degree radius). The losses in noise may be thought of as a loss of sampling efficiency.
Fig. 6.
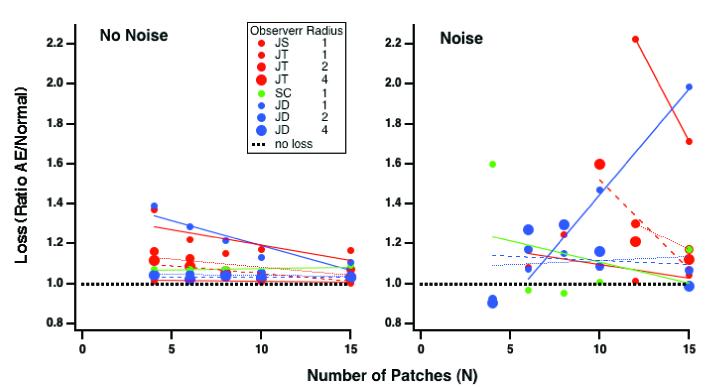
The amblyopic eye loss (ratio of amblyopic eye thresholds to those of the normal control group) as a function of the number of elements with no-noise (left panel) and in noise (right panel).
Fig. 7 summarizes ellipse ratio discrimination performance in noise with N = 15 for all of our observers. We chose N = 15 because it provided the best performance in the amblyopic eyes, and minimized the losses with no-noise. We did not use higher N, in order to avoid density cues from having the inter-element spacing smaller than the noise element spacing. Compared to the normal observers (data shown in the left panel – and the overall normal mean and 95% confidence interval is shown in each panel as the gray horizontal bar), each of the amblyopic observers shows some degree of loss (threshold elevation) at the two smallest radii (the number after the subject ID indicates the radius).
Fig. 7.
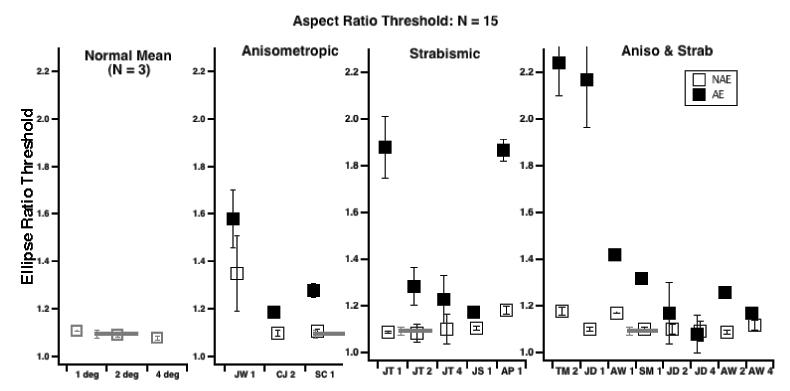
Ellipse ratio discrimination performance in noise with N = 15 for all observers. For the amblyopic observers, solid symbols are the amblyopic eye; open symbols the non-amblyopic eye. The horizontal gray bar in each panel shows the normal mean, averaged across radii and observers.
These results, showing that global shape perception in noise is degraded in the amblyopic visual system, even when the reduced visibility with the amblyopic eye is taken into account, is not surprising (Pointer & Watt, 1987; Lagreze & Sireteanu, 1991; Hess, Wang, Demanins, Wilkinson & Wilson, 1999; Levi, Klein, Sharma & Nguyen, 2000). Nor is it surprising that the deficit is most marked when the radius is small and the target is close to the fovea (Levi et al., 2000). Our real interest is in the question of whether amblyopic observers show abnormalities in the integration of local elements into a global shape. We address this in the following experiment.
Experiment 2: Shape Discrimination – Threshold number of elements
Our goal was to investigate the integration processes involved in global shape perception in amblyopes using methods that eliminate (or compensate for) low-level abnormalities (visibility, shape perception and positional uncertainty) and that require global processing. To accomplish this we had observers discriminate global shape (circle vs. ellipse) in noise. In this experiment we held the aspect ratio constant and varied N in order to measure the threshold number of elements needed to judge the shape. To minimize effects of visibility, the stimuli in the two eyes were set to equal multiples of the observer's contrast detection threshold; to compensate for the degraded shape perception of the amblyopic eye, we set the ellipse aspect ratio at twice the observer's aspect ratio threshold obtained with N = 15 patches (2 RTU – i.e., twice the aspect ratio shown in Fig. 7). In order to minimize uncertainty (either about the shape or its locus) the radius was fixed. However, we randomly varied the axis of elongation to ensure that the observer had to attend to the entire figure rather than using local cues.
Fig. 8 summarizes our results, using the same format as Fig. 7 and shows that most amblyopes (both anisometropic and strabismic) require more stimulus samples in order to perform a global shape discrimination task. Normal observers (left panel) need approximately 10 elements in order to perform the global shape discrimination; three of the four anisometropic amblyopes showed a modest increase in the threshold number of elements required, while all of the amblyopes with strabismus (right two panels) showed elevated thresholds. The single exception is strabismic and anisometropic observer AW with a 4 deg radius (note that she showed elevated thresholds at 1 and 2 deg). Several of these also showed higher thresholds in their preferred eyes when compared with the normal mean. We note that the maximum number of patches without overlap is 17. Observer TM's data clearly exceed this limit, and both JT and JD (1 degree radius) are approaching it (≈ 15.5).
Fig. 8.
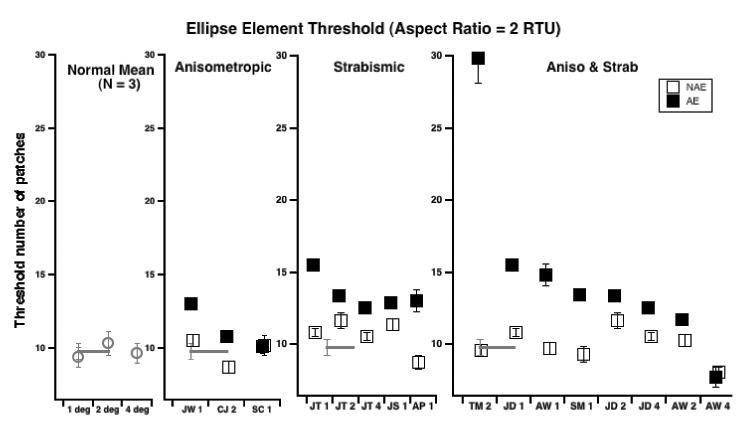
Threshold number of elements required shape discrimination (aspect ratio fixed at twice the threshold aspect ratio) for all observers. For the amblyopic observers, solid symbols are the amblyopic eye; open symbols the non-amblyopic eye. Note that the ceiling number of patches without overlap is 17. TM's data (TM 2 – right panel) clearly exceeds this suggesting that he may not have any measurable contour integration.
In order to check that our results were not a consequence of improperly compensating for the amblyopic deficit in shape perception, we measured the threshold number of elements for observer SM (radius 1 deg) for both 2 and 4 times her aspect ratio thresholds (Fig. 9). Her results show that amblyopic eye thresholds are elevated at both ratios.
Fig. 9.
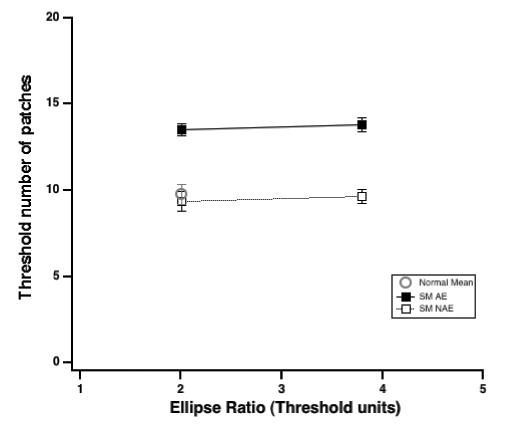
Threshold number of elements for observer SM (radius 1 deg) versus aspect ratio (in ellipse ratio thresholds units).
We also examined the role of visibility more closely by measuring both aspect ratio thresholds in noise (Fig. 10 top) and number of element thresholds in noise (Fig 10 bottom) as a function of contrast of both the contour and noise patches (plotted in contrast threshold units in Fig. 10). Our results show that in normal observers, and in the preferred eyes of amblyopes there's little effect of stimulus contrast above about 3 times threshold. Surprisingly, there is a strong effect of contrast when viewing with the amblyopic eye. Note however that, particularly for the element threshold task (bottom), the effect of contrast has largely saturated by the highest contrast for each observer, which corresponds to the 90% contrast used for the amblyopic eye in Experiments 1 and 2. Again we note that the maximum number of patches without overlap is 17 and that thresholds for SM and AP at the lowest contrast levels clearly exceed the limit.
Fig. 10.
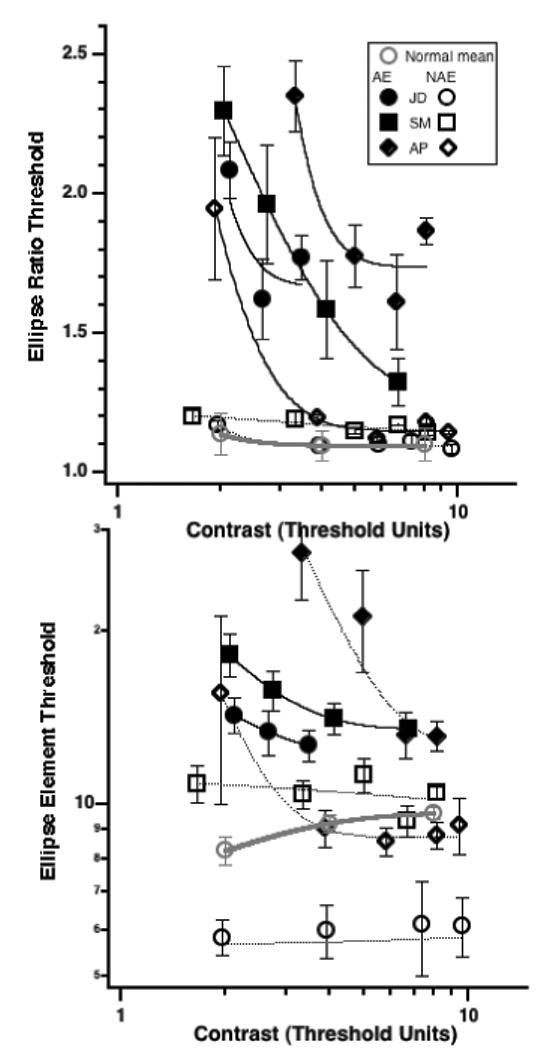
Effect of contrast on Ellipse Ratio thresholds (top) and on threshold N (bottom). Note that the ceiling number of patches without overlap is 17. Both AP and SM's thresholds exceed this at low contrast.
Discussion
Consistent with previous studies, our results show that amblyopes frequently have difficulties in global contour processing in noise (Hess et al., 1997; 1998; Kovacs et al., 2000; Mussap & Levi, 2000; Chadna et al., 2001; Kozma & Kiorpes, 2003). However, with one exception all of these previous studies have investigated the detection of contours in noise. (The exception was the study of Mussap & Levi (2000). They measured horizontal-vertical orientation discrimination in noise). For example, Hess et al. (1997, 1998) had observers detect which of two temporal intervals contained a “snake” in noise (temporal 2-AFC), while Kozma & Kiorpes (2003) had their observers detect which side of the display monitor (spatial 2-AFC) contained a circle in noise. An important question is whether detection of a contour in noise actually requires real global shape processing. For example, it has been shown that contour detection can be achieved by a local grouping operation derived directly from the edge co-occurrence statistics in natural images, in combination with a very simple integration rule that links the locally grouped contour elements into longer contours (Geisler, Perry, Super & Gallogly, 2001). Moreover, in pilot experiments, we found that with practice, observers were able to detect a closed contour (circle) with known radius, with only a small number of samples – i.e., they did not necessarily have to “see” the entire contour. In contrast, our shape discrimination task cannot be done without global form processing, because it requires that the observer determine the global shape (circular vs elliptical). Recall that the axis of elongation was randomly varied in order to ensure that the observer has to attend to the entire figure rather than using local cues.
Much of the debate has centered on whether the difficulties that amblyopes experience in processing contours in noise are a consequence of low-level abnormalities (e.g., reduced visibility, or positional uncertainty) and whether they are found in both strabismic and anisometropic amblyopes. The present study was aimed at minimizing or compensating for a number of important low-level factors: visibility, positional uncertainty and abnormalities in shape discrimination. Our results show that there are significant abnormalities in both strabismic and anisometropic amblyopes (but more markedly in those with strabismus) that cannot simply be attributed to these low level factors. These deficits in noise are not simply a consequence of poor shape discrimination, since they are much more marked in the presence of noise than on a blank field.
The present results, consistent with several other studies showing that amblyopic humans (Kovacs et al., 2000; Chadna et al., 2001) and monkeys (Kozma & Kiorpes, 2003) have deficits in processing global contours in noise in both strabismic and anisometropic amblyopia. However, while it is widely agreed that strabismic amblyopes show deficits (e.g. Hess et al., 1997) there has been some controversy about whether anisometropic amblyopes show abnormalities in detecting global form in noise. For example, Hess & Demanins (1998) found that only one of 6 anisometropic amblyopes showed abnormal contour integration (and positional uncertainty), whereas Chadna et al. (2001) found that 14 of 19 previously untreated anisometropes showed abnormalities, and all 4 of Kozma and Kiorpes (2003) anisometropic monkeys showed deficits. In the present study, as noted above, two of the three anisometropic amblyopes showed a modest increase in the threshold number of elements required (Fig 8, second panel from left), while all of the amblyopes with strabismus (Fig 8, right two panels) showed elevated thresholds.
Global contour processing deficits and other visual deficits
Are the abnormalities in global contour processing in noise linked to other deficits that characterize amblyopia: reduced visual acuity, excessive crowding or abnormal binocularity?
Fig 11 (top panel) shows how the loss in global contour integration (i.e., the ratio of the amblyopic to normal thresholds from Fig 8) relates to visual acuity for isolated letters. In this figure, a ratio of 1 indicates no loss (relative to normal observers), and it is clear that there is no direct correlation between the acuity loss and the loss of global contour processing. Two of the three anisometropic amblyopes show essentially no loss, despite the fact that CJ has the poorest acuity. It is also worth noting, that except for strabismic and anisometropic amblyope TM (who was essentially unable to perform the task), all of the other amblyopes observers show only very mild deficits in global contour integration (on average they are about ≈ 35% worse than normals) under our conditions, where low level abnormalities in visibility, shape perception and positional uncertainty have been minimized.
Fig. 11.
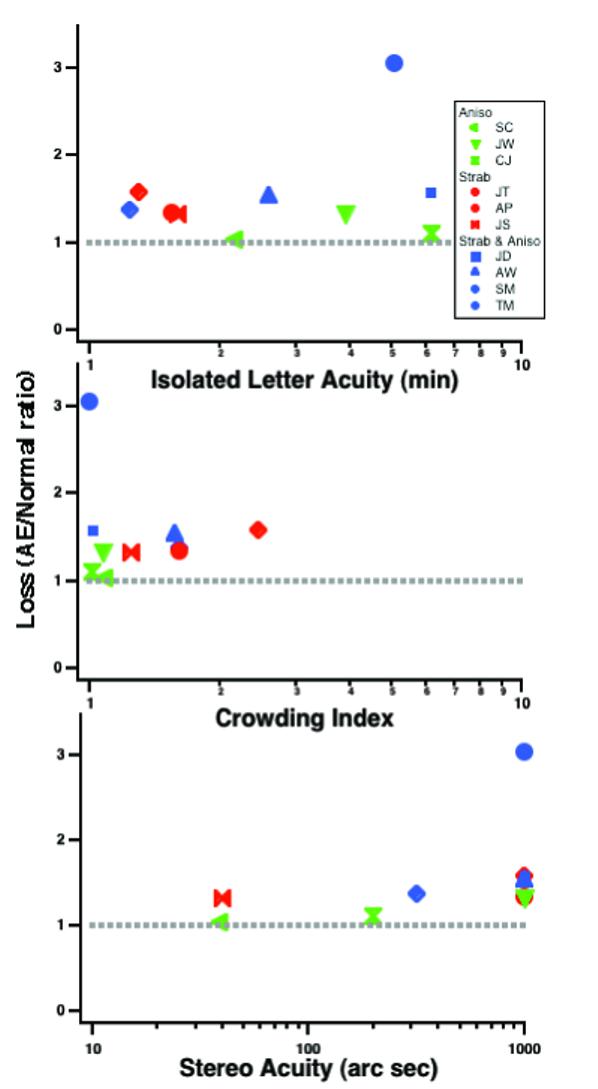
Loss of global contour integration processing (relative to normal observers) from Fig. 8 as a function of isolated visual acuity (top); crowding index (middle) and steroacuity (bottom).
Global contour integration must involve linking of local information across orientations, in order to represent the global shape (see “Neural mechanisms of contour integration” below). There has been considerable debate about whether the neural mechanisms underlying contour integration are the same as those that underlie flank facilitation for detection since both share similar dependencies on spacing, spatial frequency and orientation (e.g. Polat & Bonneh, 2000; Dakin & Hess, 1998). Moreover, amblyopes also show abnormalties in flank facilitation (e.g., Polat, Sagi & Norcia, 1997; Ellemberg, Hess & Arsenault, 2002; Levi, Hariharan & Klein, 2002; Bonneh, Sagi & Polat, 2004; Wong, Levi & McGraw, 2005; Hariharan, Levi & Klein, 2005). However, there is strong evidence that contour integration and flank facilitation are based on different neural mechanisms (Williams & Hess, 1998; Ito & Komatsu, 2004; Huang, Hess & Dakin, 2006). Although we did not investigate flank facilitation in our observers, Bonneh et al. (2004) report a close relationship between crowding and the suppressive effects of lateral masks.
Does crowding explain the deficits in global contour processing? We can derive a measure of crowding for our observers by comparing their line letter acuity to their isolated letter acuity (Table 1). Specifically we express both acuities as minimum angle of resolution (in minutes of arc) and take their ratio as a “crowding index”. For our observers this index varies from ≈ 1 (no crowding) to ≈ 2.5. Crowding likely does, at least in part, account for the effects of noise on global shape discrimination. For example, in Fig. 5 (which isolates the effect of noise on global shape discrimination), JT shows the largest effect of noise and has the largest crowding index while SC show the smallest effect of noise and the least crowding. Thus it is tempting to speculate that both the crowding and the effect of noise on global shape discrimination might be due to abnormal pooling of information at a second stage of beyond the intial filtering stage (Levi et al., 2002; Hariharan, Levi & Klein, 2005). However, after compensating for abnormities in global shape discrimination, crowding plays very little role in global contour integration (Fig 11, middle panel).
Does binocularity play a role in contour processing deficits? A large-scale study (McKee, Levi & Movshon, 2003) showed that it is the presence or absence of binocularity rather than the accompanying condition (strabismus or anisometropia) that determines the nature of the losses in amblyopia. McKee et al suggested that amblyopes lacking binocularity have abnormalities downstream of V1 that limit performance on “higher level” tasks such as detecting contours in noise. We have examined this question in two ways: first, we ask whether there is a linkage between binocularity (as indexed by stereopsis) show deficits in global form processing in noise. The lower panel of Fig 11 shows the loss in global contour integration as a function of stereoacuity (randot circles test). Note that a number of the observers failed to exhibit any stereopsis (plotted at an abscissa value of 1000). Note too that none of the observers were able to see random dot stereopsis. While it's clear that the two anisometropic amblyopes (both with measurable stereopsis) show essentially no deficit, two other amblyopes show binocularity (JS and SM) but show some residual deficit in global contour integration. Perhaps binocularity (or stereopsis) is necessary, but not sufficient to preserving global contour integration.
We examined the role of binocularity further by testing observer ER (one of the authors), who has a history of early onset strabismus (esotropia). She underwent surgery at age 2.5 years, patching and vision training. She currently has a residual small angle esotropia (with alternating suppression, a left hypertropia and DVD) and no stereopsis (she fails the RANDOT test). Despite 20/16 corrected acuity in each eye, and extensive experience with psychophysics and contour integration, she shows abnormalities in global form perception (relative to our normal control observers) both on a blank screen and in noise. Figure 12 (top panel) shows her ellipse ratio thresholds (experiment 1) for a 1-degree radius (plotted in the same format as Fig. 4). The lower panel shows the ratio of her thresholds (for each eye) relative to the normal controls for the 1-degree radius (shown above, as well as for radii of 2 and 4 degree. It is clear that both eyes perform worse than normals at all radii, and importantly, the loss in noise increases as N (the number of patches) is reduced, and is most severe when both N and the circle radius are smallest. Interestingly ER also served as an observer in a previous study on contour integration (Hall, Bauer & Kiorpes, 2004), in which her results were quite similar to the normal controls. Thus, it's instructive to ask how the present experiments differ from those. Hall et al measured detection of a similar closed figure (circle comprised of Gabor patches) in noise. Their stimulus had a radius of 3 deg and a spatial frequency of 6 c/deg. Importantly, their stimulus fixed the number of target patches at N =10 and varied the number of noise patches. Our experiment varied N and required the observer to make a global shape judgement. Inspection of Fig. 12 shows that for N =10 patches, ER's thresholds for radii of 2 and 4 degrees (straddling the Hall et al radius) were essentially equal to or better than normal. ER's most significant losses are seen with N less than 8 and with the smallest (1 degree) radius. Thus there is no contradiction between the present results and those of Hall et al.
Fig. 12.
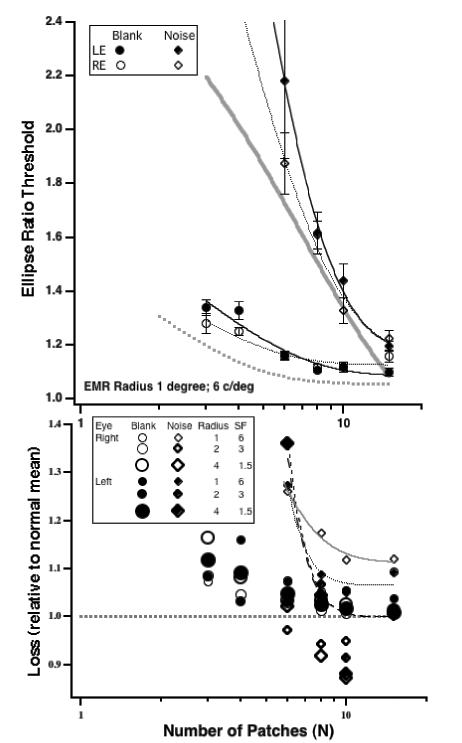
Top. Ellipse ratio thresholds as a function of N for each eye of observer ER who has a history of early onset strabismus but good acuity in each eye. No-noise (circles) or in-noise (diamonds). Circle radius was 1 deg. The thick gray curves are the fits to the normal data from Fig. 3.
Bottom: The loss (in each eye) as a function of the number of elements relative to thresholds the normal control group (open circles - on a blank screen; solid diamonds – in noise). Data for 3 radii (coded by symbol size).
Contour integration and positional uncertainty
Hess and colleagues have argued cogently for a strong role for positional uncertainty, in limiting contour integration both in strabismic amblyopia (Hess et al., 1997; 1998) and in peripheral vision (Hess and Dakin, 1997; 1999). It is important to note that two sources of positional uncertainty may limit contour integration in the amblyopic visual system: 1) local uncertainty about individual contour elements and 2) global uncertainty about the overall contour location. The Hess et al “snakes” in noise contain both high global and local positional uncertainty. The “dotted-lines” of Mussap & Levi (2000) also contained both global and local uncertainty (the absolute position of their target was jittered); however, the shape of their target (a line) was known. Kozma and Kiorpes used closed figures (circles) reducing local uncertainty, but added jitter to the precise location of the figure, thus adding some uncertainty regarding the global position. In contrast, by always placing the contours in the same locations our experiments, and those of Chadna et al. (2001) greatly reduce both global and local uncertainty. Interestingly, using similar stimuli and methods to those used here, Yu and Kuai (2006) found that contour integration in peripheral vision is not impaired. Reducing uncertainty and scaling visibility enables observers to perform as well in the periphery as in the fovea. Moreover, Yu and Kuai (2006) showed that global positional uncertainty has no effect on contour integration for well-defined stimuli in normal observers. From that perspective, our results are surprising because of the close similarity between amblyopic and peripheral vision (Levi et al., 1999; 2000). Reducing uncertainty and scaling visibility are not sufficient to normalize performance in the amblyopic visual system.
Is contour integration necessary for our task?
Given the marked differences in task positional uncertainty between the present method and that of Hess and colleagues, it is reasonable to ask whether contour integration is required to perform our task? Below we discuss several potential cues that do not require special integrative mechanisms:
Density cues: One potential cue for detecting a contour in noise is based on element density – i.e., a contour may be detected when the contour elements are closer together than the background elements (obviating the need to perform orientation linking or integration). We can rule out density cues on several bases. First, our stimuli were constructed by having each contour element replace a noise element in the same grid, in order to minimize density cues. Second, we note that contour density exceeds the noise density when N = 18 or more. All but one observer (TM) had element thresholds well below 18. Finally, our shape discrimination task contains contours in both intervals, so the overall density is identical in the two intervals, and does not provide a cue for the shape discrimination.
Local orientation cues. Since the shape and its location are known precisely, observers might use the orientation of just one or two elements to detect a contour, without linking adjacent elements at all, i.e., observers could estimate the orientation around a few likely contour-element locations by template matching, and compare across intervals. This may well be true for a contour detection task, in which the observer must select between an interval with a contour in noise versus one with noise only (indeed, pilot experiments using such a task showed that after practice, observers were able to perform with very few elements). However, it is not true for our shape discrimination task. Moreover, because we randomized the axis of elongation from triato-trial, the observer was required to attend to the entire figure.
Observers may use texture-orientation cues to perform the task. If observers know where elements are located they might rely on position insensitive texture mechanisms which average over multiple orientations and are sensitive to local orientation statistics. For example, positioning an estimator between elements would capture several orientation samples. We note that such texture mechanisms also require integration of local signals, and while these mechanisms may be sufficiently sensitive to signal the presence of a contour, it's not clear that they would have sufficient sensitivity to discriminate between a circle and an ellipse. While texture cues will indicate a stronger (lower variance) orientation cue as the ellipse becomes elongated, it is not clear how sensitive such mechanisms are to small changes in orientation variance (since the aspect ratios at threshold are quite close to one). Moreover axis or location jitter would likely degrade the discrimination signal; however, jitter has no influence on contour detection (Yu and Kuai, 2006). Finally, we note that amblyopes perform normally on texture orientation tasks (Mussap & Levi, 1999). Thus, if our task relied on texture orientation cues we would not expect to find any deficits in amblyopia.
Neural mechanisms of contour integration
The neural mechanisms of global contour integration are not yet fully understood; however it now seems clear that they involve processes in the earliest stages of visual cortex (V1) either via horizontal long-range and short-range connections (Kapadia et al., 1995; Kourtzi, Tolias, Altmann, Augath & Logothetis, 2003; Li, Piech and Gilbert, 2006) and/or via feedback (Lamme et al., 1995 – but see Bair et al., 2003) and that these mechanisms may operate at different spatial scales in different cortical areas (Kourtzi et al., 2003). Recent work by Li et al. (2006) shows a remarkable correspondence between the responses of neurons in V1 and the perceptual saliency of the contours. Importantly, they show that both the neural response and saliency grow in proportion to the number of elements defining a contour in noise (even though the added elements are well outside the classical receptive field); however, it is worth noting that their stimuli contained many of the local cues discussed above. It is also worth noting that these processes may be influenced by attention, top-down processes and by training (Li et al., 2004; 2006; Crist et al., 2001). Thus it seems premature to try to ascribe the deficits in global contour integration in amblyopes to processing deficits in early visual areas (Hess et al., 1997; 98) or downstream (e.g. Kozma & Kiorpes, 2003).
Our results show that even after compensating for the well known early deficits in visibility and positional uncertainty, humans with naturally occurring amblyopia (particularly those lacking binocular vision) show deficits in global contour integration.
Are the deficits in contour integration or in contour segregation?
A key question is whether the loss in noise is due to deficits in contour integration or in contour segregation? If the amblyopic visual system has normal or near normal form perception but cannot segregate figure from noise, performance with no noise should be more or less normal (e.g. circles in Fig. 3). However, if the observer is unable to segregate the figure from the noise, performance will be poor in noise (diamonds in Fig. 3) and will be little improved by adding target patches, i.e., if the amblyopic eye is unable to segregate figure (the co-oriented Gabor patches) from background, increasing N will not help, similar to JD's results in noise (Fig. 3 bottom left panel, solid diamonds).
Figures 5 and 6 provide some insights to this question. The left panel of Fig. 6 shows the amblyopic loss with no noise. These losses are largest when N is small, and diminish as N increases. Figure 5 and the right panel of Fig. 6 show the effects of noise. Specifically, they show that the amblyopic loss is greater in noise, and is most marked for the smaller radii when N is small. There are several possible models for abnormal integration. Moulden (1994) provided psychophysical evidence for units in the human visual system that collate information along a common orientation trajectory. These putative collator units are presumed to rely on long-range horizontal connections in the visual cortex, which may be damaged in strabismic amblyopia (Lowel & Singer, 1992; Tyschen & Burkhalter, 1995). An integration deficit due to stunted collator units (e.g. Popple & Levi, 2000) will result in performance improving with N targets, until the (stunted) collation limit and then reaching an asymptote, both with and without noise. This is by no means the only likely outcome. Our previous work (Levi & Klein, 1986; Levi, et. al., 1999) suggests that strabismic amblyopes may require more stimulus samples for acute position or shape discrimination on a blank background, because of “undersampling” (Sharma, Levi & Coletta, 1999; Levi et al., 1999; Sharma, Levi & Klein, 2000). This “integration” deficit would predict a steepening of the threshold versus N slope, similar to the data of JD's amblyopic eye with a blank background (Fig. 3 – solid circles) or JT's 1 deg data in noise (Fig. 3, bottom right – solid diamonds; also clearly seen in Figs 5 and 6 [right panel]). Finally, it is noteworthy that all but one observer (SC) requires more samples in order to discern the shape of a target in noise, even after eliminating the effects of visibility, positional uncertainty and shape perception (Fig. 8).
Our results suggest that amblyopes may show both integration and segregation deficits, even after compensating for many of the well known for low-level deficits. While such deficits have been suggested to occur beyond the initial filtering stage (Kiorpes 2006), recent work (e.g., Li et al., 2006; Kourtzi et al., 2003) make it clear that the deficits might occur as early as V1 (via lateral connections and/or feedback).
Summary
Our results confirm and extend previous studies showing that humans with naturally occurring amblyopia, like monkeys with experimental amblyopia, show deficits in contour integration. Our results show that the deficits depend strongly on spatial scale (viewing distance). Note that for all of our observers, the Gabor carrier wavelength at the longest viewing distance measured, was at least twice the cut-off wavelength. Previous studies have used either a fixed spatial scale (e.g. Kozma & Kiorpes, 2003) or a fixed multiple of the observers' cut-off (e.g., Hess et al., 1997; 98). The deficit in global contour processing is substantially greater in noise (where contour-linking is required) than on a blank field (Fig. 6). The presence or absence of a deficit does not depend on whether the observer is strabismic or not – rather (based on our limited population), may depend on the presence or absence of binocularity (McKee et al., 2003). Finally, the deficits reported here cannot be simply ascribed to reduced visibility (although there are strong contrast effects) or increased positional uncertainty, and we therefore conclude that these are genuine deficits in global contour segregation and integration.
Acknowledgements
Supported by a research grant (RO1EY01728) from the National Eye Institute, NIH, Bethesda, MD. We are grateful to Roger Li for helpful discussions and comments on an earlier version of the manuscript.
Footnotes
Publisher's Disclaimer: This is a PDF file of an unedited manuscript that has been accepted for publication. As a service to our customers we are providing this early version of the manuscript. The manuscript will undergo copyediting, typesetting, and review of the resulting proof before it is published in its final citable form. Please note that during the production process errors may be discovered which could affect the content, and all legal disclaimers that apply to the journal pertain.
References
- Bair W, Cavanaugh JR, Movshon JA. Time course and time-distance relationships for surround suppression in macaque V1 neurons. J Neurosci. 2003;20:7690–701. doi: 10.1523/JNEUROSCI.23-20-07690.2003. [DOI] [PMC free article] [PubMed] [Google Scholar]
- Bonneh Y, Sagi D. Effects of spatial configuration on contrast detection. Vision Res. 1998;38:3541–53. doi: 10.1016/s0042-6989(98)00045-5. [DOI] [PubMed] [Google Scholar]
- Bonneh Y, Sagi D, Polat U. Local and non-local deficits in amblyopia: acuity and spatial interactions. Vision Res. 2004;44:3099–110. doi: 10.1016/j.visres.2004.07.031. [DOI] [PubMed] [Google Scholar]
- Chandna A, Pennefather PM, Kovacs I, Norcia AM. Contour integration deficits in anisometropic amblyopia. Invest Ophthalmol Vis Sci. 2001;42:875–8. [PubMed] [Google Scholar]
- Crist RE, Li W, Gilbert CD. Learning to see: experience and attention in primary visual cortex. Nat Neurosci. 2001;4:519–25. doi: 10.1038/87470. [DOI] [PubMed] [Google Scholar]
- Dakin SC, Hess RF. Spatial-frequency tuning of visual contour integration. JOSA(A) 1998;15:1486–99. doi: 10.1364/josaa.15.001486. [DOI] [PubMed] [Google Scholar]
- Ellemberg D, Hess RF, Arsenault AS. Lateral interactions in amblyopia. Vision Res. 2002;42:2471–8. doi: 10.1016/s0042-6989(02)00227-4. [DOI] [PubMed] [Google Scholar]
- Geisler WS, Perry JF, Super BJ, Gallogly DP. Edge co-occurrence in natural images predicts contour grouping performance. Vision Res. 2001;41:711–24. doi: 10.1016/s0042-6989(00)00277-7. [DOI] [PubMed] [Google Scholar]
- Hall EC, Bauer EA, Kiorpes L. Contour integration in adults with a history of amblyopia. ARVO. 2005 abstract, 2005. [Google Scholar]
- Hariharan S, Levi DM, Klein SA. “Crowding” in normal and amblyopic vision assessed with Gaussian and Gabor C's. Vision Res. 2005;45:617–33. doi: 10.1016/j.visres.2004.09.035. [DOI] [PubMed] [Google Scholar]
- Hess RF, Demanins R. Contour integration in anisometropic amblyopia. Vision Res. 1998;38:889–94. doi: 10.1016/s0042-6989(97)00233-2. [DOI] [PubMed] [Google Scholar]
- Hess RF, Mcllhagga W, Field D. Contour integration in strabismic amblyopia: the sufficiency of explanation based on positional uncertainty. Vision Res. 1997;37:3145–316. doi: 10.1016/s0042-6989(96)00281-7. [DOI] [PubMed] [Google Scholar]
- Hess RF, Wang YZ, Demanins R, Wilkinson F, Wilson HR. A deficit in strabismic amblyopia for global shape detection. Vision Res. 1999;39:901–14. doi: 10.1016/s0042-6989(98)00157-6. [DOI] [PubMed] [Google Scholar]
- Hess RF, Dakin SC. Absence of contour linking in peripheral vision. Nature. 1997;390:602–4. doi: 10.1038/37593. [DOI] [PubMed] [Google Scholar]
- Hess RF, Dakin SC. Contour integration in the peripheral field. Vision Res. 1999;39:947–59. doi: 10.1016/s0042-6989(98)00152-7. [DOI] [PubMed] [Google Scholar]
- Huang PC, Hess RF, Dakin SC. Flank facilitation and contour integration: Different sites. Vision Res. 2006;46:3699–706. doi: 10.1016/j.visres.2006.04.025. [DOI] [PubMed] [Google Scholar]
- Ito M, Komatsu H. Representation of angles embedded within contour stimuli in area V2 of macaque monkeys. J Neurosci. 2004;24:3313–24. doi: 10.1523/JNEUROSCI.4364-03.2004. [DOI] [PMC free article] [PubMed] [Google Scholar]
- Kapadia MK, Ito M, Gilbert CD, Westheimer G. Improvement in visual sensitivity by changes context: Parallel studies in human observers and in V1 of alert monkeys. Neuron. 1995;15:843–856. doi: 10.1016/0896-6273(95)90175-2. [DOI] [PubMed] [Google Scholar]
- Kiorpes L. Visual Processing in Amblyopia: Animal Studies. Strabismus. 2006;14:3–10. doi: 10.1080/09273970500536193. [DOI] [PubMed] [Google Scholar]
- Kourtzi Z, Tolias AS, Altmann CF, Augath M, Logothetis NK. Integration of local features into global shapes: Monkey and human fMRI studies. Neuron. 2003;37:333–346. doi: 10.1016/s0896-6273(02)01174-1. [DOI] [PubMed] [Google Scholar]
- Kovacs I, Polat U, Pennefather PM, Chandna A, Norcia AM. A new test of contour integration deficits in patients with a history of disrupted binocular experience during visual development. Vision Res. 2000;40:1775–83. doi: 10.1016/s0042-6989(00)00008-0. [DOI] [PubMed] [Google Scholar]
- Kozma P, Kiorpes L. Contour integration in amblyopic monkeys. Visual Neurosci. 2003;20:577–88. doi: 10.1017/s0952523803205113. [DOI] [PubMed] [Google Scholar]
- Lagreze WD, Sireteanu R. Two-dimensional spatial distortions in human strabismic amblyopia. Vision Res. 1991;31:1271–88. doi: 10.1016/0042-6989(91)90051-6. [DOI] [PubMed] [Google Scholar]
- Lamme VA. The neurophysiology of figure-ground segregation in primary visual cortex. J Neurosci. 1995;15:1605–15. doi: 10.1523/JNEUROSCI.15-02-01605.1995. [DOI] [PMC free article] [PubMed] [Google Scholar]
- Levi DM. Visual Processing in Amblyopia: Human Studies. Strabismus. 2006;14:11–19. doi: 10.1080/09273970500536243. [DOI] [PubMed] [Google Scholar]
- Levi DM, Klein SA. Sampling in spatial vision. Nature. 1986;320:360–62. doi: 10.1038/320360a0. [DOI] [PubMed] [Google Scholar]
- Levi DM, Hariharan V, Klein SA. Suppressive and facilitatory spatial interactions in amblyopic vision. Vision Res. 2002;42:1379–94. doi: 10.1016/s0042-6989(02)00061-5. [DOI] [PubMed] [Google Scholar]
- Levi DM, Sharma V. Integration of local orientation in strabismic amblyopia. Vision Res. 1998;38:775–81. doi: 10.1016/s0042-6989(97)00334-9. [DOI] [PubMed] [Google Scholar]
- Levi DM, Klein SA, Sharma V. Position jitter and undersampling in pattern perception. Vision Res. 1999;39:445–65. doi: 10.1016/s0042-6989(98)00125-4. [DOI] [PubMed] [Google Scholar]
- Levi DM, Klein SA, Sharma V, Nguyen L. Detecting disorder in spatial vision. Vision Res. 2000;40:2307–27. doi: 10.1016/s0042-6989(00)00087-0. [DOI] [PubMed] [Google Scholar]
- Li W, Piech V, Gilbert CD. Perceptual learning and top-down influences in primary visual cortex. Nat Neurosci. 2004;7:651–7. doi: 10.1038/nn1255. [DOI] [PMC free article] [PubMed] [Google Scholar]
- Li W, Piech V, Gilbert CD. Contour saliency in primary visual cortex. Neuron. 2006;50:951–62. doi: 10.1016/j.neuron.2006.04.035. [DOI] [PubMed] [Google Scholar]
- Lowel S, Singer W. Selection of intrinsic horizontal connections in the visual cortex by correlated neuronal activity. Science. 1992;255:209–12. doi: 10.1126/science.1372754. [DOI] [PubMed] [Google Scholar]
- Mansouri B, Allen HA, Hess RF. Detection, discrimination and integration of second-order orientation information in strabismic and anisometropic amblyopia. Vision Res. 2005;45:2449–60. doi: 10.1016/j.visres.2005.02.018. [DOI] [PubMed] [Google Scholar]
- Mcllhagga WH, Mullen KT. Contour integration with colour and luminance contrast. Vision Res. 1996;36:1265–79. doi: 10.1016/0042-6989(95)00196-4. [DOI] [PubMed] [Google Scholar]
- McKee SP, Levi DM, Movshon JA. The pattern of visual deficits in amblyopia. Journal of Vision. 2003;3:380–405. doi: 10.1167/3.5.5. [DOI] [PubMed] [Google Scholar]
- Moulden B. Ciba Foundation Symposium. Vol. 184. Wiley; Chichester: 1994. Collator units: second stage orientational filters. In Higher-order Processing in the visual system. [DOI] [PubMed] [Google Scholar]
- Mussap AJ, Levi DM. Orientation-based texture segmentation in strabismic amblyopia. Vision Res. 1999;39:411–8. doi: 10.1016/s0042-6989(98)00218-1. [DOI] [PubMed] [Google Scholar]
- Mussap AJ, Levi DM. Amblyopic deficits in detecting a dotted line in noise. Vision Res. 2000;40:3297–307. doi: 10.1016/s0042-6989(00)00154-1. [DOI] [PubMed] [Google Scholar]
- Norcia AM, Sampath V, Hou C, Pettet MW. Experience-expectant development of contour integration mechanisms in human visual cortex. Journal of Vision. 2005;5:116–30. doi: 10.1167/5.2.3. [DOI] [PubMed] [Google Scholar]
- Pointer JS, Watt RJ. Shape recognition in amblyopia. Vision Res. 1987;27:651–60. doi: 10.1016/0042-6989(87)90049-6. [DOI] [PubMed] [Google Scholar]
- Polat U, Bonneh Y. Collinear interactions and contour integration. Spatial Vis. 2000;13:393–401. doi: 10.1163/156856800741270. [DOI] [PubMed] [Google Scholar]
- Polat U, Sagi D, Norcia AM. Abnormal long-range spatial interactions in amblyopia. Vision Res. 1997;37:737–44. doi: 10.1016/s0042-6989(96)00154-x. [DOI] [PubMed] [Google Scholar]
- Popple AV, Levi DM. Amblyopes see true alignment where normal observers see illusory tilt. Proceedings of the National Academy of Sciences. 2000;97:11667–72. doi: 10.1073/pnas.97.21.11667. [DOI] [PMC free article] [PubMed] [Google Scholar]
- Sharma V, Levi DM, Coletta NJ. Sparse-sampling of gratings in the visual cortex of strabismic amblyopes. Vision Res. 1999;39:3526–36. doi: 10.1016/s0042-6989(99)00028-0. [DOI] [PubMed] [Google Scholar]
- Sharma V, Levi DM, Klein SA. Undercounting features and missing features: evidence for a high-level deficit in strabismic amblyopia. Nature Neuroscience. 2000;3:496–501. doi: 10.1038/74872. [DOI] [PubMed] [Google Scholar]
- Simmers AJ, Bex PJ. The representation of global spatial structure in amblyopia. Vision Res. 2004;44:523–33. doi: 10.1016/j.visres.2003.10.010. [DOI] [PubMed] [Google Scholar]
- Simmers AJ, Ledgeway T, Hess RF. The influences of visibility and anomalous integration processes on the perception of global spatial form versus motion in human amblyopia. Vision Res. 2005;45:449–60. doi: 10.1016/j.visres.2004.08.026. [DOI] [PubMed] [Google Scholar]
- Simmers AJ, Ledgeway T, Hess RF, McGraw PV. Deficits to global motion processing in human amblyopia. Vision Res. 2003;43:729–38. doi: 10.1016/s0042-6989(02)00684-3. [DOI] [PubMed] [Google Scholar]
- Tychsen L, Burkhalter A. Neuroanatomic abnormalities of primary visual cortex in macaque monkeys with infantile esotropia: preliminary results. J. Ped. Opthalmol. & Strabismus. 1995;32:323–28. doi: 10.3928/0191-3913-19950901-13. [DOI] [PubMed] [Google Scholar]
- Wetherill GB, Levitt H. Sequential estimation of points on a psychometric function. Br. J. Math Stat Psychol. 1965;18:1–10. doi: 10.1111/j.2044-8317.1965.tb00689.x. [DOI] [PubMed] [Google Scholar]
- Williams CB, Hess RF. Relationship between facilitation at threshold and suprathreshold contour integration. JOSA(A) 1998;15:2046–51. doi: 10.1364/josaa.15.002046. [DOI] [PubMed] [Google Scholar]
- Wong EH, Levi DM, McGraw PV. Spatial interactions reveal inhibitory cortical networks in human amblyopia. Vision Res. 2005;45:2810–19. doi: 10.1016/j.visres.2005.06.008. [DOI] [PubMed] [Google Scholar]
- Yu C, Kuai Constant contour integration in peripheral vision for well-defined stimuli. 2006 doi: 10.1167/6.12.7. Submitted. [DOI] [PubMed] [Google Scholar]


