

Abstract
PURPOSE
To prospectively determine if pulsed arterial spin-labeling perfusion magnetic resonance (MR) imaging depicts regional cerebral hypoperfusion in subjects with Alzheimer disease (AD) and mild cognitive impairment (MCI), compared with perfusion in cognitively normal (CN) subjects, that is consistent with results of fluorodeoxyglucose (FDG) positron emission tomography (PET) and hexamethyl-propyleneamine oxime (HMPAO) single photon emission computed tomography (SPECT) studies of similar populations.
MATERIALS AND METHODS
Institutional review board approval and informed consent were obtained. Twenty subjects with AD (13 men, seven women; mean age, 72.9 years), 18 with MCI (nine men, nine women; mean age, 73.3 years), and 23 CN subjects (10 men, 13 women; mean age, 72.9 years) underwent arterial spin-labeling and volumetric T1-weighted structural MR imaging. Perfusion images were coregistered to structural images, corrected for partial volume effects (PVEs) with information from the structural image to determine tissue content of perfusion voxels, and normalized to a study-specific template. Analyses of perfusion differences between groups, with and without corrections for PVEs, were performed on a voxel-by-voxel basis with a one-tailed fixed-effects analysis of covariance model adjusted for age. In addition, tests were performed with and without accounting for global perfusion.
RESULTS
The AD group showed significant regional hypoperfusion, compared with the CN group, in the right inferior parietal cortex extending into the bilateral posterior cingulate gyri (P < .001), bilateral superior and middle frontal gyri (P < .001), and left inferior parietal lobe (P = .007). When PVEs from underlying cortical gray matter atrophy were accounted for, the AD group still showed hypoperfusion in the right inferior parietal lobe extending into the bilateral posterior cingulate gyri (P < .001) and left (P = .003) and right (P = .012) middle frontal gyri. With a more liberal voxel-level threshold of P < .01, the MCI group showed significant regional hypoperfusion relative to the CN group in the inferior right parietal lobe (P = .046), similar to the region of greatest significance in the AD group.
CONCLUSION
Arterial spin-labeling MR imaging showed regional hypoperfusion with AD, in brain regions similar to those seen in FDG PET and HMPAO SPECT studies of similar populations; this hypoperfusion persists after accounting for underlying cortical gray matter atrophy.
Results of neuropathologic studies suggest that evidence of Alzheimer disease (AD) may be present in the brain years or even decades prior to the onset of clinical symptoms (1,2). Currently, multiple potential therapies are being developed to attempt to halt or disrupt the disease process before neurons are irrevocably lost (3). Evaluation of the effectiveness of these potential treatments will be enhanced by identification of patients at the earliest stages of the disease and by the possibility of objectively measuring disease progression. Because of this, there is currently great interest in the characterization of AD by means of objective measures such as brain imaging, particularly in early stages of the disease process.
Fluorodeoxyglucose (FDG) positron emission tomography (PET), which is used to measure glucose metabolism, and technetium 99m hexamethylpropyleneamine oxime (HMPAO) single photon emission computed tomography (SPECT), which is used to measure cerebral blood flow, consistently show reduction of cerebral metabolism or blood flow in studies of subjects with AD. The most characteristic reductions of metabolism or blood flow are seen in the temporoparietal association cortices, in the posterior cingulate cortex, and, to a lesser extent, in frontal association cortices with relative sparing of the primary motor and sensory cortices (4 – 6). More recently, PET and SPECT have been used to examine subjects with genetic predisposition to AD, family history of AD, very mild AD, or mild cognitive impairment (MCI) in an attempt to characterize functional patterns associated with preclinical or early disease. The results of these studies suggest a similarity between regions most affected in AD and those regions affected in subjects who have high risk of developing dementia, which suggests that detection of such functional changes may be useful for early detection of AD (7–17).
Arterial spin-labeling perfusion magnetic resonance (MR) imaging is another method used to assess brain perfusion and function in dementia (18). To the extent that regional metabolism and perfusion are coupled, arterial spin-labeling MR imaging, at which arterial blood water is labeled as an endogenous diffusible tracer for perfusion, may depict functional deficiencies in a way similar to FDG PET and HMPAO SPECT (19). Moreover, arterial spin-labeling MR imaging offers several advantages over these techniques: It is entirely noninvasive and free of exposure to ionizing radiation, intravenous contrast agents, and radioactive isotopes; it can be performed with most MR imagers in 10–15 minutes; and it can be rapidly repeated, since labeled water is cleared after a few seconds because of T1 relaxation. An additional advantage is that both perfusion and structural images can be obtained during the same imaging session.
Results of a few previous studies on arterial spin-labeling MR imaging of AD showed regional hypoperfusion in subjects with AD in a pattern similar to that in PET and SPECT studies, which demonstrates the promise of this approach (20,21). However, authors of these studies did not account for underlying gray matter atrophy in AD and, as in most previous PET and SPECT studies (22–25), ignored partial volume effects (PVEs) due to white matter. Furthermore, there are no previous arterial spin-labeling MR studies of subjects with MCI or prodromal AD.
We had three a priori hypotheses for our study: (a) that arterial spin-labeling MR imaging would depict regional hypoperfusion in the parietal association cortices and posterior cingulate gyri of subjects with AD, relative to perfusion in subjects with normal cognitive function (cognitively normal [CN] subjects), (b) that differences in regional perfusion between groups would remain after partial volumes of white matter and cerebrospinal fluid in perfusion voxels were accounted for, and (c) that similar patterns of hypoperfusion as observed in patients with AD would also be detected in subjects with MCI, a group with cognitive impairments who do not have dementia but who have a high risk for conversion to dementia with AD. Thus, the purpose of our study was to prospectively determine if arterial spin-labeling MR imaging would depict regional cerebral hypoperfusion in subjects with AD and MCI, compared with CN subjects, that is consistent with results from previous FDG PET and HMPAO SPECT studies of similar populations.
MATERIALS AND METHODS
Subjects
Twenty-three CN elderly subjects, 18 subjects with MCI, and 20 subjects with AD were recruited from two academic dementia centers and were examined by means of structural MR imaging and arterial spin-labeling MR imaging. Sample sizes were estimated by means of power analysis based on arterial spin-labeling MR imaging pilot studies performed in our laboratory with patients and control subjects; results of these pilot studies showed about 10% variability and 20% difference in global cerebral perfusion between the groups. On the basis of these values, at least 20 subjects would be needed in each group to detect a 10% difference in perfusion between the groups with 90% confidence. Our institutional review board approved this study, and patient informed consent was obtained for all participants prior to evaluation. For subjects who were determined by the clinician not to have the capacity to consent because of cognitive impairment, a legally authorized surrogate provided consent.
All participants provided a detailed medical history and underwent neurologic examination, screening laboratory testing, and a standard battery of neuropsychologic tests, which included the Mini-Mental State Examination (26) for global cognitive ability; the California Verbal Learning Test II (27) for episodic memory; Color-Word Interference (27), California Trail-Making (27), and Verbal Design Fluency (28) tests for executive functions; the Clinical Dementia Rating Scale, or CDR (29); and the Functional Activities Questionnaire (30). A diagnosis of probable AD was made by using criteria from the National Institute of Neurological and Communicative Disorders and Stroke-Alzheimer Disease and Related Disorder’s Association (31). A diagnosis of MCI was made according to the Petersen or the Alzheimer Disease Cooperative Study criteria (32). Petersen criteria consisted of the presence of subjective memory complaints by the patient or a collateral source, intact activities of daily living, a CDR score of 0.5, performance on a delayed memory test that was scored at least one standard deviation below the age- and education-adjusted mean, normal performance on other nonmemory cognitive tasks, and the absence of dementia. Alzheimer Disease Cooperative Study criteria include all Petersen criteria, as well as the following additional requirements: mandatory verification of memory difficulties by an informant, a Mini-Mental State Examination score of 24 or greater, no more than two CDR box scores for categories other than memory rated as high as 1, no CDR box score greater than 1, and a memory box score of 0.5 or 1.0.
CN subjects had neuropsychologic test scores within the normal age- and education-adjusted range and had no history of psychiatric disease, neurologic disease, major heart disease, diabetes, vascular disease, epilepsy, or head trauma. Furthermore, a neuroradiologist with 20 years of experience in brain MR imaging evaluated T1-weighted, T2-weighted, and intermediate-weighted MR images for each subject to determine that study subjects had no evidence of prior cortical infarction.
Image Acquisition
Images were acquired by using a standard 1.5-T MR system (Vision; Siemens, Erlangen, Germany) by using a circularly polarized head coil for radiofrequency transmission and reception.
A described method for pulsed arterial spin labeling by means of double inversions with proximal labeling of both tag and control images, termed DIPLOMA, was used for labeling arterial blood water (33). In brief, labeling was achieved by using a frequency-selective inversion pulse off-resonance to water and a slab-selective inversion pulse with the same amplitude on-resonance to water. For reference without spin labeling, two slab-selective inversion pulses on-resonance to water were used. Because the pulses were all of the same amplitude, undesirable magnetization transfer effects that are induced with labeling were canceled out better than they would be with standard methods of pulsed arterial spin labeling. Moreover, since the inversion pulses used the same power, slab profiles on the labeled and reference images were the same. Finally, eddy current effects from pulsed gradients were canceled to a large extent as well, because pulsed gradients were applied in both labeled and reference sequences. Following pulsed arterial spin labeling, a bolus of labeled blood water was established by applying a series of 14 short saturation pulses to the distal edge of the slab, as proposed previously (34). Five MR sections (each 8 mm thick, 2 mm apart, and oriented 10° off the anterior-posterior commisure line) were then acquired by using single-shot gradient-echo echo-planar sequences with a resolution of 2.3 × 2.3 mm over a field of view of 225 × 300 mm. The other acquisition parameters for the labeled and reference images were as follows: repetition time, 2.5 seconds; echo time, 15 msec; time from labeling pulse to the excitation pulse (labeling delay), 1500 msec. Labeled and reference images were then subtracted to obtain perfusion-weighted imaging data. Additionally, a single-shot gradient-echo echo-planar sequence was performed to cover the whole brain with the same resolution and orientation as the perfusion sequence.
For brain tissue segmentation and image registration to a brain anatomy template, T1-weighted images were acquired by using a standard magnetization-prepared rapid acquisition gradient-echo sequence with a repetition time of 10 msec, echo time of 7 msec, inversion time of 300 msec, 15° flip angle, 1.00 × 1.00-mm in-plane resolution, and 1.4-mm-thick coronal partitions oriented orthogonally to the optic nerve, as seen from a midsection scout MR image.
Following acquisition and image reconstruction, the data were transferred to an off-line personal computer for image processing and analysis. All subsequent image processing was performed by one of the authors (N.A.J.).
Spatial Processing
For each subject, the perfusion image was coregistered with the T1-weighted image by using the mutual information coregistration algorithm within a statistical parametric mapping program (SPM version 1999; Wellcome Department of Cognitive Neurosciences, London, England). Since direct coregistration of perfusion-weighted and T1-weighted MR images was not reliable, because of the poor signal-to-noise ratio and the limited structural features of perfusion-weighted images, a stepwise coregistration was done by first registering labeled and reference images to the echo-planar reference image for each subject and then registering the echo-planar reference image to the T1-weighted image. Once all four images were coregistered, the perfusion image was calculated by subtracting the labeled and reference images. In this way, the resultant perfusion image was coregistered to the T1-weighted image. A representative perfusion image for a CN elderly subject is shown in Figure 1, A.
Figure 1.
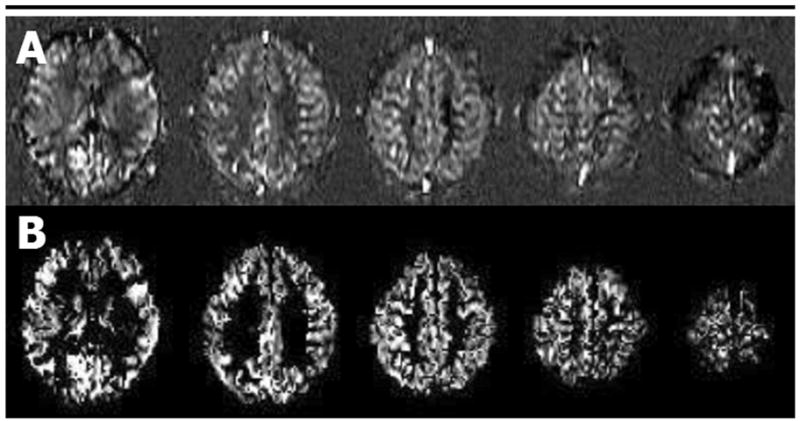
A, Example of transverse arterial spin-labeling MR images obtained with double inversions with proximal labeling of tagged and control images in a single CN subject (gradient-echo echo-planar acquisition; repetition time, 2.5 seconds; echo time, 15 msec; labeling delay, 1500 msec; resolution, 2.3 × 2.3 mm; section thickness, 8 mm; field of view, 225 × 300 mm). B, Masked perfusion images obtained after voxels corresponding to non–gray matter voxels in the coregistered magnetization-prepared rapid acquisition gradient echo image were removed.
Perfusion signal was then corrected for intersubject variations of coil loading and signal amplification by first calculating the image brightness (BR) according to the following formula: BR = α · 10RG/20, where RG is the receiver gain and α stands for coil loading, which is determined according to the voltage required for a radiofrequency spin inversion pulse. We then calculated the ratio of image brightness to the mean brightness of all the images in the study and then divided the value of each perfusion image by this ratio to obtain a common intensity scale.
To obtain perfusion maps from primarily gray matter regions, T1-weighted images were then segmented to create a probabilistic gray matter mask. The segmentation algorithm of the parametric mapping program (SPM, version 1999) combines a traditional clustering algorithm, which classifies tissues on the basis of voxel intensities, with prior probability information for each voxel obtained by performing a nine-parameter affine transformation of each T1-weighted image to tissue probability maps of the template. In this manner, the segmentation algorithm combines anatomic information with voxel intensity to produce a probabilistic map of gray matter, white matter, and cerebrospinal fluid for each subject. This gray matter mask was then resectioned to the resolution of the perfusion image and converted to a binary mask thresholded at 20% probability to exclude voxels with small amounts of gray matter. The 20% probability threshold was chosen because it minimized the effect of misregistration errors on our atrophy correction procedure while simultaneously minimizing the number of relevant gray matter voxels excluded from the analysis. The perfusion image data was multiplied by the binary gray matter mask data to remove predominantly white matter, cerebrospinal fluid, and nonbrain voxels. The resultant gray matter perfusion image is shown in Figure 1, B.
The perfusion images were then spatially normalized to a study-specific gray matter template by using the normalization parameters generated by spatially normalizing each subject’s T1-weighted MR image to this template. The gray matter template was specifically created for this study by using the gray matter probability masks of all subjects with AD and CN subjects to minimize systematic errors in spatial normalization owing to morphologic differences between groups. This was done by segmenting the T1-weighted images for each subject after affine normalization to the T1 template in the parametric mapping program, taking the mean of all gray matter probability masks, and smoothing the resultant image with an 8-mm full-width-at-half-maximum Gaussian kernel according to the optimized voxel based–morphometry protocol of Good et al (35). Each subject’s T1-weighted image was segmented, and the resultant gray matter mask was spatially normalized to the study-specific gray matter template by using both linear (12-parameter affine) and nonlinear (7 × 8 × 7 basis functions with 12 nonlinear iterations) transformations. Voxels with extreme perfusion values, such as negative values or very high values from large blood vessels that were not removed in the masking process, were then eliminated by setting a low value threshold to zero and a high value threshold to two standard deviations above the mean perfusion in voxels with greater than 95% gray matter for each subject.
Accounting for PVEs of White Matter and Cerebrospinal Fluid
Once perfusion images were accurately coregistered to magnetization-prepared rapid acquisition gradient-echo images, information about the proportion of each tissue type (ie, gray matter, white matter, and cerebrospinal fluid) contained within perfusion voxels was used to correct perfusion data for regions where gray matter atrophy results in perfusion voxels with greater volume fractions of white matter and cerebrospinal fluid. PVE correction for cerebrospinal fluid was calculated for each voxel on the perfusion image on the basis of the methods of Meltzer et al (36) and Muller-Gartner et al (37), described previously for correction of PET data, for which it is assumed that all contributions to perfusion are from brain tissue and that cerebrospinal fluid contributes nothing. Furthermore, to account for partial volumes of gray matter and white matter in the voxel, we assumed that the perfusion to gray matter is 2.5 times greater than that to white matter per unit volume (18). Taken together, computations for PVEs of cerebrospinal fluid (CSF) and white matter were then performed for each image voxel, according to the following formula: SIcorr = SIuncorr/(GM = 0.4 + WM), where SIcorr and SIuncorr are corrected and uncorrected perfusion signal intensities, respectively, and GM and WM are the probabilities for the tissue volume consisting of gray matter or white matter, respectively, with GM + WM + CSF = 1. Since SIcorr can reach extreme values if voxels contain small amounts of brain tissue (which may happen for voxels with small misregistrations between the structural and perfusion images), an upper limit was set for SIcorr of two standard deviations above the mean value of SIuncorr for all voxels containing at least 95% gray matter.
Statistical Analysis
Statistical tests were performed by one author (N.A.J.) by using the statistical parametric mapping program. Images were smoothed with a 12-mm full-width-at-half-maximum Gaussian kernel prior to statistical analysis to normalize the distribution of perfusion data as required for parametric analysis within the framework of the statistical program. Group differences in perfusion were tested for each voxel by using a one-tailed fixed-effect analysis of covariance model with subject age entered as a covariate. Additionally, group comparisons were made with and without a measure of each subject’s global perfusion entered as an additional covariate to account for inter-subject instrumental and biologic variability. References of global perfusion were calculated for each subject by first extracting data from a region of interest that included portions of the primary motor strip bilaterally and calculating the mean perfusion of these voxels. The motor strip was chosen because it is known to be relatively spared until the very late stages of AD and in this way we attempted to account for global intersubject variability while minimizing the disease effects on that variability (1,2).
The mean motor strip perfusion value was then entered into the analysis of covariance test as a nuisance covariate to adjust for global variations of perfusion. The contrasts performed included the following: the AD group versus the CN group, the AD group versus the CN group adjusted for global perfusion, the MCI group versus the CN group, the MCI group versus the CN group adjusted for global perfusion, and the AD group versus the MCI group adjusted for global perfusion. In addition, contrasts that included the AD group were performed with and without correction for PVEs to account for cortical atrophy in AD.
To exclude the possibility that group differences resulted from imbalance between the sexes, we further performed a conjunction analysis for group and sex (test for a significant main effect of group in absence of differences or interactions between the nuisance effects of sex) to determine the pattern of hypoperfusion that men and women with AD have in common, as compared with the pattern in CN subjects (38).
Results of group comparisons were displayed as statistical parametric maps superimposed on the rendered cortex from a single CN elderly subject. The shaded portions of the renderings represent regions for which perfusion data were not acquired. Clusters displayed on statistical parametric maps were thresholded at a corrected cluster level of P < .05 by using a voxel-level threshold of P < .001, unless explicitly stated. Corrected-cluster-level statistics yielded a correction for multiple comparisons that took into account both significance levels of individual suprathreshold voxels and their proximity to other suprathreshold voxels. For comparisons in which no statistically significant clusters were found by using a voxel-level threshold of P < .001, a more liberal voxel-level threshold of P < .01 was used to view statistical trends, although a corrected-cluster-level threshold of P < .05 was still used for every comparison.
RESULTS
Table 1 shows demographic information for the three study groups. All groups were of a similar age and were balanced for sex except for the AD group, which had a greater proportion of men. The mean Mini-Mental State Examination score in the AD group was 21.0 (range, 17–26), which represents a group with mild to moderate severity of dementia.
TABLE 1.
Characteristics of Study Groups
| Characteristic | AD Group (n = 20) | MCI Group (n = 18) | CN Group (n = 23) |
|---|---|---|---|
| Mean age (y)* | 72.9 (10.8) | 73.3 (8.6) | 72.9 (8.2) |
| Sex† | |||
| Male | 13 | 9 | 10 |
| Female | 7 | 9 | 13 |
| Mean MMSE score‡ | 21.0 (17–26) | 27.7 (24–30) | 29.4 (28–30) |
Data in parentheses are standard deviations.
Data are numbers of patients.
Data in parentheses are ranges. MMSE = Mini–Mental State Examination.
AD Group versus CN Group
The comparison of the AD group versus the CN group demonstrated significant clusters of hypoperfusion in the parietal (P < .001; cluster size [in normalized voxels], 5541) and frontal association cortices (P < .001; cluster size, 1190) bilaterally in AD (Fig 2, A). Cluster level statistics for all rendered clusters are shown in Table 2. The parietal cluster includes the inferior parietal lobes, posterior cingulate gyri, and precunei, with greater significance in the right parietal lobe than in the left. There were no clusters of significant hypoperfusion seen in the primary motor or sensory cortices.
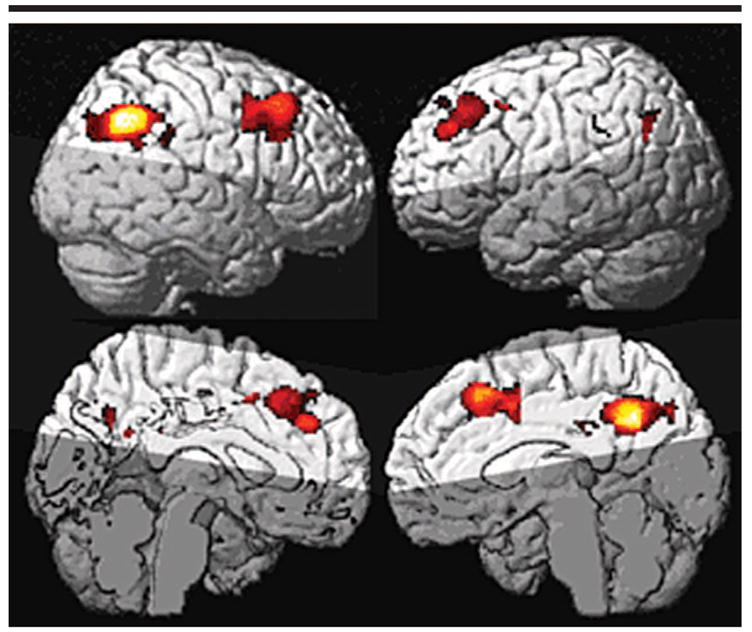
Figure 2.

A, Statistical parametric maps of regional hypoperfusion in the AD group (relative to the CN group). All colored voxels are contained within clusters with a corrected cluster-level P value of .05. Yellow voxels are regions of greatest group differences. The most significant hypoperfusion is in the posterior cingulate gyri and parietal association cortices. B, Same analysis as in A, after accounting for global perfusion. C, Same analysis as in A, with data corrected for PVEs and after accounting for global perfusion. Although significance and spatial extent of hypoperfusion are reduced, the regional pattern remains very similar and suggests group effects cannot be fully explained by underlying cortical atrophy.
TABLE 2.
Summary of Cluster-Level Statistics for Clusters Displayed on Rendered Cortical Statistical Parametric Maps
| Group Analysis | Figure | Cluster-Level Corrected P Value | Cluster Size | Cluster Location | MNI Coordinates of Cluster Maxima* | z Score of Local Maxima |
|---|---|---|---|---|---|---|
| AD versus CN | 2, A | <.001 | 5541 | Bilateral posterior cingulate, bilateral precuneus, right inferior parietal lobe | 26, −54, 42 | 5.27 |
| <.001 | 4128 | Bilateral superior and middle frontal gyri | −26, 44, 32 | 4.29 | ||
| .007 | 1190 | Left inferior parietal lobe | −30, −62, 32 | 4.20 | ||
| AD versus CN (adjusted for global perfusion) | 2, B | <.001 | 2788 | Bilateral posterior cingulate, bilateral precuneus, right inferior parietal lobe | 36, −60, 40 | 5.09 |
| .003 | 775 | Left middle frontal gyrus | −32, 28, 44 | 4.13 | ||
| .012 | 521 | Right middle frontal gyrus | 34, 6, 48 | 4.16 | ||
| AD versus CN (corrected for PVE; adjusted for global perfusion) | 2, C | <.001 | 2312 | Right parietal lobe | 36, −60, 38 | 5.35 |
| .002 | 805 | Right middle frontal gyrus | 34, 6, 50 | 4.16 | ||
| .023 | 419 | Left middle frontal gyrus | −28, 42, 32 | 4.01 | ||
| MCI versus CN (adjusted for global perfusion) | 3, A | .046† | 1517 | Right inferior parietal lobe | 68, −32, 46 | 3.99 |
| AD versus MCI (corrected for PVE; adjusted for global perfusion) | 3, B | <.001† | 5231 | Bilateral posterior cingulate, bilateral precuneus, bilateral inferior parietal lobe | 32, −76, 30 | 4.25 |
MNI = Montreal Neurological Institute.
A voxel-level statistical threshold of P < .01 was used.
AD Group versus CN Group: Adjusted for Global Perfusion
After accounting for intersubject variations in global perfusion, significant clusters of hypoperfusion in the AD group remained in the right inferior parietal lobe extending to the posterior cingulate gyri bilaterally (P < .001; cluster size, 2788), left frontal lobe (P = .003; cluster size, 775), and right frontal lobe (P = .012; cluster size, 521) (Fig 2, B). No significant hypoperfusion was found in the lateral left parietal lobe as seen when global perfusion was not accounted for.
AD Group versus CN Group: Corrected for PVEs and Adjusted for Global Perfusion
After accounting for PVEs, significant clusters of hypoperfusion remained in the right parietal lobe (P < .001; cluster size, 2312), portions of the right middle frontal gyrus (P = .002; cluster size, 805), and the left middle frontal gyrus (P = .023; cluster size, 419) of the AD group (Fig 2, C). When compared with the analysis in which we used non–PVE corrected data, the significance levels and cluster sizes were slightly decreased, but the regional pattern of hypoperfusion remained similar after PVE correction.
Conjunction Analysis
The conjunction analysis was used to test for group effects in subjects with AD relative to CN subjects in the absence of sex differences or interactions. This analysis demonstrated that men and women with AD showed comparable patterns of regional hypoperfusion (Fig 4).
Figure 4.
Statistical parametric maps of regional hypoperfusion in the AD group (relative to the CN group). The conjunction analysis here shows group effects with sex differences and interactions removed. Highlighted voxels show regional hypoperfusion in the AD group independent of sex imbalance between groups (uncorrected P < .001). This shows that effects seen in the left posterior cingulate and parietal lobes are not dependent on sex imbalances.
MCI Group versus CN Group
The comparison of the MCI group versus the CN group showed no significant clusters of hypoperfusion in the MCI group. The comparison of the MCI group versus the CN group (covaried for global perfusion) also showed no significant regions of hypoperfusion in the MCI group. This group comparison was then repeated after lowering the voxel-level threshold to P < .01 to look for statistical trends. This comparison showed significant hypoperfusion in the right inferior parietal lobe (P = .046; cluster size, 1517) of the MCI group (Fig 3, A).
Figure 3.
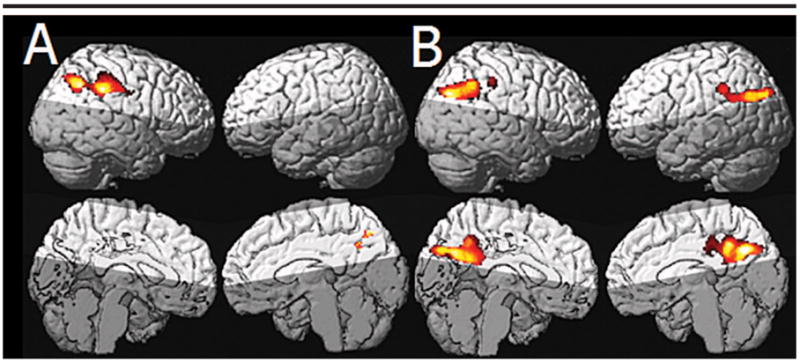
A, Statistical parametric maps show regional hypoperfusion in the MCI group (relative to the CN group) after accounting for global perfusion. A lower voxel-level threshold of P < .01 was used. The cluster of significant hypoperfusion is located in the right parietal lobe, in a region very similar to that most affected in the AD group. B, Statistical parametric maps show hypoperfusion in the AD group relative to the MCI group with correction for PVEs and adjusted for global perfusion. The right parietal regions seen in A are not seen in B; this suggests that hypoperfusion in this region may reflect early disease effects in the MCI group.
AD Group versus MCI Group: Corrected for PVEs and Adjusted for Global Perfusion
No significant clusters of hypoperfusion were seen in the AD group by using a voxel-level statistical threshold of P < .001. With a voxel-level threshold of P < .01, a significant cluster of hypoperfusion encompassing portions of the inferior parietal lobes, precuneus, and posterior cingulate gyri bilaterally (P < .001; cluster size, 5231) was found (Fig 3, B).
DISCUSSION
The major findings of this study were as follows: First, we demonstrated patterns of hypoperfusion in subjects with mild to moderate AD by using arterial spin-labeling MR imaging. The brain regions involved were similar to those in previous FDG PET and HMPAO SPECT studies of similar populations. Specifically, we found regional hypoperfusion in the parietal association cortices and posterior cingulate gyri of subjects with AD as compared with the perfusion in those structures in CN subjects. Second, these patterns of hypoperfusion in subjects with AD were largely independent of underlying cortical gray matter atrophy. Third, we observed hypoperfusion of the right inferior parietal lobe in the MCI group compared with that in the CN group. Considered together, these results suggest that arterial spin-labeling MR images, analyzed together with coregistered structural MR images, may depict patterns of reduced brain function in subjects with AD and subjects at risk for AD; this finding is similar to results previously observed with FDG PET or HMPAO SPECT but without the disadvantages of these techniques.
Our first finding of hypoperfusion in subjects with AD—specifically, reductions in the parietal association cortices and posterior cingulate gyri—is consistent with a large volume of PET and SPECT research showing that regional hypoperfusion is most prominent in the sensory and multimodal association cortices, as well as in the posterior cingulate gyri (4–6). Results of previous studies have shown a temporal relationship for this pattern, with milder AD focused more in the cingulate gyri and temporoparietal cortices and frontal hypoperfusion seen with more advanced disease (39,40). This is consistent with our findings in a group of subjects with mild to moderate AD, in whom the greatest hypoperfusion was shown in the parietal lobes and cingulate gyri and a smaller effect was seen in the frontal lobes. These results are also consistent with those of a previous arterial spin-labeling MR study involving subjects with AD, in which a similar voxel-based approach that showed hypoperfusion most substantially in the temporoparietal cortices was used (21).
We also found that nonnormalized measurements of perfusion showed more extensive regional hypoperfusion in subjects with AD compared with those in CN subjects than did perfusion measurements adjusted for a global measure of perfusion for each subject. It is difficult to determine whether this is due to confounding effects of instrumental errors specific to the group or whether there are global disease effects in addition to regional effects. The fact that similar regions remained significantly hypoperfused even after accounting for inter-subject variability of motor strip perfusion does not help separate these effects, but it does suggest that there are regional effects independent of global differences. In contrast to results of the AD group versus CN group comparison, results in the MCI group showed the greatest hypoperfusion relative to the CN group only after normalization. This may result from early disease effects being more localized while the magnitudes of biologic variability and disease effects are more similar at this early stage.
In light of the incomplete understanding of sex effects on regional perfusion in normal aging and dementia, a conjunction analysis for group and sex was done to determine the extent to which men and women with AD show similar patterns of hypoperfusion. We found very similar regions in the parietal lobes, cingulate gyri, and frontal lobes with both the conjunction analysis and the overall group comparison. These results suggest that the regional hypoperfusion seen in AD is largely independent of sex.
Our second finding was that patterns of hypoperfusion in AD were not caused by PVEs of cerebrospinal fluid and white matter in the setting of cortical gray matter atrophy. The separation of underlying structural changes from hypoperfusion is important in understanding the onset and progression of dementia, since these two processes may differ in temporal as well as spatial extent. Results of PET and SPECT studies with asymptomatic subjects at high risk for development of dementia suggest that perfusion deficits may exist in presymptomatic stages before substantial atrophy is present (7–17). Furthermore, studies combining both functional and structural measurements demonstrate that metabolic and structural changes associated with AD have a complex relationship both spatially and temporally (41–44). PVE correction is particularly important in light of large voxel size in the perfusion image relative to gray matter thickness, which results in greater PVEs. Our results are consistent with those of previous PET and SPECT studies that include corrections for PVEs of cerebrospinal fluid and show that hypoperfusion in the parietal lobes and cingulate are largely independent of atrophy in mild to moderate AD (22–25). Additionally, our atrophy correction technique corrects for the PVEs of white matter, thereby accounting for the differential perfusion to gray matter and white matter, a correction that is usually not performed in PET and SPECT studies in which there is correction for atrophy.
Our third finding was that there was hypoperfusion of the right inferior parietal lobe in the MCI group compared with perfusion in the CN group. Notably, the region of greatest difference between the MCI and CN groups was in a region similar to that most affected in the AD group. The AD versus MCI analysis showed that the AD group had significant hypoperfusion in the cingulate gyri and portions of the inferior parietal lobes compared with perfusion in the MCI group, but these regions did not overlap the region most affected in the MCI group compared to perfusion in the CN group. While the significance of the regional hypoperfusion seen in the MCI group relied on a lower voxel-level statistical threshold, its location in the region most affected in the AD group and the lack of a difference between AD and MCI in this same region was consistent with the hypothesis that subjects with MCI may demonstrate regional hypoperfusion in the regions most affected in AD prior to the onset of clinical AD. Our study may have lacked the power to depict more extensive differences between the MCI and CN groups because of the heterogeneity of our MCI group since, presumably, our MCI group included both subjects whose conditions would convert to AD and those whose conditions would not convert. In fact, published results of most studies showing statistically significant regional hypoperfusion in a population with MCI with use of PET or SPECT have included subjects with MCI whose conditions were known to have subsequently converted to AD or those who were at higher risk because of strong genetic risk factors (45). While it is interesting to note that our MCI group showed a trend toward hypoperfusion in a region severely affected in the AD group, the relevance of this finding depends on future analyses in which the clinical outcome of the subjects with MCI is known.
This study had several limitations. The most important limitation was that data were acquired only for the superior cerebral cortex because of technical limitations that required spin labeling at the circle of Willis, thus excluding major portions of the temporal lobes and inferior frontal lobes from the perfusion image. Consequently, interpretation of our results as they relate to the characterization of the diagnostic groups studied must be tempered by the understanding that the brain regions with the greatest pathologic changes in early disease (ie, median temporal lobe structures such as hippocampal regions and entorhinal cortex) were not included. A second limitation was that transit time and T1 relaxation times of labeled water in blood and brain tissue were not measured because they require longer imaging times, which may have increased the attrition rate. Therefore, increased transit times in imaging of AD and MCI because of cerebrovascular factors or decreased T1 relaxation may have mimicked hypoperfusion. While we attempted to minimize group differences due to technical factors and to account for intersubject variations in global perfusion when comparing groups, the more reliable way to study effects of disease is by using quantitative arterial spin-labeling MR imaging that also takes into account effects of transit times and blood and tissue water relaxations.
In conclusion, regional hypoperfusion measured with arterial spin-labeling MR imaging in a population with AD is similar to that seen with other functional modalities and is, to a large extent, independent of underlying gray matter atrophy. These results suggest that perfusion MR imaging is a useful tool for the functional characterization of AD and may be useful for early detection of the disease.
Acknowledgments
We appreciate the help of Diana Truran and her staff for their work in image acquisition and data processing, David Norman, MD, for clinical evaluation of all MR images, and Owen Wolkowitz, MD, for clinical evaluation of many of the cognitively normal subjects.
Abbreviations
- AD
Alzheimer disease
- CN
cognitively normal
- FDG
fluorodeoxyglucose
- HMPAO
hexamethylpropylene-amine oxime
- MCI
mild cognitive impairment
- PVE
partial volume effect
Footnotes
From the MR Research Unit, VA Medical Center, 4150 Clement St (114M), San Francisco, CA 94107.
Authors stated no financial relationship to disclose.
Author contributions: Guarantors of integrity of entire study, N.S., M.W.W.; study concepts and design, all authors; literature research, N.A.J., N.S.; clinical studies, B.L.M., H.C.C., W.J.J.; experimental studies, G.H.J., N.S.; data acquisition and analysis/interpretation, all authors; statistical analysis, N.A.J., G.H.J., N.S., M.L.G.T.; manuscript editing, N.A.J., G.H.J., N.S., M.L.G.T.; manuscript preparation, definition of intellectual content, revision/review, and final version approval, all authors
Supported in part by a research applications grant of the Department of Veterans Affairs REAP. M.W.W. supported by NIH grant AG10897. H.C.C. supported by NIH grant AG12435.
References
- 1.Braak H, Braak E. Frequency of stages of Alzheimer-related lesions in different age categories. Neurobiol Aging. 1997;18:351–357. doi: 10.1016/s0197-4580(97)00056-0. [DOI] [PubMed] [Google Scholar]
- 2.Braak H, Braak E. Evolution of neuronal changes in the course of Alzheimer’s disease. J Neural Transm Suppl. 1998;53:127–140. doi: 10.1007/978-3-7091-6467-9_11. [DOI] [PubMed] [Google Scholar]
- 3.Tariot PN, Federoff HJ. Current treatment for Alzheimer disease and future prospects. Alzheimer Dis Assoc Disord. 2003;17:S105–S113. doi: 10.1097/00002093-200307004-00005. suppl 4. [DOI] [PubMed] [Google Scholar]
- 4.Mielke R, Kessler J, Szelies B, Herholz K, Wienhard K, Heiss WD. Normal and pathological aging: findings of positron-emission-tomography. J Neural Transm. 1998;105:821–837. doi: 10.1007/s007020050097. [DOI] [PubMed] [Google Scholar]
- 5.Jagust WJ. Neuroimaging in dementia. Neurol Clin. 2000;18:885–902. doi: 10.1016/s0733-8619(05)70231-0. [DOI] [PubMed] [Google Scholar]
- 6.Petrella JR, Coleman RE, Doraiswamy PM. Neuroimaging and early diagnosis of Alzheimer disease: a look to the future. Radiology. 2003;226:315–336. doi: 10.1148/radiol.2262011600. [DOI] [PubMed] [Google Scholar]
- 7.Small GW, Mazziotta JC, Collins MT, et al. Apolipoprotein E type 4 allele and cerebral glucose metabolism in relatives at risk for familial Alzheimer disease. JAMA. 1995;273:942–947. [PubMed] [Google Scholar]
- 8.Reiman EM, Caselli RJ, Yun LS, et al. Pre-clinical evidence of Alzheimer’s disease in persons homozygous for the epsilon 4 allele for apolipoprotein E. N Engl J Med. 1996;334:752–758. doi: 10.1056/NEJM199603213341202. [DOI] [PubMed] [Google Scholar]
- 9.Johnson KA, Lopera F, Jones K, et al. Pre-senilin-1-associated abnormalities in regional cerebral perfusion. Neurology. 2001;56:1545–1551. doi: 10.1212/wnl.56.11.1545. [DOI] [PubMed] [Google Scholar]
- 10.Kennedy AM, Frackowiak RS, Newman SK, et al. Deficits in cerebral glucose metabolism demonstrated by positron emission tomography in individuals at risk of familial Alzheimer’s disease. Neurosci Lett. 1995;186:17–20. doi: 10.1016/0304-3940(95)11270-7. [DOI] [PubMed] [Google Scholar]
- 11.Johnson KA, Jones K, Holman BL, et al. Preclinical prediction of Alzheimer’s disease using SPECT. Neurology. 1998;50:1563–1571. doi: 10.1212/wnl.50.6.1563. [DOI] [PubMed] [Google Scholar]
- 12.Kogure D, Matsuda H, Ohnishi T, et al. Longitudinal evaluation of early Alzheimer’s disease using brain perfusion SPECT. J Nucl Med. 2000;41:1155–1162. [PubMed] [Google Scholar]
- 13.Johnson KA, Albert MS. Perfusion abnormalities in prodromal AD. Neurobiol Aging. 2000;21:289–292. doi: 10.1016/s0197-4580(00)00137-8. [DOI] [PubMed] [Google Scholar]
- 14.El Fakhri G, Kijewski MF, Johnson KA, et al. MRI-guided SPECT perfusion measures and volumetric MRI in prodromal Alzheimer disease. Arch Neurol. 2003;60:1066–1072. doi: 10.1001/archneur.60.8.1066. [DOI] [PubMed] [Google Scholar]
- 15.Arnaiz E, Jelic V, Almkvist O, et al. Impaired cerebral glucose metabolism and cognitive functioning predict deterioration in mild cognitive impairment. NeuroReport. 2001;12:851–855. doi: 10.1097/00001756-200103260-00045. [DOI] [PubMed] [Google Scholar]
- 16.Chetelat G, Desgranges B, de la Sayette V, Viader F, Eustache F, Baron JC. Mild cognitive impairment: can FDG-PET predict who is to rapidly convert to Alzheimer’s disease? Neurology. 2003;60:1374–1377. doi: 10.1212/01.wnl.0000055847.17752.e6. [DOI] [PubMed] [Google Scholar]
- 17.Huang C, Wahlund LO, Almkvist O, et al. Voxel- and VOI-based analysis of SPECT CBF in relation to clinical and psychological heterogeneity of mild cognitive impairment. Neuroimage. 2003;19:1137–1144. doi: 10.1016/s1053-8119(03)00168-x. [DOI] [PubMed] [Google Scholar]
- 18.Roberts DA, Detre JA, Bolinger L, Insko EK, Leigh JJ. Quantitative magnetic resonance imaging of human brain perfusion at 1.5 T using steady-state inversion of arterial water. Proc Natl Acad Sci USA. 1994;91:33–37. doi: 10.1073/pnas.91.1.33. [DOI] [PMC free article] [PubMed] [Google Scholar]
- 19.Jueptner M, Weiller C. Review: does measurement of regional cerebral blood flow reflect synaptic activity? implications for PET and fMRI. Neuroimage. 1995;2:148–156. doi: 10.1006/nimg.1995.1017. [DOI] [PubMed] [Google Scholar]
- 20.Detre JA, Alsop DC. Perfusion magnetic resonance imaging with continuous arterial spin labeling: methods and clinical applications in the central nervous system. Eur J Radiol. 1999;30:115–124. doi: 10.1016/s0720-048x(99)00050-9. [DOI] [PubMed] [Google Scholar]
- 21.Alsop DC, Detre JA, Grossman M. Assessment of cerebral blood flow in Alzheimer’s disease by spin-labeled magnetic resonance imaging. Ann Neurol. 2000;47:93–100. [PubMed] [Google Scholar]
- 22.Ibanez V, Pietrini P, Alexander GE, et al. Regional glucose metabolic abnormalities are not the result of atrophy in Alzheimer’s disease. Neurology. 1998;50:1585–1593. doi: 10.1212/wnl.50.6.1585. [DOI] [PubMed] [Google Scholar]
- 23.Meltzer CC, Zubieta JK, Brandt J, Tune LE, Mayberg HS, Frost JJ. Regional hypometabolism in Alzheimer’s disease as measured by positron emission tomography after correction for effects of partial volume averaging. Neurology. 1996;47:454–461. doi: 10.1212/wnl.47.2.454. [DOI] [PubMed] [Google Scholar]
- 24.Meltzer CC, Cantwell MN, Greer PJ, et al. Does cerebral blood flow decline in healthy aging? a PET study with partial-volume correction. J Nucl Med. 2000;41:1842–1848. [PubMed] [Google Scholar]
- 25.Matsuda H, Kanetaka H, Ohnishi T, et al. Brain SPET abnormalities in Alzheimer’s disease before and after atrophy correction. Eur J Nucl Med Mol Imaging. 2002;29:1502–1505. doi: 10.1007/s00259-002-0930-2. [DOI] [PubMed] [Google Scholar]
- 26.Folstein MF, Folstein SE, McHugh PR. “Mini-mental state”: a practical method for grading the cognitive state of patients for the clinician. J Psychiatr Res. 1975;12:189–198. doi: 10.1016/0022-3956(75)90026-6. [DOI] [PubMed] [Google Scholar]
- 27.Delis DC, Kramer JH, Kaplan E, Ober BA. California Verbal Learning Test (CVLT) San Antonio, Tex: Psychological Corporation; 2000. [Google Scholar]
- 28.Lezak MD. Neuropsychological assessment. 3. New York, NY: Oxford University Press; 1995. [Google Scholar]
- 29.Morris JC. The Clinical Dementia Rating (CDR): current version and scoring rules. Neurology. 1993;43:2412–2414. doi: 10.1212/wnl.43.11.2412-a. [DOI] [PubMed] [Google Scholar]
- 30.Pfeffer RI, Kurosaki TT, Harrah CH, Jr, Chance JM, Filos S. Measurement of functional activities in older adults in the community. J Gerontol. 1982;37:323–329. doi: 10.1093/geronj/37.3.323. [DOI] [PubMed] [Google Scholar]
- 31.Criteria for the clinical diagnosis of Alzheimer’s disease: excerpts from the NINCDS-ADRDA Work Group report. J Am Geriatr Soc. 1985;33:2–3. doi: 10.1111/j.1532-5415.1985.tb02850.x. [DOI] [PubMed] [Google Scholar]
- 32.Petersen RC, Smith GE, Waring SC, Ivnik RJ, Tangalos EG, Kokmen E. Mild cognitive impairment: clinical characterization and outcome. Arch Neurol. 1999;56:303–308. doi: 10.1001/archneur.56.3.303. [DOI] [PubMed] [Google Scholar]
- 33.Jahng GH, Zhu XP, Matson GB, Weiner MW, Schuff N. Improved perfusion-weighted MRI by a novel double inversion with proximal labeling of both tagged and control acquisitions. Magn Reson Med. 2003;49:307–314. doi: 10.1002/mrm.10339. [DOI] [PMC free article] [PubMed] [Google Scholar]
- 34.Luh WM, Wong EC, Bandettini PA, Hyde JS. QUIPSS II with thin-slice TI1 periodic saturation: a method for improving accuracy of quantitative perfusion imaging using pulsed arterial spin labeling. Magn Reson Med. 1999;41:1246–1254. doi: 10.1002/(sici)1522-2594(199906)41:6<1246::aid-mrm22>3.0.co;2-n. [DOI] [PubMed] [Google Scholar]
- 35.Good CD, Johnsrude IS, Ashburner J, Henson RN, Friston KJ, Frackowiak RS. A voxel-based morphometric study of aging in 465 normal adult human brains. Neuroimage. 2001;14:21–36. doi: 10.1006/nimg.2001.0786. [DOI] [PubMed] [Google Scholar]
- 36.Meltzer CC, Leal JP, Mayberg HS, Wagner HN, Jr, Frost JJ. Correction of PET data for partial volume effects in human cerebral cortex by MR imaging. J Comput Assist Tomogr. 1990;14:561–570. doi: 10.1097/00004728-199007000-00011. [DOI] [PubMed] [Google Scholar]
- 37.Muller-Gartner HW, Links JM, Prince JL, et al. Measurement of radiotracer concentration in brain gray matter using positron emission tomography: MRI-based correction for partial volume effects. J Cereb Blood Flow Metab. 1992;12:571–583. doi: 10.1038/jcbfm.1992.81. [DOI] [PubMed] [Google Scholar]
- 38.Salmond CH, Ashburner J, Vargha-Khadem F, Gadian DG, Friston KJ. Detecting bilateral abnormalities with voxel-based morphometry. Hum Brain Mapp. 2000;11:223–232. doi: 10.1002/1097-0193(200011)11:3<223::AID-HBM80>3.0.CO;2-F. [DOI] [PMC free article] [PubMed] [Google Scholar]
- 39.Bradley KM, O’Sullivan VT, Soper ND, et al. Cerebral perfusion SPECT correlated with Braak pathological stage in Alzheimer’s disease. Brain. 2002;125:1772–1781. doi: 10.1093/brain/awf185. [DOI] [PubMed] [Google Scholar]
- 40.Lee YC, Liu RS, Liao YC, et al. Statistical parametric mapping of brain SPECT perfusion abnormalities in patients with Alzheimer’s disease. Eur Neurol. 2003;49:142–145. doi: 10.1159/000069086. [DOI] [PubMed] [Google Scholar]
- 41.Matsuda H, Kitayama N, Ohnishi T, et al. Longitudinal evaluation of both morphologic and functional changes in the same individuals with Alzheimer’s disease. J Nucl Med. 2002;43:304–311. [PubMed] [Google Scholar]
- 42.Meguro K, LeMestric C, Landeau B, Desgranges B, Eustache F, Baron JC. Relations between hypometabolism in the posterior association neocortex and hippocampal atrophy in Alzheimer’s disease: a PET/ MRI correlative study. J Neurol Neurosurg Psychiatry. 2001;71:315–321. doi: 10.1136/jnnp.71.3.315. [DOI] [PMC free article] [PubMed] [Google Scholar]
- 43.Varma AR, Adams W, Lloyd JJ, et al. Diagnostic patterns of regional atrophy on MRI and regional cerebral blood flow change on SPECT in young onset patients with Alzheimer’s disease, frontotemporal dementia and vascular dementia. Acta Neurol Scand. 2002;105:261–269. doi: 10.1034/j.1600-0404.2002.1o148.x. [DOI] [PubMed] [Google Scholar]
- 44.Chetelat G, Desgranges B, de la Sayette V, et al. Dissociating atrophy and hypometabolism impact on episodic memory in mild cognitive impairment. Brain. 2003;126:1955–1967. doi: 10.1093/brain/awg196. [DOI] [PubMed] [Google Scholar]
- 45.Wolf H, Jelic V, Gertz HJ, Nordberg A, Julin P, Wahlund LO. A critical discussion of the role of neuroimaging in mild cognitive impairment. Acta Neurol Scand Suppl. 2003;179:52–76. doi: 10.1034/j.1600-0404.107.s179.10.x. [DOI] [PubMed] [Google Scholar]