

Abstract
Numerous transcription factors have been identified which have profound effects on developing neurons. A fundamental problem is to identify genes downstream of these factors and order them in developmental pathways. We have previously identified 85 genes with changed expression in the trigeminal ganglia of mice lacking Brn3a, a transcription factor encoded by the Pou4f1 gene. Here we use locus-wide chromatin immunoprecipitation in embryonic trigeminal neurons to show that Brn3a is a direct repressor of two of these downstream genes, NeuroD1 and NeuroD4, and also directly modulates its own expression. Comparison of Brn3a binding to the Pou4f1 locus in vitro and in vivo reveals that not all high affinity sites are occupied, and several Brn3a binding sites identified in the promoters of genes that are silent in sensory ganglia are also not occupied in vivo. Site occupancy by Brn3a can be correlated with evolutionary conservation of the genomic regions containing the recognition sites and also with histone modifications found in regions of chromatin active in transcription and gene regulation, suggesting that Brn3a binding is highly context-dependent.
Keywords: Brn3, Brn3a, Pou4f1, NeuroD1, NeuroD4, POU-domain, chromatin immunoprecipitation, trigeminal ganglion
INTRODUCTION
The development of any organ system requires the coordinated regulation of gene expression to generate increasingly specialized cell types. Tissue-specific gene expression is regulated primarily at the transcriptional level, by DNA-binding transcription factors that are expressed at key decision points in developmental processes. No tissue presents a more complex problem in the developmental regulation of gene expression than the vertebrate nervous system, where transcription factors of several structural families have been shown to have profound effects on the development of the spinal cord, brainstem, forebrain, retina, and peripheral sensory and autonomic ganglia (Helms and Johnson, 2003; Marquardt, 2003; Shirasaki and Pfaff, 2002; Zaki et al., 2003). In each of these areas, loss of regulatory function may lead to the agenesis of a class of neurons, respecification of neuronal phenotypes, aberrant cell migration or axon growth, or abnormal cell death.
Although the importance of neuron-specific transcriptional regulation is clear, in most cases the downstream targets of transcription factors with established roles in neural development remain unknown. Recent studies using expression arrays have been successful in defining multiple regulatory targets for a few of these factors in the developing retina, cerebellum, and sensory system (Eng et al., 2004; Gold et al., 2003; Livesey et al., 2000; Mu et al., 2004). However, in each of these studies several of the regulated genes also encode transcription factors, leading to significant uncertainty about which of the downstream genes are directly regulated and which are secondary targets.
The direct target genes of a developmental transcription factor are expected to contain binding sites for that factor within cis-acting regulatory domains, typically but not necessarily located in upstream or intronic sequences near the transcriptional start site of that gene. However, the short recognition sequences of monomeric or dimeric transcription factors occur frequently in the genome, and are not in themselves sufficient to restrict transcriptional regulation to a small number of tissue-specific genes. Therefore some mechanism for the further restriction of transcriptional activity in vivo is required. Numerous examples are known in which transcription factors act at their recognition sites only when they occur in a specific context, and/or in the presence of other cell-specific DNA-binding factors, a concept which has been referred to as a “combinatorial code” for cell-specific transcription. However, at present there are no general predictive algorithms for recognizing functional binding sites in vertebrates, and these relationships must be determined empirically.
We have been engaged in studies of the Pou4 or “Brn3” class of transcription factors, consisting in vertebrates of Brn3a (Pou4f1, Brn3.0), Brn3b (Pou4f2, Brn3.2), and Brn3c (Pou4f3, Brn3.1). Brn3a is expressed throughout the peripheral sensory nervous system and at multiple levels of the CNS, and targeted disruption of the Pou4f1 locus results in excessive apoptosis in several regions of the embryonic brain, marked defects in sensory axon growth, and neonatal lethality (Eng et al., 2001; McEvilly et al., 1996; Xiang et al., 1996). Brn3b and Brn3c are more restricted in their expression, and null mutations of these genes result in viable mice with more specific defects in the development of the retina and the inner ear, respectively (Erkman et al., 2000; Gan et al., 1996; Xiang et al., 1997).
The POU transcription factor class is characterized by a bipartite DNA binding domain, consisting of a POU-specific domain and a POU-homeodomain, which together recognize an extended DNA site (Phillips and Luisi, 2000). Biochemical and transfection studies have shown that the vertebrate and invertebrate members of the Pou4-subclass bind to a consensus sequence consisting of ATAATTAAT and minor variants thereof (Gruber et al., 1997; Rhee et al., 1998). Genetic studies have demonstrated that Brn3a regulates its own expression in sensory neurons via a cluster of such sites residing approximately 5.5kb upstream from the Pou4f1 transcriptional start site (Trieu et al., 2003; Trieu et al., 1999).
Two recent studies have begun to ascertain the transcriptional targets of the Pou4 factors in the developing nervous system, using expression arrays with partial genomic coverage to assay global gene expression in the sensory ganglia and retina of mice lacking Brn3a and Brn3b, respectively (Eng et al., 2004; Mu et al., 2004). In both cases, the majority of regulated transcripts belong to gene families with known or potential roles in neurodevelopment, although only a few shared targets were identified. Extrapolating these results to the entire transcriptome suggests that the Pou4 factors regulate on the order of 102 downstream transcripts in a single tissue type at a given developmental stage, including both direct and indirect targets.
In the present study we use locus-wide, real-time chromatin immunoprecipitation assays in embryonic sensory neurons to better understand the relationship between Brn3a and its transcriptional targets. These experiments show that Brn3a is a direct repressor of the bHLH genes NeuroD4 (Math3) and NeuroD1, via consensus Brn3a binding sites. Brn3a also interacts directly with its own autoregulatory enhancer via relatively weak sites. In all three loci, most occupied Brn3a recognition sites occur in regions of local conservation between the mouse and human genomes. Examination of histone H3 acetylation and H3-lys4 dimethylation across the target gene loci reveals that site occupancy by Brn3a also correlates with these markers of transcriptionally active chromatin. Brn3a binding sites in the promoters of genes which are not transcribed in sensory ganglia and are de-acetylated in vivo appear to be generally unoccupied by Brn3a. Together these findings begin to illuminate the genomic context in which Brn3a regulates its downstream targets in sensory neurons.
MATERIALS AND METHODS
Bioinformatic analysis
Interspecies conservation was determined by comparing mouse and human genomic sequences using the pairwise LAGAN function from the LAGAN Alignment Toolkit website (Brudno et al., 2003). Alignments were visualized using VISTA software (Mayor et al., 2000), and the percent conservation between the mouse and human sequences was mapped using a 100 base pair moving window.
Brn3a Chromatin Immunoprecipitation
Embryos for ChIP assays were generated from timed matings of ICR mice and staged according to the method of Theiler (Theiler, 1972). Trigeminal ganglia were dissected from E13.5 embryos and fixed in 4% paraformaldehyde for 30 minutes, then quenched with 150 mM glycine. The fixed tissue was washed with PBS and stored at −80°C until analysis.
Selection of Brn3a complexes from embryonic sensory ganglia was performed by a modification of a widely used procedure (Luo et al., 1998). For each analysis, 60 fixed ganglia were pooled and suspended in lysis buffer containing 50 mM Tris-HCl, pH 8.1, 1% Triton-X-100, 10 mM EDTA, 1 mM AEBSF and a proprietary protease inhibitor mix (1X Complete Mini, Roche, used according to instructions). An oligonucleotide containing a high affinity Brn3a binding site was added to a final concentration of 0.5 μM to suppress any artifactual Brn3a-chromatin interactions which may form during the homogenization process. The oligonucleotides GATCTCTCCTGCATAATTAATTACCCCCGGAT and GATCCGGGGGTAATTAATTATGCAGGAGAGAT were annealed to form the double stranded oligonucleotide competitor which contains the previously described consensus Brn3a binding site ATAATTAAT (Gruber et al., 1997). Ganglia were incubated in lysis buffer at 4º on a rotating platform for 10 minutes. Chromatin was then fragmented to an average size of 500 base pairs by sonication, and insoluble cellular debris was removed by centrifugation. The supernatant containing fragmented chromatin was diluted in 15 mM Tris-HCl, pH 8.1 with 150 mM NaCl, 1 mM EDTA, 1% Triton-X-100, and protease inhibitor mix. An unselected (“input”) sample of 10% of the total homogenate was removed prior to antibody selection.
Selection of Brn3a protein-containing complexes was performed using 50 μL of sheep anti-rabbit IgG magnetic beads (Dynal M-280), pre-loaded with 10 μg of rabbit anti-Brn3a antibody. In order to reduce non-specific background, the chromatin sample was pre-cleared using the magnetic beads with the secondary antibody alone. The sample was then incubated overnight with Brn3a antibody-coupled beads to select the Brn3a protein-containing chromatin complexes. The selected complexes were washed with 20 mM Tris-HCl, pH 8.1 with 150 mM NaCl, 2 mM EDTA, and 1% Triton-X-100, followed by two washes with 10 mM Tris-HCl, pH 8.1 with 0.25 M LiCl, 1% IGEPAL, 1% Deoxycholate, and 1 mM EDTA. The final wash was performed in 20 mM Tris-HCl, pH 8.1 with 150 mM NaCl and 2 mM EDTA. Each wash was performed for 5 minutes at room temperature. DNA was extracted from both the antibody-chromatin complexes and input sample by heating in 0.1 M NaHCO3 with 200 mM NaCl and 1% SDS at 65º for 4 hours with constant shaking. The input and selected samples were then digested with proteinase K, extracted with phenol/chloroform, and precipitated with ethanol.
Histone H3 Chromatin Immunoprecipitation
Modified histone H3 ChIP experiments were performed using rabbit anti-acetylated histone H3 antibody (Upstate Biotechnology, Inc., catalog no. 06–599), which recognizes histone H3 acetylated at lys9 and lys14, and rabbit anti-dimethyl-histone H3-Lys4 (H3-K4, catalog no. 07–030). The anti-Brn3a ChIP protocol described above was slightly altered for use with antibodies against modified histones. For each selection, 50 μg of anti-histone antibody was coupled to 250 μL of anti-rabbit IgG magnetic beads, and the lysis buffer contained 50 mM Tris-HCl, pH 8.1 with 10 mM EDTA and 1% SDS. The selected complexes were washed for five minutes at room temperature with each of the following solutions: 20 mM Tris-HCl, pH 8.1 with 150 mM NaCl, 2 mM EDTA, 0.1 % SDS, and 1% Triton-X-100; 20 mM Tris-HCl, pH 8.1 with 500 mM NaCl, 2 mM EDTA, 0.1% SDS, and 1% Triton-X-100; 10 mM Tris-HCl, pH 8.1 with 1 mM EDTA, 0.25 M LiCl, 1% NP-40, and 1% deoxycholate. Salt and detergent were removed by washing twice with TE, pH 8.
Real-time locus-wide PCR analysis
Chromatin fragments recovered from the immunoprecipitated and input samples were then assayed by real-time PCR using an ABI 7300 thermocycler and SYBR Green fluorimetric detection. Selected and unselected samples were run in parallel in a 96-well plate format, and the enrichment of immunoprecipitated chromatin fragments was assayed by the cycle-threshold difference method (Livak and Schmittgen, 2001). To screen an entire gene locus, oligonucleotide pairs were designed at 500–1000bp intervals throughout the region. Because the selected chromatin was sheared to an average size of approximately 500bp, it was not necessary for the ChIP oligonucleotide pairs to encompass the actual binding site to give a positive signal, and as expected the ChIP signal decayed over about 1kb in either direction from the site. When enrichment was seen in a region with the screening set of oligonucleotides, further independent oligonucleotide pairs were designed in the interval to confirm the result in subsequent assays.
Real-time PCR signals were measured using the “cycle threshold”, or Ct parameter, which is the number of cycles required for the amplification product to reach an arbitrary level of fluorescence intensity (threshold). The threshold is set in the log-linear range of the product generation curve, assuring that the quantitation of the PCR products occurs in the logarithmic phase of amplification. A further advantage of the method is that the small amplicons used for real-time PCR amplify much more reliably than products which are designed to be quantitated by gel electrophoresis. The Ct value is related logarithmically to the initial abundance of the target sequence in the sample in that more abundant targets will reach the threshold faster, and yield a lower Ct value. Because product formation approximately doubles with each cycle in the linear range of amplification, a Ct difference of one cycle represents a two-fold difference in starting template.
For each PCR amplicon, signals from the unselected (“input”) and antibody-selected DNA samples were then compared using the cycle threshold difference (ΔCt) method. A ΔCt value was calculated for each amplicon by subtracting the Ctselected from the Ctinput signal (ΔCt=Ctinput − Ctselected). A significant advantage of this method is that for each primer pair, a selected sample is compared directly to its unselected control, which differs only by the antibody selection process. Potentially confounding factors such as small differences in the PCR amplification efficiency of different primer pairs are eliminated in this comparison.
The ΔCt assays for each pool of anti-Brn3a selected material were normalized to a baseline (1-fold enrichment) determined using the average ΔCt value (ΔCtcontrol) for ten primer pairs spanning the Alb-1 (albumin) gene, which was chosen for this purpose because is not transcribed in the nervous system. Little variation was observed across flanking, promoter, intronic and translated sequences in ChIP selection assays of the Alb-1 locus (Supplementary Information, Figure S1A). Anti-histone selected assays were normalized to the average ΔCt value of two amplicons in the Alb-1 promoter region which showed enrichment values representative of the whole locus (Figure S1B). A second method of normalizing the ΔCt values, using primer pairs to promoter regions of Mapt (microtubule-associated protein tau) and Eno2 (neuron specific enolase), which exhibit tissue specific expression in the nervous system, and Gapdh (glyceraldehyde-3-phosphate dehydrogenase), which is expressed ubiquitously, gave very similar results.
Fold enrichment values for target sequences bound by the selecting antibodies, corresponding to the y-axis of the locus-ChIP plots, was calculated using the following equation: E=2^(ΔCt-ΔCtcontrol). The statistical significance (p-value) for ChIP selection at a given Brn3a binding site was calculated using fold enrichment values for all primer pairs located within 500 base pairs of the binding site, compared to the enrichment values for the Alb-1 locus, using two-sample, unequal variance t-tests. Very similar results were obtained when the peaks of ChIP enrichment were compared to the intergenic baseline flanking the same gene.
Electrophoretic Mobility Shift Assay (EMSA)
Electrophoretic mobility shift assays were performed using probes generated by PCR using radiolabeled primers, or with 32 base pair double-stranded oligonucleotides containing Brn3a recognition sites (Table S2), as previously described (Gruber et al., 1997; Trieu et al., 1999). Full-coding Brn3a protein was expressed in sf9 cells using a baculovirus expression system. Use of alternate translation initiation sites resulted in some size heterogeneity of Brn3a/DNA complexes in EMSA assays, but did not affect the C-terminal DNA-binding domain of Brn3a.
Dissociation rates for Brn3a-DNA complexes were estimated by EMSA, providing a rapid method for comparing the stability of Brn3a association with a large number of binding sites. EMSAs were performed a 50μl volume containing 20 mM Tris (pH 8.0), 100 mM KCl, 5 mM MgCl2, 0.2 mM EDTA, 100mu;g/ml of poly(dI-dC), 100 mu;g/ml BSA, 10% glycerol, and 1 mM dithiothreitol. In these assays, Brn3a protein was incubated with a radiolabeled DNA probe in EMSA binding cocktail for 20 minutes at 20. Then, at 5 or 20 minutes before the start of electrophoresis, 1 X 10⁻¹¹ mol of an unlabeled high affinity Brn3a oligonucleotide competitor, containing the consensus Brn3a binding site ATAATTAAT, was added to the binding assay (consensus, Table S2, Gruber et al., 1997). The relative quantities of Brn3a complexes remaining after 5 and 20 minute incubation with the oligonucleotide competitor were determined from scanned autoradiograms using Image J software. The half-lives of Brn3a complexes were determined based on first order kinetics.
Complex stability screening
In order to identify the most stable (highest affinity) Brn3a binding sites within a large genomic region encompassing the Pou4f1 locus, we adapted a protocol previously used to identify the Brn3a autoregulatory binding site cluster (Trieu et al., 1999). A BAC clone containing 188 kb of mouse genomic sequence surrounding the Pou4f1 gene (Clone ID: RP23_360a14, BACPAC Resources Center) was sheared to an average size of 500 base pairs by sonication, and the ends of the DNA fragments were repaired for A–T cloning using mung bean nuclease and the addition of single 3′-dA residues using a commercial tailing kit (Novagen).
Selection of the sheared, tailed BAC DNA was performed using 15μg of rabbit anti-Brn3a antibody pre-incubated with 50μL paramagnetic beads conjugated to sheep anti-rabbit IgG (Dynal M-280). The coupled beads were then incubated with 20μL of sf9 cell lysate containing full-coding Brn3a protein (described above), rinsed, and incubated with 10mu;g of sheared BAC DNA. Binding reactions were performed in EMSA buffer as described above, except dI/dC was omitted. Following the initial binding reaction, the beads were resuspended in binding buffer containing 2mu;M oligonucleotide competitor containing a Brn3a consensus binding site, and incubated for 10 minutes before magnetic separation in order to block binding of unstable (low-affinity) Brn3a-DNA complexes. The beads were immediately washed two times with binding buffer to remove the oligonucleotide competitor, and the remaining bound DNA fragments were eluted from the paramagnetic beads by incubation in TE buffer containing 1% SDS and 20mu;g glycogen at 60ºC for 15 minutes. DNA fragments were recovered by phenol/chloroform extraction followed by ethanol precipitation.
Selected BAC fragments were ligated into pSTBlue-1, and recombinant plasmids were used to transform E. coli using the Acceptor Vector Kit (Novagen). Positive colonies were isolated using blue/white selection and plasmid DNA was prepared for sequencing. Insert sequences were aligned with the BAC sequence using BLAST to determine the location of the selected fragments containing Brn3a binding sites.
In a prior study using CoSS screening (Trieu et al., 1999), we identified clustered Brn3a binding sites at −5633 relative to the start of transcription as the highest affinity sites within 11kb of the Pou4f1 transcription start site. These sites, which deviate slightly from the optimal consensus, were not selected by the more stringent protocol described here. The principal difference in the method used in the prior study was the use of a Brn3a POU domain glutathione-S-transferase (GST) fusion protein for the selection process. Fusion to GST stabilizes the interaction between the POU domain and DNA, resulting in the retention of lower affinity complexes (Rhee et al., 2001). In the current study, full-coding Brn3a without a GST moiety was employed.
RESULTS
Brn3a is a direct repressor of bHLH transcription factors
In the absence of Brn3a, sensory neurons exhibit abnormal axon growth, fail to correctly innervate their target fields, and undergo abnormal cell death in late gestation. In the trigeminal ganglion these defects are accompanied by significant changes in the expression of multiple genes, including both increased and decreased transcripts (Eng et al., 2004). These changes in gene expression may be either mediated directly by Brn3a, or indirectly by several other transcription factors which exhibit altered expression in Brn3a knockout mice.
In order to better understand the relationship of Brn3a DNA binding to transcriptional regulation, we employed chromatin immunoprecipitation (ChIP) in embryonic sensory neurons to map the direct sites of Brn3a interaction with selected downstream genes. For this analysis, we chose microdissected embryonic day 13.5 (E13.5) trigeminal ganglia because at this stage the developing sensory neurons are relatively homogeneous with respect to the expression of Brn3a. At E13.5, a majority of cells in the trigeminal express Brn3a, and relatively few express the glial marker Sox10 (Figure 1), while at E16.5 and later stages, differentiating glia, which may contribute to background in this assay but not to Brn3a ChIP signal, are far more numerous (data not shown).
Figure 1. Cellular expression of Brn3a in the embryonic trigeminal ganglion. Guinea-pig anti-Sox10 (Maka et al., 2005) and rabbit anti-Brn3a were used to perform immunofluorescence as previously described (Fedtsova and Turner, 1995).
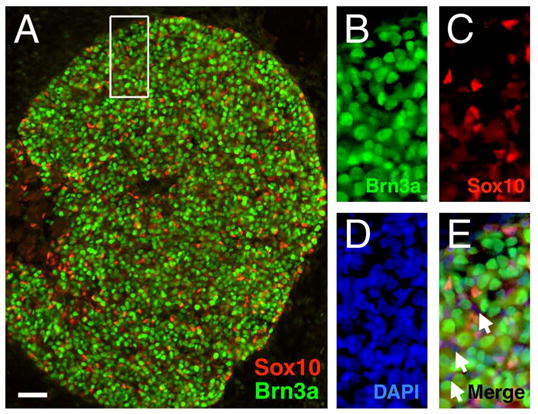
(A) In the E13.5 trigeminal, the majority of cells are Brn3a-expressing neurons. The relatively small population of differentiating glia present at this stage are identified by small nuclei and the expression of Sox10.
(B–E) An enlarged view shows mutually exclusive cellular expression of Brn3a and Sox10 (boxed area in A). Occasional cells express neither antigen (arrows, E), and may represent nucleated blood cells.
For screening assays of Brn3a binding to target gene loci, real-time PCR primer sets were designed at intervals of 0.5–1kb spanning a region of approximately 40kb for each gene, a strategy we refer to as locus-wide chromatin immunoprecipitation (locus-ChIP). To verify the results of the initial locus-ChIP screens, multiple primer pairs were subsequently designed to confirm Brn3a binding at specific sites. For each target gene, the region examined spans the entire transcription unit, plus extended 5′- and 3′-flanking regions. The rationale for screening entire loci in this manner was two-fold. First, although the Brn3a consensus binding sequence has been determined in vitro, the extent to which the site may deviate from the consensus and still permit binding in vivo is unknown, and the locus-ChIP method is unbiased with respect to the sequence of the occupied site. Second, enhancer elements are often located at a considerable distance from the transcription units they regulate, and we did not want to arbitrarily restrict the analysis to the region immediately adjacent to the transcription start site.
Prior work has shown that three bHLH transcription factors exhibit significantly increased expression in the trigeminal ganglia of mid-gestation Pou4f1 knockout embryos, including NeuroD4 (Math3, 8-fold increase) NeuroD1 (3-fold), and Msc (Musculin, MyoR, 7-fold, Eng et al., 2004). For this reason, the locus-ChIP method was first applied to these gene loci, using pools of 60 microdissected E13.5 trigeminal ganglia as starting material for the assay. Figure 2 shows the result of locus-ChIP screening of the NeuroD4 locus, revealing two positions in the locus occupied by Brn3a in vivo, in the 5′-flanking region at −12,996 relative to the start of transcription, and to a region within the first intron at +4,410. Sequence analysis of the regions identified by ChIP confirmed the presence of Brn3a consensus sites at both locations. Kinetic electrophoretic mobility shift assays (EMSAs, Materials and Methods) were then performed to demonstrate that Brn3a forms stable complexes with each of these sites in vitro (Figure 2B).
Figure 2. Brn3a is a direct regulator of the NeuroD4 gene in the embryonic trigeminal ganglion.
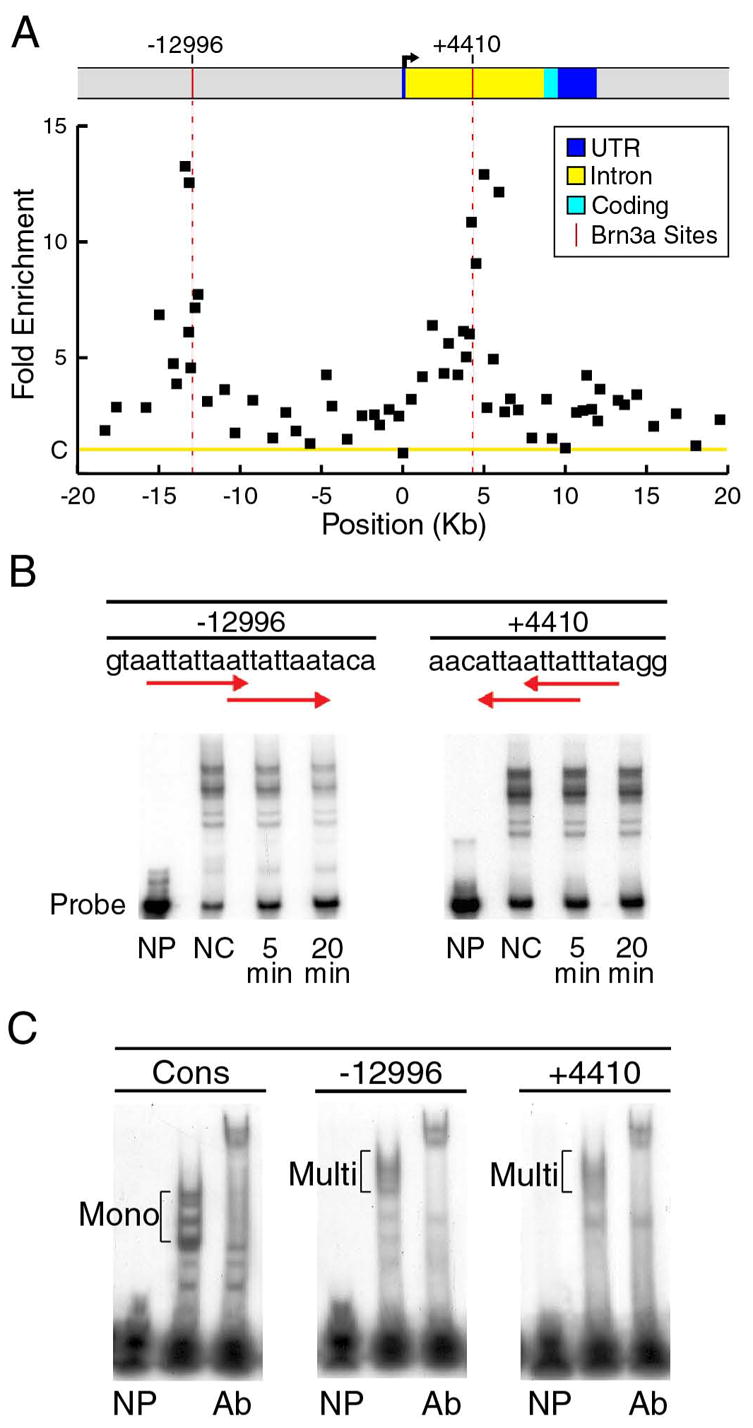
(A) ChIP analysis of Brn3a binding to the NeuroD4 locus in E13.5 ganglia. Sixty-three primer pairs were used in real-time PCR assays to screen the locus from −20kb to +20kb relative to the transcriptional start site (Table S3). The fold enrichment of the selected versus unselected chromatin was normalized to a control value of one (C on Y-axis), based on the signal the Alb-1 locus (Materials and Methods). The average enrichment from three selection experiments using independent pools of ganglia is shown for each primer pair. Sequence analysis of the regions of maximum ChIP selection revealed consensus Brn3a binding sites at −12996 and +4410 relative to the start of transcription (vertical red lines). Differences between the ChIP selection peaks at −12996 and +4410 and Alb-1 locus control values were highly significant (p=0.003 and p=0.002, respectively, Materials and Methods).
(B) Kinetic EMSA assays were used to determine the relative stability of Brn3a binding to the sites identified by ChIP. In these assays, Brn3a protein was allowed to bind radiolabeled oligonucleotides, and the complexes were then incubated in the presence of an excess of specific competitor oligonucleotide (Materials and Methods). The amount of complex remaining after 5 and 20 minutes was used to determine the half-life of each complex. The relative first-order dissociation rates of the Brn3a-DNA complexes observed in these assays allow a rapid approximate comparison of relative site affinity (Gruber et al., 1997; Trieu et al., 1999). Multiple complexes were observed due to size heterogeneity of the expressed protein and multimeric binding to overlapping recognition sites (arrows). NP, no Brn3a protein; NC, no competitor; 5 min, 5 minute incubation with competitor, 20 min, 20 minute incubation with competitor.
(C) Oligonucleotide probes containing a previously determined optimal monomeric consensus binding site (Cons, Gruber et al., 1997) and the Brn3a recognition sequences in the NeuroD4 locus were used to demonstrate the interaction of multimeric binding of Brn3a to the NeuroD4 sites. Supershifts with Brn3a antibody (Ab) demonstrate that all major complexes contain Brn3a. NP, no Brn3a protein; B3, Brn3a protein containing cell lysate added; Ab, cell lysate plus Brn3a antiserum; Mono, monomeric Brn3a complexes; Multi, multimeric Brn3a complexes.
Each of the binding sites identified in the NeuroD4 locus contains a partial duplication of the Brn3a consensus sequence, indicating the possibility of multimeric Brn3a binding. In order to assay the stoichiometry of Brn3a association with each site, we compared the EMSA complexes formed by Brn3a bound to the NeuroD4 sites to those formed with a consensus monomeric Brn3a binding sequence (b3s1, Gruber et al., 1997; Rhee et al., 1998). Each of the NeuroD4 binding sites forms a highly stable complex with multiple Brn3a molecules (Figure 2C), consistent with prior evidence that Brn3a exhibits cooperative homodimerization on extended sites (Rhee et al., 1998). The identification of in vivo Brn3a binding sites at the NeuroD4 locus, in conjunction with increased NeuroD4 expression in the absence of Brn3a, demonstrates that Brn3a is a direct repressor of NeuroD4 expression in the developing trigeminal ganglion.
Locus-ChIP screening of the NeuroD1 locus revealed a broad area of enrichment beginning approximately 7 kb upstream from the start of transcription, and extending through the end of the transcribed region of the gene (Figure 3A). Five sites were identified in NeuroD1 5′-flanking region which contained a Brn3a consensus or variant consensus site. The maximum enrichment occurred in the 3′UTR of the NeuroD1 gene, encompassing a Brn3a consensus site at position +2973. In contrast to NeuroD4 and NeuroD1, a locus-ChIP survey of the Msc locus from −20kb to +20kb did not reveal any occupied Brn3a binding sites (Figure 3B). Thus it is likely that increased expression of Musculin in the trigeminal ganglia of Pou4f1 knockout mice is mediated by an indirect mechanism, although is also possible that Brn3a may regulate the expression of Musculin by direct interaction with binding sites outside the region examined.
Figure 3. ChIP analysis of Brn3a binding to the NeuroD1 and Msc loci in E13.5 trigeminal ganglia.
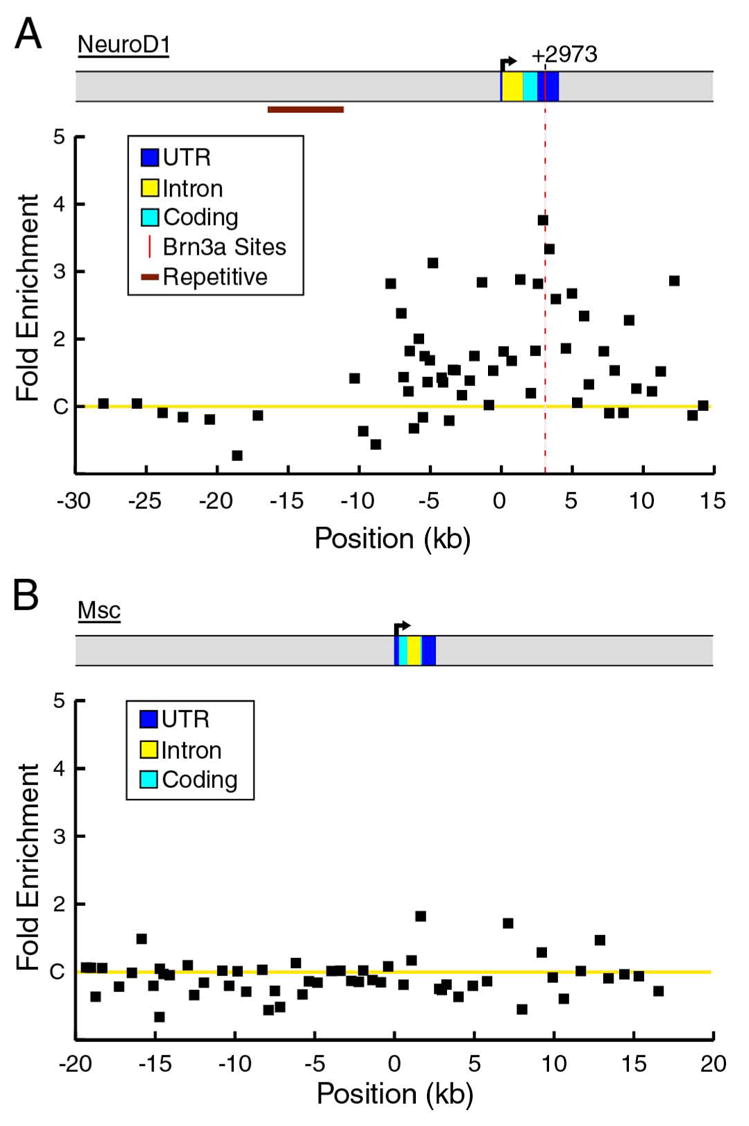
(A) In vivo binding of Brn3a to the NeuroD1 locus. A peak of enrichment in a region of the 3′ UTR conserved between the mouse and human genomes includes a Brn3a consensus site at +2973 (difference from controls, p=0.008). The region extending from −16 kb to −11 kb consists of repetitive sequence and was not included in the analysis. ChIP primer pairs used for the NeuroD1 locus appear in Table S4.
(B) Brn3a ChIP analysis of the Msc locus from −20kb to +20 kb relative to the start of transcription reveals no significant in vivo binding of Brn3a. Average enrichment values from three independent ChIP assays are shown for both loci. Primer pairs used in ChIP assays of the Msc locus appear in Table S5.
Direct autoregulation by Brn3a
In prior work, we have shown genetic evidence that Brn3a attenuates its own expression by autoregulation, mediated by a cluster of Brn3a binding sites ~5kb upstream from the start of transcription (Trieu et al., 2003; Trieu et al., 1999). These binding sites reside within a well-characterized Pou4f1 enhancer which regulates the expression of Brn3a in the sensory PNS (Eng et al., 2001), but the sequences targeting Brn3a expression to the CNS have not been identified. To screen for additional Brn3a binding sites in the extended Pou4f1 locus that may mediate autoregulation in the CNS, we employed an in vitro immunoprecipitation method termed complex stability screening (CoSS, Trieu et al., 1999). To apply the CoSS method to the Pou4f1 locus, a BAC clone containing 188kb of genomic DNA encompassing the Pou4f1 gene and surrounding sequences was sheared into 200–500 base pair fragments by sonication, then incubated with recombinant Brn3a protein. Following this binding reaction, the Brn3a-DNA complexes were incubated briefly in the presence of excess competitor oligonucleotide containing a consensus Brn3a site, followed by separation of the remaining stable complexes using an immobilized anti-Brn3a antibody (Materials and Methods). Under these conditions, only fragments containing the highest affinity binding sites in the BAC clone are retained.
The CoSS-selected DNA fragments were ligated into a cloning vector for sequencing, and approximately 130 cloned fragments were mapped onto the complete sequence of the extended Pou4f1 locus (Figure 4A). In nearly every case in which multiple selected fragments mapped to the same region of the locus, a Brn3a consensus binding site was identified in the region common to the fragments. However, this high-stringency screen did not select the autoregulatory sites approximately 5kb upstream from the Pou4f1 transcriptional start site identified by lower stringency screening and genetic analysis in prior studies (Trieu et al., 2003; Trieu et al., 1999). To resolve this possible divergence in results, EMSAs were performed on the Brn3a sites identified in both screens in order to obtain a more quantitative estimate of the in vitro stability of Brn3a bound to each site (Figure 4B). These results confirm the presence of multiple stable Brn3a binding sites in the extended Pou4f1 locus, and also show that the sites within the Pou4f1autoregulatory region (−5,633) have sub-optimal binding, suggesting that the in vitro affinity of Brn3a for its cognate sites may not be the best predictor of biological function.
Figure 4. Brn3a binding to the Pou4f1 locus in vitro and in embryonic trigeminal ganglia.
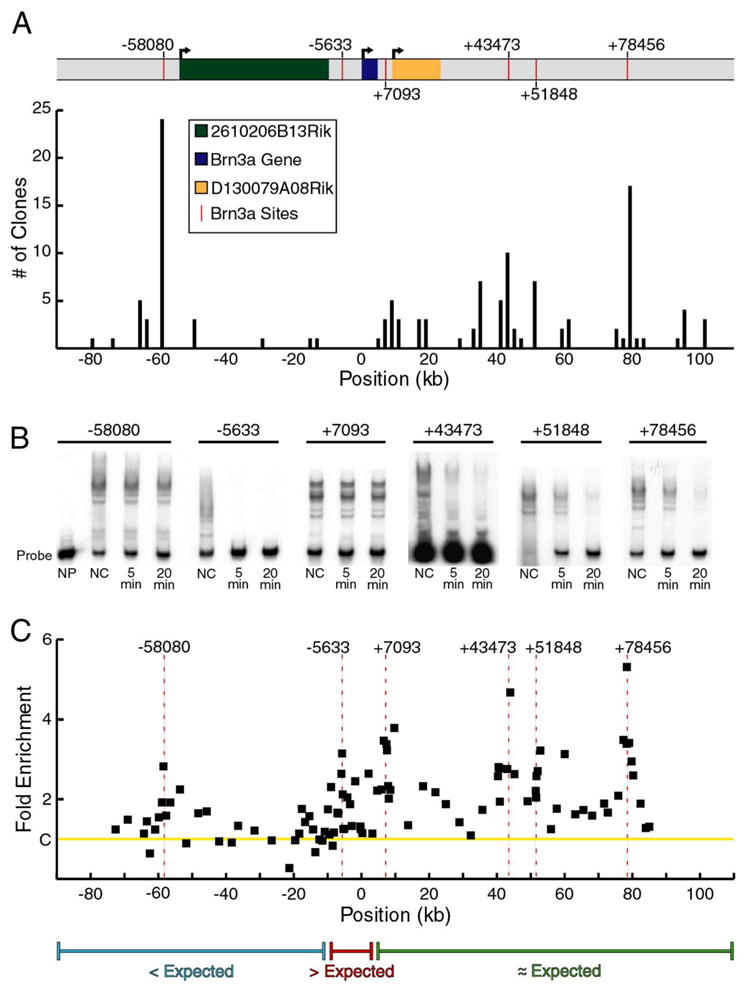
(A) Complex stability screening of a 188 kb BAC encompassing the Pou4f1 locus. BAC DNA was sheared by sonication and selected using recombinant Brn3a protein (Materials and Methods). Fragments were ligated into a cloning vector, and 128 independent clones were sequenced. The histogram indicates the number of fragments identified within each 2000 base pair interval of the BAC. In nearly every case, BAC regions identified by multiple clones contained Brn3a consensus binding sites, as indicated on the map of the Pou4f1 locus. In a prior study (Trieu, et al., 1999), lower stringency screening of a smaller region of the Pou4f1 locus identified Brn3a binding sites of moderate affinity in the autoregulatory enhancer region (−5,633). The higher stringency screening of a much larger genomic clone shown here did not identify these sites, but revealed several higher affinity sites in other regions of the locus.
Within the region encompassed by this BAC, two transcripts of unknown function have been identified, 2610206B13Rik and D130079A08Rik. These transcripts extend from −54,719 to −9,586 and +8,795 to +23,049 relative to the start of Brn3a transcription, respectively, and are transcribed on the same strand. D130079A08Rik was identified from ESTs cloned from mouse spinal ganglion, and it is unclear whether these sequences represent an independently transcribed gene, or alternate Pou4f1 transcripts.
(B) Kinetic EMSA analysis of Brn3a binding to identified Brn3a binding sites. NP, no Brn3a protein; NC, no competitor; 5 min, 5 minute incubation with competitor; 20 min, 20 minute incubation with competitor.
(C) ChIP analysis of the Pou4f1 locus using 103 primer pairs to screen a ~160 kb genomic region for in vivo binding of Brn3a. Multiple areas of enrichment were identified including the Brn3a autoregulatory site cluster at −5,633 (difference from controls, p=0.003) and four areas 3′ to the transcription unit at +7,093 (p=0.0007), +43,473 (p=0.007), +51, 848 (p<0.0001) and +78,456 (p=0.01). Binding at −58,080 did not reach significance (p>0.01). Data are average values from three ChIP assays using independent pools of E13.5 trigeminal ganglia. Primer pairs used in ChIP assays of the Pou4f1 locus appear in Table S6.
(D) A comparison of in vitro affinity and in vivo binding suggests that Brn3a binding sites 5′ to the transcription unit are occupied less often than expected based on affinity, sites in the vicinity of the autoregulatory enhancer are occupied more often than expected, and sites 3′ to the transcription unit are occupied approximately in proportion to affinity.
In order to determine the relationship between in vitro binding and in vivo occupancy of the sites identified within the Pou4f1 locus, we next used locus-ChIP to screen the Pou4f1 locus for Brn3a binding from −75 kb to +85 kb in E13.5 trigeminal ganglia (Figure 4C). A total of 103 primer pairs were used in the assay, including those designed to confirm areas of enrichment detected in the in vitro screen. These results demonstrate in vivo Brn3a binding to the autoregulatory enhancer at −5,633 relative to the transcriptional start site, and to multiple sites identified 3′ to the Brn3a transcription unit.
Taken together, data from in vitro selection assays, in vivo ChIP assays, and EMSAs for Brn3a binding sites at the Pou4f1 locus suggest that specificity conferred by the local DNA sequence is not sufficient to explain the interaction of Brn3a with chromatin in vivo. Instead, sites in the distal 5′ region of the Pou4f1 BAC appear to exhibit low occupancy relative to their in vitro binding, exemplified by the very stable site at −58,080 which was selected most frequently in vitro, but is weakly bound in vivo (Figure 4D). Conversely, sites within the genomic region from approximately −10,000 to +3,000 relative to the start of transcription, encompassing the Pou4f1 sensory enhancer, autoregulatory region, transcriptional start, 5′ UTR, and first intron, are more highly occupied by Brn3a protein than would be predicted based on in vitro binding.
Brn3a binding to target gene loci in vivo correlates with interspecies conservation and specific histone modifications
In order to better understand the context-dependent binding of Brn3a, we examined the conservation of the identified binding sites between mouse and human genomic sequences and the specific modifications of histones across the gene loci of Brn3a and its downstream targets. Sequence conservation between species is a hallmark of functional regulatory regions, and local histone modifications have also been shown to play an important role in the regulation of gene expression (Margueron et al., 2005). Specifically, acetylation of the N-terminal tail of histone H3, associated with other modifications, is thought to induce an open conformation of chromatin that is accessible to the ubiquitous transcriptional machinery (Eberharter and Becker, 2002; Struhl, 1998). Although histone acetylation is generally associated with the promoter regions of transcribed genes, several examples indicate that tissue-specific distal regulatory regions may also be acetylated (Bulger, 2005).
Comparison of the mouse and human genomic loci for the downstream bHLH targets of Brn3a regulation and the Pou4f1 locus itself reveal that nearly all of the occupied Brn3a binding sites reside in regions of highly conserved sequence (Figures 5B, 5C, 6). The peak of Brn3a ChIP selection in the NeuroD1 locus (+2,973) resides in a highly conserved region of the 3′ untranslated portion of this gene. Similarly, in the NeuroD4 locus, the selected site in the first intron (+4,410) resides in a highly conserved region. However, no region of extended homology could be identified for the distal NeuroD4 site (−12,996). Within the regions of extended conservation containing the Brn3a binding sites at the NeuroD1 and NeuroD4 loci, the specific sequence of the consensus Brn3a binding sites are also fully conserved (Figure S3).
Figure 5. Markers of chromatin modification at the Pou4f1 locus.
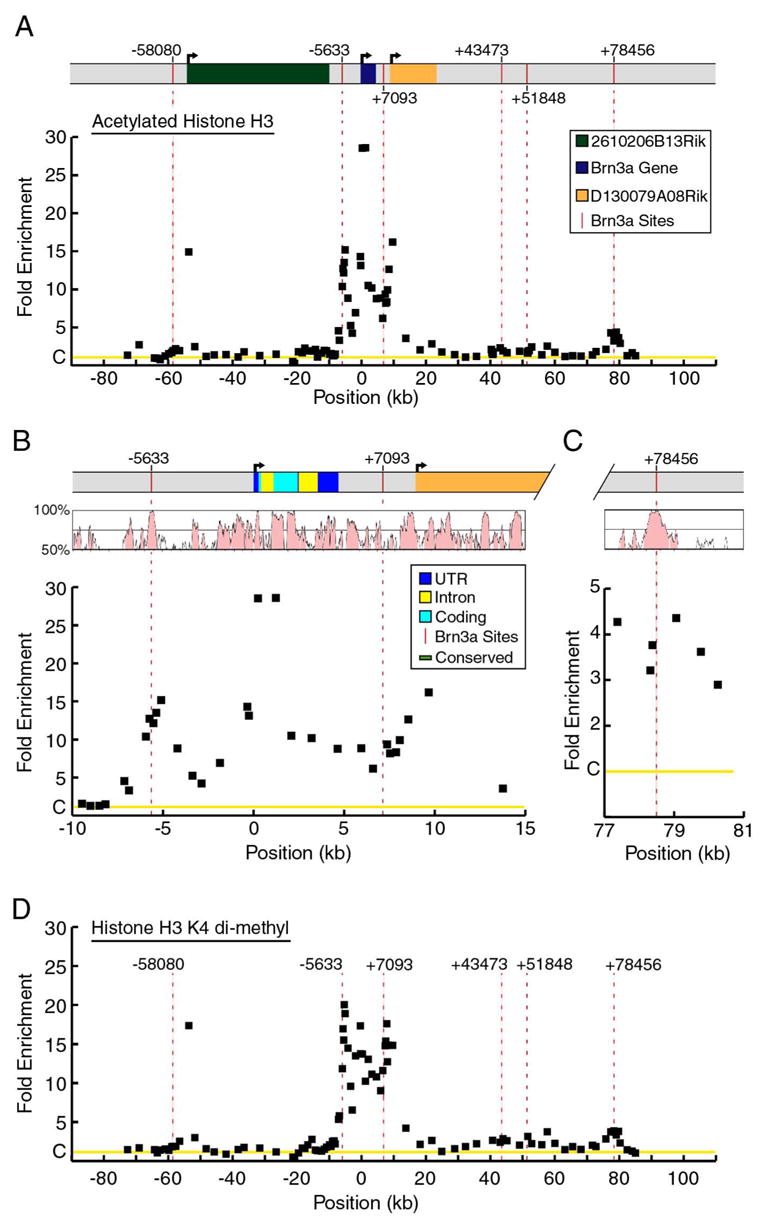
(A) Locus-ChIP assays were performed for acetylated histone H3 over a ~160 kb region encompassing the Pou4f1 locus in E13.5 trigeminal ganglia. Data show average enrichment from two sets of assays using separate pools of ganglia. H3 acetylation is increased within a ~15 kb region including the autoregulatory domain, transcriptional start site and primary transcript. The area of enrichment at −53,620 is closely associated with the transcription start site of an adjacent gene, 2610206B13Rik, and does not coincide with the Brn3a binding site at −58,080 (vertical red bar, dashed line). The fold enrichment of the selected versus unselected chromatin was normalized to a control value of one (C on Y-axis), based on the signal from the Alb-1 locus (Materials and Methods).
(B) Detailed map of histone H3 acetylation within a 25 kb region containing the Pou4f1 transcription unit. A region of increased acetylation encompasses the Brn3a autoregulatory site cluster at −5,633, the transcription start site, and extends beyond the 3′ end of the transcript to include the Brn3a binding site at +7,093. A VISTA plot of mouse-human homology within the locus indicates that regions of enhanced acetylation are correlated with areas of conserved sequence.
(C) Detailed map of histone-H3 acetylation from a 4 kb region containing the in vivo Brn3a binding site at +78,456. The region of moderately enhanced acetylation associated with this site also shows sequence conservation between the mouse and human genomes.
(D) Locus-ChIP of the Pou4f1 locus using antibodies to dimethylated H3–K4. The patterns of H3 acetylation and H3–K4 dimethylation are highly congruent.
Figure 6. Acetylated histone H3 ChIP assays of the NeuroD4 and NeuroD1 loci.
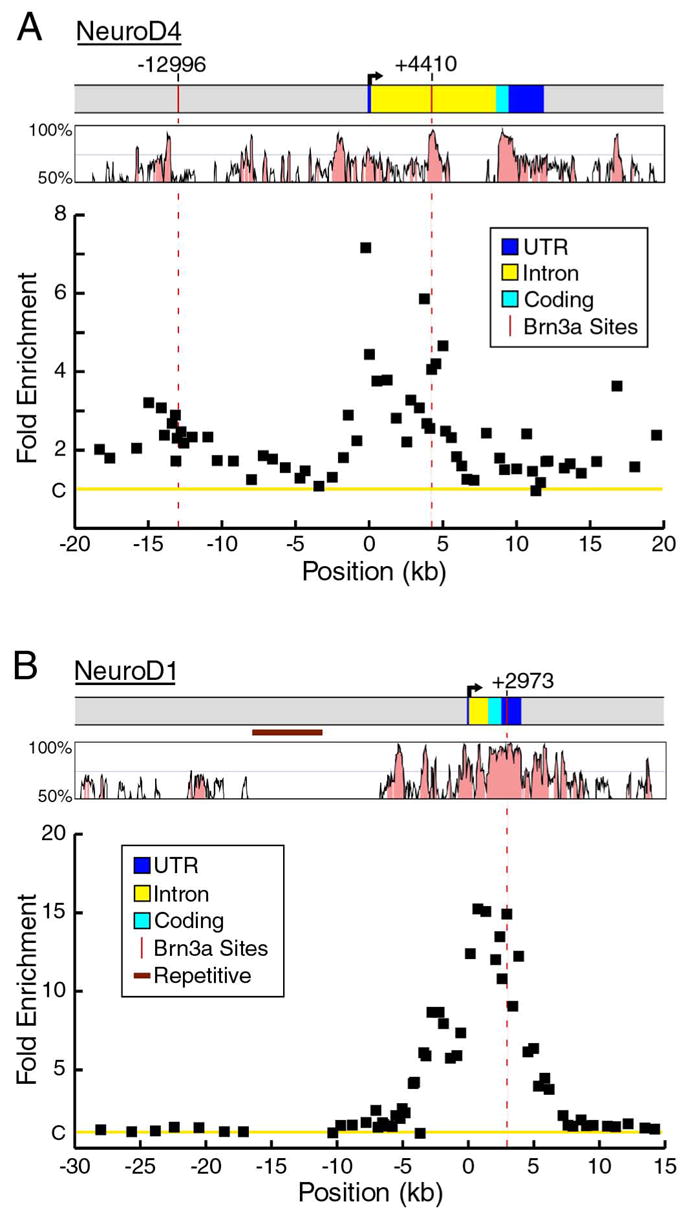
(A) Map of histone H3 acetylation of the NeuroD4 locus from −20 kb to +20 kb relative to the start of transcription, revealing three peaks of acetylation which encompass the start of transcription and the two identified in vivo Brn3a binding sites.
(B) Histone H3 acetylation of the NeuroD1 locus. A broad peak of acetylation encompasses the NeuroD1 transcription unit extending from approximately −5 kb to +7 kb relative to the transcription start site, including the in vivo Brn3a binding site at +2,973. (A) and (B) both show average enrichment values from two ChIP assays using separate pools of E13.5 trigeminal ganglia. In vivo Brn3a binding sites are represented by vertical red bars.
Occupied Brn3a binding sites within the Pou4f1 locus showed a similar degree of interspecies conservation. The Brn3a autoregulatory enhancer region (−5,633) has been previously shown to encompass a region of 244bp which is 100% conserved between mouse and human (Trieu et al., 2003), including five variant Brn3a binding sites. Alignment of mouse and human genomic sequences show that the occupied Brn3a binding sites in the 3′ flanking region of the Pou4f1 locus (+7,093, +43,473, +51,848, +78,456) also reside in islands of highly conserved sequence, and exhibit conservation of the Brn3a binding sites within these regions (Figures 5B, 5C and S3).
To assay chromatin modification in sensory neurons, we performed ChIP analysis of the Pou4f1 locus and target gene loci using an antibody recognizing acetylated histone H3 (Materials and Methods). As described for locus-ChIP assays using anti-Brn3a antibodies, these experiments were performed using microdissected E13.5 trigeminal ganglia as starting material, and were analyzed using PCR amplicons targeting the locus from −75 kb to +85 kb relative to the transcription start site (Figure 5A).
Enrichment values for most of the region examined approached background, indicating that chromatin is not hyperacetylated over most of the extended Pou4f1 locus. However, a major area of increased H3-acetylation extends from approximately −8,000 to +10,000 relative to the start of transcription (Figure 5B). Examination of this region at higher resolution (Figure 5B) reveals discrete peaks of acetylation at the Pou4f1 autoregulatory region (−5.5kb) and at the transcription start site, while the intervening region from −4kb to −2kb is much less acetylated. Significant acetylation also occurs 3′ to the transcription unit, encompassing an occupied Brn3a binding site identified at +7,093. In the far distal part of the locus, a relatively weak but significant area of acetylation was identified encompassing an occupied Brn3a binding site located at +78,456 (Figure 5C). Finally, a hyperacetylated region was identified at −53,620 relative to the Pou4f1 transcription start site, which corresponds precisely to the transcription start site of an adjacent gene of unknown function, 2610206B13Rik. This peak of acetylation does not coincide with the identified Brn3a binding site at −58,080, which exhibits very stable binding in vitro, but exhibits low occupancy in vivo.
We then examined histone H3 acetylation at the genomic loci of the bHLH factors directly regulated by Brn3a (Figure 6). The NeuroD4 locus is characterized by increased acetylation from approximately −2,000 to +5,000, with maximal enrichment observed near the transcription start site. A distinct peak of acetylation encompasses the in vivo Brn3a binding site located within the NeuroD4 first intron at +4,410. An additional minor acetylation peak occurs approximately 13 kb upstream of the transcription start site, corresponding with another in vivo Brn3a binding site at −12,995.
Histone H3 acetylation of the NeuroD1 locus extends from approximately −5,000 to +6,000 relative to the transcriptional start site. H3 acetylation at the NeuroD1 locus exceeded that at the NeuroD4 locus, consistent with the higher expression of NeuroD1 in wildtype ganglia (Eng et al., 2004). The region of acetylation corresponds with the area of enrichment observed in locus-ChIP analysis using α-Brn3a antibody, and maximal acetylation was observed near the transcription start site and at the identified Brn3a binding site at +2,973.
In addition to acetylation of histone H3, dimethylation of H3 lysine 4 (K4) has been shown to mark actively and potentially transcribed genes in yeast and higher eukaryotes (Santos-Rosa et al., 2002; Schneider et al., 2004; Schubeler et al., 2004). Therefore, in order to further define the relationship between markers of chromatin structure and Brn3a binding, we performed dimethyl H3-K4 locus-ChIP analysis of the relevant genes in embryonic trigeminal ganglia. At the Pou4f1 locus (Figure 5D), the pattern of H3–K4 dimethylation is remarkably similar to that of H3 acetylation, including significant enrichment in the autoregulatory enhancer region, the transcription start site, and an occupied Brn3a binding site identified at +7,093. The NeuroD4 and NeuroD1 genes also reveal patterns of H3–K4 dimethylation which closely parallel H3 acetylation at these loci (Figure S2), leading to the conclusion that these marks reflect a similar state of chromatin, associated with Brn3a binding.
Brn3a is excluded from the regulatory regions of genes not expressed in sensory ganglia
Taken together, the locus-ChIP data for Brn3a and its direct targets suggest that in vivo binding of Brn3a is highly context-dependent, and that site occupancy is predicted by occurrence of the sites in conserved regulatory regions which are also H3-acetylated and K4-dimethylated in trigeminal neurons. This observation leads to the prediction that Brn3a binding sites in the regulatory regions of genes which are never expressed in developing sensory neurons, and thus reside in regions of silenced chromatin, will not be occupied in vivo regardless of affinity. To test this hypothesis, we identified potential Brn3a binding sites using a bioinformatic search of a mouse promoter database containing upstream sequences of 14,963 well-characterized transcripts (MM5 upstream2000, UCSC Genome Bioinformatics). We then used microarray expression data from E13.5 (Eng et al., 2004) and adult (NCBI Gene Expression Omnibus) trigeminal ganglia to identify a subset of these genes that are not expressed in trigeminal neurons.
The bioinformatic search of the promoter database identified several hundred promoters containing variants of the Brn3a consensus sequence. From this set, 28 sites with high sequence similarity to the occupied sites in the Pou4f1 and NeuroD4 promoters were analyzed for Brn3a binding using kinetic EMSA assays. Using the dissociation half-lives of the complexes of these sites with Brn3a, they were categorized as exhibiting low, moderate, high, or very high stability. In these assays, the monomeric Brn3a consensus site exhibited moderate stability, and all of the sites with “high” or “very high” stability were characterized by the association of multiple Brn3a molecules with the site. Extensive prior studies using cell transfection and transgenic assays have demonstrated the ability of sites with these monomeric and dimeric motifs to mediate the transcriptional effects of Brn3a (Gruber et al., 1997; Rhee et al., 1998; Trieu et al., 2003; Trieu et al., 1999). Figure 7A shows representative EMSAs of oligonucleotides containing a consensus monomeric Brn3a binding site and binding sites from the promoters of two of the identified genes, Sema3e and Ngp.
Figure 7. Analysis of Brn3a binding sites identified in the promoters of genes not expressed in the developing trigeminal ganglion.
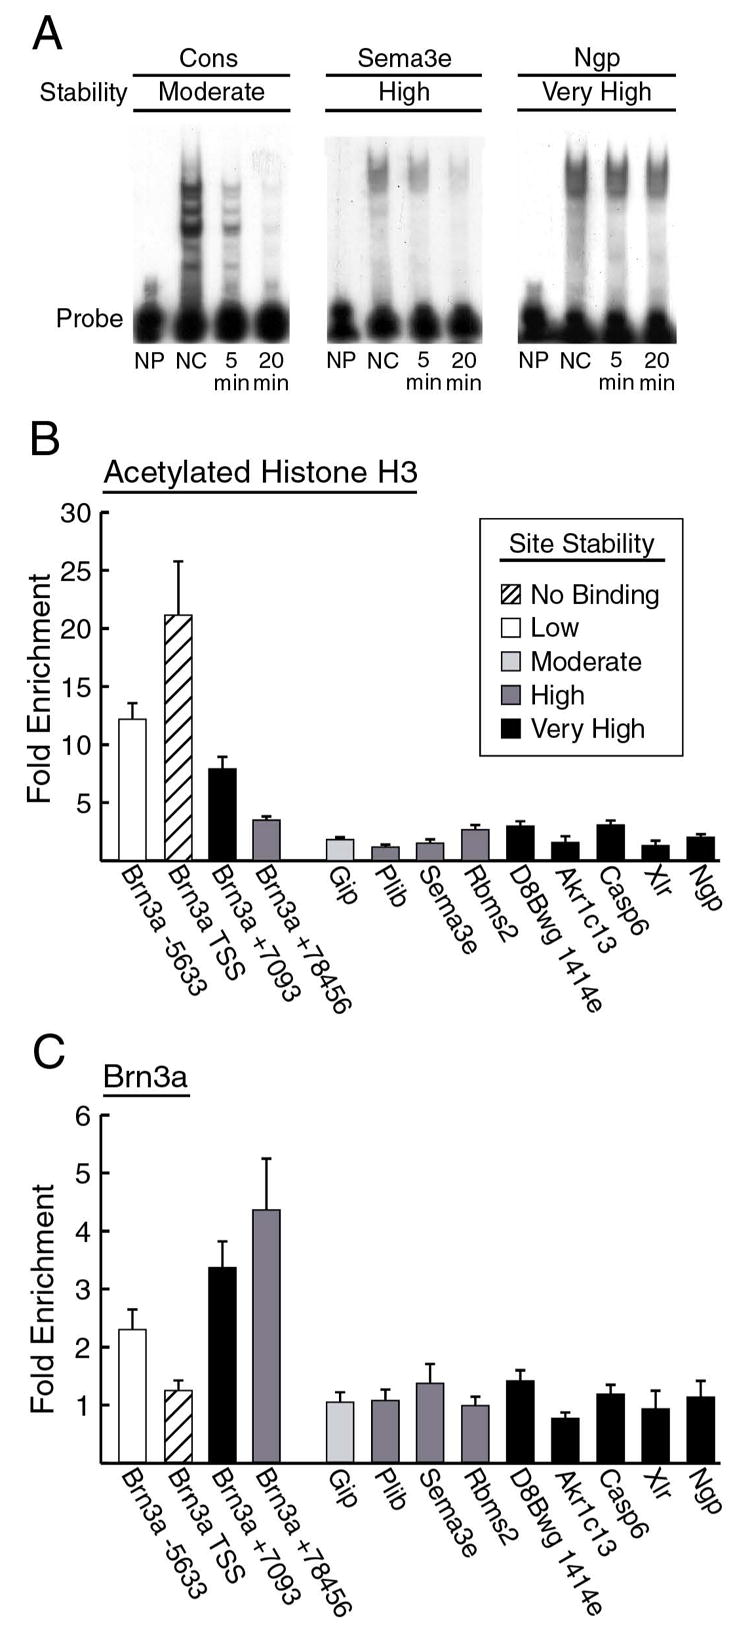
(A) Representative kinetic EMSA results for a Brn3a consensus site, and Brn3a sites identified in the Sema3e and Ngp promoters. For all sites tested, dissociation half-lives of Brn3a-DNA complexes were estimated based on first order kinetics (Materials and Methods) and were categorized as low, t1/2=0–2 minutes; moderate, t1/2=2–4 minutes; high, t1/2=4–15 minutes; and very high, t1/2> 15 minutes. A single consensus Brn3a binding site exhibits moderate stability in this assay because the sites with the highest stability are characterized by multimeric binding. NP, no protein; NC, no competitor. Sites tested in (A–C) were identified within 2 kb of the transcriptional start of the following genes: gastric inhibitory polypeptide, Gip; placental lactogen-I beta, Plib; semaphorin 3E, Sema3e; RNA binding motif, single stranded interacting protein 2, Rbms2; transcript of unknown function, D8Bwg1414e; aldo-keto reductase family 1, member C13, Akr1c13; caspase 6, Casp6; x-linked lymphocyte-regulated complex, Xlr; and neutrophilic granule protein, Ngp. Gene map locations appear in Table S1.
(B) ChIP analysis of histone H3 acetylation at silent promoters containing Brn3a binding sites. Fold enrichment for each promoter was determined using one or two real-time PCR primer pairs hybridizing near the binding site identified in the EMSA assays. Assays for sites in the Pou4f1 locus (Figure 5A) are shown for comparison.
(C) ChIP analysis of Brn3a binding at silent promoters. Assays for sites in the Pou4f1 locus (Figure 4C) are shown for comparison. No significant Brn3a binding was observed at any of the promoters of genes not expressed in the trigeminal. For (B) and (C) the enrichment values for three ChIP assays on independent samples were used for each primer pair. Enrichment values for multiple primer pairs targeting the same promoter were averaged, and bars show mean +SEM of three or six assays.
Nine of the promoters which contain Brn3a binding sites, but are transcriptionally silent in the trigeminal ganglion, were selected for ChIP analysis of histone acetylation and in vivo Brn3a binding (Figure 7), using PCR amplicons near each of the identified binding sites. Figure 7B compares H3 acetylation at these sites with sites in regulatory regions within the Pou4f1 locus. As predicted, H3 acetylation at these non-expressed genes is very low in comparison with the promoter/enhancer regions of the Pou4f1 locus and the other expressed genes examined in this study, and in most cases approaches the baseline set by amplicons in the albumin locus. ChIP assays for Brn3a binding at these sites were also uniformly negative (Figure 7C). Thus these sites are unoccupied in vivo despite the fact that their sequence and in vitro Brn3a binding characteristics are very similar to the occupied sites in the Pou4f1 and NeuroD4 regulatory regions, providing a striking confirmation of the context-dependent binding of Brn3a.
DISCUSSION
Brn3a is a direct repressor of bHLH genes and its own autoregulatory enhancer
In the present study we have used locus-wide ChIP assays to examine the direct interaction of Brn3a with four of its regulatory targets, the bHLH genes NeuroD4, NeuroD1, and Msc, and the Pou4f1 gene itself. These bHLH transcription factors were selected from among the 85 transcripts we have previously shown to exhibit >2-fold changed expression in the developing trigeminal ganglia of Pou4f1 null mice (Eng et al., 2004) because they are likely to be high in the regulatory hierarchy that leads to the Brn3a null phenotype. ChIP assays were performed with microdissected embryonic trigeminal ganglia, which provide a relatively homogenous source of post-mitotic Brn3a-expressing neurons. Although the results of ChIP assays may in principle be quantitated either with PCR-based methods or with microarrays (ChIP-on-chip, Blais et al., 2005; Carroll et al., 2005; Ren et al., 2002), here the analysis was limited to PCR-based methods, because the samples obtained from embryonic ganglia provide approximately 100-fold less starting material than that required by established ChIP-on-chip protocols.
Two refinements in PCR-quantitated ChIP were incorporated into the methods used in this study. First, real-time PCR with fluorimetric detection was employed, and the immunoprecipitated chromatin fragments were assayed by the cycle-threshold difference method (Ct difference, Livak and Schmittgen, 2001). This method allows each assay of ChIP selected DNA to be compared directly to an unselected sample using the same set of primer pairs, such that the observed enrichment for a given set of primers is highly likely to be a specific effect of the antibody selection process. The second refinement was the application of many sets of PCR primers arrayed across an extended gene locus (locus-ChIP). Locus-ChIP has the advantage of rapidly identifying regions of transcription factor binding or chromatin modification, yielding a map similar to a tiled array (Ciccone et al., 2004; Litt et al., 2001). In addition, multiple primer pairs can be designed to a particular region of interest to independently replicate significant findings. Finally, unlike ChIP assays targeting specific predicted binding sites or promoter regions, locus-ChIP analysis is independent of any assumption about where protein-DNA interactions will occur.
The results of these experiments demonstrate that Brn3a is a direct repressor of NeuroD4 and NeuroD1 in the developing trigeminal ganglion. Combined with the altered expression of other transcripts in the sensory ganglia of Pou4f1 null mice (Eng et al., 2004), these results suggest that a major function of Brn3a in postmitotic trigeminal neurons is to terminate the expression of genes characteristic of earlier developmental phases, and also to repress genes normally expressed in the hindbrain but not in the sensory ganglia. In contrast to NeuroD4 and NeuroD1, no evidence could be found for Brn3a binding at the Msc locus. Despite these results, it is possible that Brn3a acts directly to repress the Msc locus at regulatory sites which lie outside the 40kb region examined by locus-ChIP, or the Msc gene may be activated indirectly in Pou4f1 null mice by other transcription factors which show markedly increased expression in the absence of Brn3a (Eng et al., 2004).
Direct regulation of the Pou4f1 autoregulatory enhancer was also verified by locus-ChIP, although the occupancy of the autoregulatory sites appears to be significantly less than those of the NeuroD4 locus. Relatively weak repression of the autoregulatory enhancer is consistent with the quantitative expression of NeuroD4 and Brn3a mRNA in the E13.5 trigeminal ganglion, in that expression from the NeuroD4 locus is repressed to almost undetectable levels by Brn3a (Eng et al., 2004) whereas expression from the Pou4f1 locus clearly continues throughout development, and is only modulated by autoregulation via relatively weak binding sites (Trieu et al., 2003; Trieu et al., 1999). Although no definitive conclusion can be drawn from these examples, it is plausible that different binding site affinities and site occupancy in target gene loci may be a general mechanism for controlling the extent of repression by Brn3a.
Context-dependent DNA binding by Brn3a
In general, tissue-specific transcription factors appear to have many more potential genomic binding sites than the observed number of downstream genes in a specific cell type. Most monomeric transcription factors have DNA recognition sites with a complexity equivalent to 4–5 unique base pairs, leading to an expected occurrence in vertebrate genomes of >106. In many cases, binding specificity is increased by homo- or heterodimerization, and in the case of the POU-domain family this is achieved by the integration of two DNA binding domains into a single transcription unit (Phillips and Luisi, 2000). Dimeric transcription factors recognize extended sites, but given the inherent flexibility in the DNA recognition properties of most of these proteins, the specificity of binding rarely exceeds approximately 8 unique bases, yielding 104–105 predicted recognition sites. Consistent with these general predictions, we performed a compete search of mouse chromosome 4, which contains 5.94% percent of the genome, for the consensus Brn3a binding site ATAAA/TTAAT (Gruber et al., 1997), revealing 10,738 occurrences of this motif. Extrapolating from this search to the entire genome suggests that there are greater than 105 potential genomic Brn3a binding sites, and given that some variation in the consensus is permitted, this is likely to be an underestimate (calculations appear in Supplemental Methods).
In contrast, recent micro- and macroarray studies which have analyzed global changes in gene expression in mice with mutations of neural transcription factors have identified much smaller sets of regulated genes. In the developing retina, microarray analysis has revealed 16 targets of the homeodomain factor Crx (Livesey et al., 2000), and 87 transcripts regulated by Brn3b (Mu et al., 2004). In the embryonic cerebellum, analysis of mice with mutations of the orphan receptor RORa revealed 36 significantly changed transcripts, using somewhat less stringent criteria than the retinal studies (Gold et al., 2003). In the developing trigeminal ganglion, 85 transcripts have been identified which exhibit >2-fold change in the absence of Brn3a (Eng et al., 2004). Although none of these studies achieved genome-wide coverage of potentially regulated genes, it is clear that the number of transcripts with altered expression is far fewer than the number of potential recognition sites for the transcription factors examined.
These observations imply that the regulatory activity of neuron-specific transcription factors will be highly dependent on the genomic context of their binding sites. In principle, this could be achieved by either of two mechanisms. First, a transcription factor might be bound to all of its genomic sites in relation to their intrinsic affinity, but have context-dependent transcriptional activity. In this model, the transcriptional activity of the bound factor might require that its binding site be located proximal to an active promoter, or adjacent to the binding sites for other factors required to make up an active enhancer/repressor unit. Second, the activity of a factor might be restricted at the level of DNA binding, such that only a fraction of its potential sites are occupied in vivo. This could also be due to a requirement for adjacent sites for other regulators that modulate binding, or because of alterations in chromatin structure which either exclude or permit interaction of the factor with its target sites. The examples cited here strongly suggest that the context-dependent activity of Brn3a is regulated at the level of DNA binding. This is suggested by the variability of site occupancy across the Brn3a locus, and confirmed by the observation that sites identified in the promoter regions of genes which are silent in sensory ganglia, but matched for sequence and in vitro affinity to known Brn3a-occupied sites, are not occupied in vivo.
Several determinants are likely to affect context-dependent DNA binding by Brn3a. Two features which strongly correlate with site occupancy in Brn3a target gene loci are the presence of sites in non-coding regions which show high conservation between the mouse and human genomes, and the localization of sites in regions of H3-acetylated and H3–K4 dimethylated chromatin. Interspecies conservation in non-coding sequence is a recognized hallmark of regulatory domains (Xie et al., 2005). The regions of mouse-human homology identified by Brn3a binding include conservation of the consensus Brn3a binding sites, but also extend into adjacent regions, consistent with Brn3a binding within cis-regulatory modules which integrate inputs from multiple cellular transcription factors (Howard and Davidson, 2004; Wenick and Hobert, 2004).
Although less well-recognized, histone modifications may also be useful markers of functional regulatory domains. H3 acetylation and H3–K4 dimethylation are predictive of regions of open chromatin structure with active transcriptional or regulatory activity (Margueron et al., 2005). Although these histone modifications are best characterized near the promoters of transcribed genes, there are several precedents for histone acetylation of distal regulatory regions (Bulger, 2005). In the present study, Brn3a binding in the Pou4f1 locus, and in the loci of Brn3a target genes, occurs consistently in regions of H3-acetylated and H3 K4-dimethylated histones. In contrast, high-affinity Brn3a sites in deacetylated regions of the Brn3a locus and in silent, deacetylated gene promoters show low occupancy. Although these examples are correlative, they suggest that increased H3 acetylation and H3–K4 dimethylation may be useful general markers for the regions of chromatin where Brn3a may interact.
Because Brn3a binding in vivo is highly associated with local histone H3 acetylation and H3 K4-dimethylation, it is logical to consider whether these modifications are partly the result of Brn3a binding. If Brn3a acted as a transcriptional activator at target bHLH genes and its own locus, it might induce these modifications through the recruitment of histone acetyltransferases and methyltransferases. However, the action of Brn3a as a repressor at these loci strongly suggests that Brn3a binding occurs only in the context of a pre-existing permissive state of chromatin modification, generated and maintained by other factors.
The correlation of Brn3a binding with histone modification is consistent with recent findings for other transcription factors. The most complete studies of this kind in vertebrates have characterized in vivo CREB binding to its recognition element CRE. In one study, serial analysis of chromatin occupancy (SACO) was used to carry out a genome-wide scan for CREB binding sites in forskolin-stimulated PC12 cells. The sequences bound by CREB in vivo were highly associated with CpG islands (Impey et al., 2004). Further work from the same group demonstrated that CREB occupies CRE-containing promoters in a cell type specific manner, and promoters of four genes with high CREB occupancy in stimulated PC12 cells also showed high H3–K4 methylation even in the unstimulated state, but unoccupied promoters were K4 demethylated (Cha-Molstad et al., 2004). In another a large scale ChIP study, myc binding to identified E-box elements demonstrated that E-boxes are much more likely to be occupied within 2kb of promoters than in intergenic regions (Fernandez et al., 2003). In a cell line inducibly expressing high levels of myc, the E-boxes highly bound in vivo were associated with H3 acetylation even prior to myc induction. Myc induction the resulted in additional acetylation at these sites. Thus for both CREB and myc, pre-existing chromatin modifications may influence recognition of target sequences in vivo.
Taken together, these results suggest two important elements of context-dependent Brn3a target gene recognition in sensory neurons. First, Brn3a binding occurs in regions of extended interspecies conservation, suggesting an interaction between Brn3a and other transcription factors at these sites. Second, histone modifications may play a role in the modulation of Brn3a binding. Unlike the primary genomic sequence, histone modifications may be cell-type specific, and influence the interaction of transcription factors with chromatin in a cell-specific manner. In future studies, mapping genomic loci for cell-specific histone modifications, in combination with analysis of interspecies conservation, may significantly improve the prediction of functional transcription factor binding sites.
Supplementary Material
Acknowledgments
We would like to thanks Drs. Jane Johnson, Michael Wegner and Sam Pfaff for helpful comments on the manuscript. We would also like to thank Dr. Michael Wegner for the generous gift of Sox10 antisera. Sequencing was performed with the support of the UCSD Center for AIDS Research, 5 P30AI36214. Supported in part by Department of Veterans Affairs MERIT funding, and NIH awards HD33442 and MH065496 (E.E.T). E.E.T. is a NARSAD Investigator.
Footnotes
Publisher's Disclaimer: This is a PDF file of an unedited manuscript that has been accepted for publication. As a service to our customers we are providing this early version of the manuscript. The manuscript will undergo copyediting, typesetting, and review of the resulting proof before it is published in its final citable form. Please note that during the production process errors may be discovered which could affect the content, and all legal disclaimers that apply to the journal pertain.
References
- Blais A, Tsikitis M, Acosta-Alvear D, Sharan R, Kluger Y, Dynlacht BD. An initial blueprint for myogenic differentiation. Genes Dev. 2005;19:553–69. doi: 10.1101/gad.1281105. [DOI] [PMC free article] [PubMed] [Google Scholar]
- Brudno M, Do CB, Cooper GM, Kim MF, Davydov E, Green ED, Sidow A, Batzoglou S. LAGAN and Multi-LAGAN: efficient tools for large-scale multiple alignment of genomic DNA. Genome Res. 2003;13:721–31. doi: 10.1101/gr.926603. [DOI] [PMC free article] [PubMed] [Google Scholar]
- Bulger M. Hyperacetylated chromatin domains: lessons from heterochromatin. J Biol Chem. 2005;280:21689–92. doi: 10.1074/jbc.R500004200. [DOI] [PubMed] [Google Scholar]
- Carroll JS, Liu XS, Brodsky AS, Li W, Meyer CA, Szary AJ, Eeckhoute J, Shao W, Hestermann EV, Geistlinger TR, Fox EA, Silver PA, Brown M. Chromosome-wide mapping of estrogen receptor binding reveals long-range regulation requiring the forkhead protein FoxA1. Cell. 2005;122:33–43. doi: 10.1016/j.cell.2005.05.008. [DOI] [PubMed] [Google Scholar]
- Cha-Molstad H, Keller DM, Yochum GS, Impey S, Goodman RH. Cell-type-specific binding of the transcription factor CREB to the cAMP-response element. Proc Natl Acad Sci U S A. 2004;101:13572–7. doi: 10.1073/pnas.0405587101. [DOI] [PMC free article] [PubMed] [Google Scholar]
- Ciccone DN, Morshead KB, Oettinger MA. Chromatin immunoprecipitation in the analysis of large chromatin domains across murine antigen receptor loci. Methods Enzymol. 2004;376:334–48. doi: 10.1016/S0076-6879(03)76022-4. [DOI] [PubMed] [Google Scholar]
- Eberharter A, Becker PB. Histone acetylation: a switch between repressive and permissive chromatin. Second in review series on chromatin dynamics. EMBO Rep. 2002;3:224–9. doi: 10.1093/embo-reports/kvf053. [DOI] [PMC free article] [PubMed] [Google Scholar]
- Eng S, Gratwick K, Rhee J, Fedtsova N, Gan L, Turner E. Defects in sensory axon growth precede neuronal death in Brn3a-deficient mice. J Neuroscience. 2001;21:541–49. doi: 10.1523/JNEUROSCI.21-02-00541.2001. [DOI] [PMC free article] [PubMed] [Google Scholar]
- Eng SR, Lanier J, Fedtsova N, Turner EE. Coordinated regulation of gene expression by Brn3a in developing sensory ganglia. Development. 2004;131:3859–70. doi: 10.1242/dev.01260. [DOI] [PubMed] [Google Scholar]
- Erkman L, Yates PA, McLaughlin T, McEvilly RJ, Whisenhunt T, O'Connell SM, Krones AI, Kirby MA, Rapaport DH, Bermingham JR, O'Leary DD, Rosenfeld MG. A POU domain transcription factor-dependent program regulates axon pathfinding in the vertebrate visual system. Neuron. 2000;28:779–92. doi: 10.1016/s0896-6273(00)00153-7. [DOI] [PubMed] [Google Scholar]
- Fedtsova N, Turner E. Brn-3.0 Expression identifies early post-mitotic CNS neurons and sensory neural precursors. Mechanisms of Development. 1995;53:291–304. doi: 10.1016/0925-4773(95)00435-1. [DOI] [PubMed] [Google Scholar]
- Gan L, Xiang M, Zhou L, Wagner DS, Klein WH, Nathans J. POU-domain factor Brn-3b is required for the development of a large set of retinal ganglion cells. Proc Natl Acad Sci. 1996;93:3920–5. doi: 10.1073/pnas.93.9.3920. [DOI] [PMC free article] [PubMed] [Google Scholar]
- Gold DA, Baek SH, Schork NJ, Rose DW, Larsen DD, Sachs BD, Rosenfeld MG, Hamilton BA. RORalpha coordinates reciprocal signaling in cerebellar development through sonic hedgehog and calcium-dependent pathways. Neuron. 2003;40:1119–31. doi: 10.1016/s0896-6273(03)00769-4. [DOI] [PMC free article] [PubMed] [Google Scholar]
- Gruber C, Rhee J, Gleiberman A, Turner E. POU-domain factors of the Brn-3 class recognize functional DNA elements which are distinctive, symmetrical, and highly conserved in evolution. Mol Cell Bio. 1997;17:2391–2400. doi: 10.1128/mcb.17.5.2391. [DOI] [PMC free article] [PubMed] [Google Scholar]
- Helms AW, Johnson JE. Specification of dorsal spinal cord interneurons. Curr Opin Neurobiol. 2003;13:42–9. doi: 10.1016/s0959-4388(03)00010-2. [DOI] [PubMed] [Google Scholar]
- Howard ML, Davidson EH. cis-Regulatory control circuits in development. Dev Biol. 2004;271:109–18. doi: 10.1016/j.ydbio.2004.03.031. [DOI] [PubMed] [Google Scholar]
- Impey S, McCorkle SR, Cha-Molstad H, Dwyer JM, Yochum GS, Boss JM, McWeeney S, Dunn JJ, Mandel G, Goodman RH. Defining the CREB regulon: a genome-wide analysis of transcription factor regulatory regions. Cell. 2004;119:1041–54. doi: 10.1016/j.cell.2004.10.032. [DOI] [PubMed] [Google Scholar]
- Litt MD, Simpson M, Gaszner M, Allis CD, Felsenfeld G. Correlation between histone lysine methylation and developmental changes at the chicken beta-globin locus. Science. 2001;293:2453–5. doi: 10.1126/science.1064413. [DOI] [PubMed] [Google Scholar]
- Livak KJ, Schmittgen TD. Analysis of relative gene expression data using real-time quantitative PCR and the 2(-Delta Delta C(T)) Method. Methods. 2001;25:402–8. doi: 10.1006/meth.2001.1262. [DOI] [PubMed] [Google Scholar]
- Livesey FJ, Furukawa T, Steffen MA, Church GM, Cepko CL. Microarray analysis of the transcriptional network controlled by the photoreceptor homeobox gene Crx. Curr Biol. 2000;10:301–10. doi: 10.1016/s0960-9822(00)00379-1. [DOI] [PubMed] [Google Scholar]
- Luo RX, Postigo AA, Dean DC. Rb interacts with histone deacetylase to repress transcription. Cell. 1998;92:463–73. doi: 10.1016/s0092-8674(00)80940-x. [DOI] [PubMed] [Google Scholar]
- Maka M, Stolt CC, Wegner M. Identification of Sox8 as a modifier gene in a mouse model of Hirschsprung disease reveals underlying molecular defect. Dev Biol. 2005;277:155–69. doi: 10.1016/j.ydbio.2004.09.014. [DOI] [PubMed] [Google Scholar]
- Mancini DN, Singh SM, Archer TK, Rodenhiser DI. Site-specific DNA methylation in the neurofibromatosis (NF1) promoter interferes with binding of CREB and SP1 transcription factors. Oncogene. 1999;18:4108–19. doi: 10.1038/sj.onc.1202764. [DOI] [PubMed] [Google Scholar]
- Margueron R, Trojer P, Reinberg D. The key to development: interpreting the histone code? Curr Opin Genet Dev. 2005;15:163–76. doi: 10.1016/j.gde.2005.01.005. [DOI] [PubMed] [Google Scholar]
- Marquardt T. Transcriptional control of neuronal diversification in the retina. Prog Retin Eye Res. 2003;22:567–77. doi: 10.1016/s1350-9462(03)00036-3. [DOI] [PubMed] [Google Scholar]
- Mayor C, Brudno M, Schwartz JR, Poliakov A, Rubin EM, Frazer KA, Pachter LS, Dubchak I. VISTA : visualizing global DNA sequence alignments of arbitrary length. Bioinformatics. 2000;16:1046–7. doi: 10.1093/bioinformatics/16.11.1046. [DOI] [PubMed] [Google Scholar]
- McEvilly RJ, Erkman L, Luo L, Sawchenko PE, Ryan AF, Rosenfeld MG. Requirement for Brn-3.0 in differentiation and survival of sensory and motor neurons. Nature. 1996;384:574–77. doi: 10.1038/384574a0. [DOI] [PubMed] [Google Scholar]
- Mu X, Beremand PD, Zhao S, Pershad R, Sun H, Scarpa A, Liang S, Thomas TL, Klein WH. Discrete gene sets depend on POU domain transcription factor Brn3b/Brn-3.2/POU4f2 for their expression in the mouse embryonic retina. Development. 2004;131:1197–210. doi: 10.1242/dev.01010. [DOI] [PubMed] [Google Scholar]
- Phillips K, Luisi B. The virtuoso of versatility: POU proteins that flex to fit. J Mol Biol. 2000;302:1023–39. doi: 10.1006/jmbi.2000.4107. [DOI] [PubMed] [Google Scholar]
- Ren B, Cam H, Takahashi Y, Volkert T, Terragni J, Young RA, Dynlacht BD. E2F integrates cell cycle progression with DNA repair, replication, and G2/M checkpoints. Genes Dev. 2002;16:245–256. doi: 10.1101/gad.949802. [DOI] [PMC free article] [PubMed] [Google Scholar]
- Rhee J, Gruber C, Brodie T, Turner E. Highly cooperative homodimerization is a conserved property of neural POU proteins. J Biol Chem. 1998;273:34196–34205. doi: 10.1074/jbc.273.51.34196. [DOI] [PubMed] [Google Scholar]
- Rhee JM, Trieu M, Turner EE. Optimal Oct-2 affinity for an extended DNA site and the effect of GST fusion on site preference. Arch Biochem Biophys. 2001;385:397–405. doi: 10.1006/abbi.2000.2181. [DOI] [PubMed] [Google Scholar]
- Santos-Rosa H, Schneider R, Bannister AJ, Sherriff J, Bernstein BE, Emre NC, Schreiber SL, Mellor J, Kouzarides T. Active genes are tri-methylated at K4 of histone H3. Nature. 2002;419:407–11. doi: 10.1038/nature01080. [DOI] [PubMed] [Google Scholar]
- Schneider R, Bannister AJ, Myers FA, Thorne AW, Crane-Robinson C, Kouzarides T. Histone H3 lysine 4 methylation patterns in higher eukaryotic genes. Nat Cell Biol. 2004;6:73–7. doi: 10.1038/ncb1076. [DOI] [PubMed] [Google Scholar]
- Schubeler D, MacAlpine DM, Scalzo D, Wirbelauer C, Kooperberg C, van Leeuwen F, Gottschling DE, O'Neill LP, Turner BM, Delrow J, Bell SP, Groudine M. The histone modification pattern of active genes revealed through genome-wide chromatin analysis of a higher eukaryote. Genes Dev. 2004;18:1263–71. doi: 10.1101/gad.1198204. [DOI] [PMC free article] [PubMed] [Google Scholar]
- Shirasaki R, Pfaff SL. Transcriptional codes and the control of neuronal identity. Annu Rev Neurosci. 2002;25:251–81. doi: 10.1146/annurev.neuro.25.112701.142916. [DOI] [PubMed] [Google Scholar]
- Struhl K. Histone acetylation and transcriptional regulatory mechanisms. Genes Dev. 1998;12:599–606. doi: 10.1101/gad.12.5.599. [DOI] [PubMed] [Google Scholar]
- Theiler K. The house mouse; development and normal stages from fertilization to 4 weeks of age. Springer-Verlag; Berlin, New York: 1972. [Google Scholar]
- Trieu M, Ma A, Eng SR, Fedtsova N, Turner EE. Direct autoregulation and gene dosage compensation by POU-domain transcription factor Brn3a. Development. 2003;130:111–21. doi: 10.1242/dev.00194. [DOI] [PubMed] [Google Scholar]
- Trieu M, Rhee J, Fedtsova N, Turner E. Autoregulatory sequences are revealed by complex stability screening of the mouse brn-3.0 locus. J Neuroscience. 1999;19:6549–58. doi: 10.1523/JNEUROSCI.19-15-06549.1999. [DOI] [PMC free article] [PubMed] [Google Scholar]
- Wenick AS, Hobert O. Genomic cis-regulatory architecture and transacting regulators of a single interneuron-specific gene battery in C. elegans. Dev Cell. 2004;6:757–70. doi: 10.1016/j.devcel.2004.05.004. [DOI] [PubMed] [Google Scholar]
- Xiang M, Gan L, Li D, Chen ZY, Zhou L, O'Malley BW, Jr, Klein W, Nathans J. Essential role of POU-domain factor Brn-3c in auditory and vestibular hair cell development. Proc Natl Acad Sci U S A. 1997;94:9445–50. doi: 10.1073/pnas.94.17.9445. [DOI] [PMC free article] [PubMed] [Google Scholar]
- Xiang M, Lin G, Zhou L, Klein WH, Nathans J. Targeted deletion of the mouse POU-domain gene Brn-3a causes a selective loss of neurons in the brainstem and trigeminal ganglion, uncoordinated limb movement, and impaired suckling. Proc Nat Acad Sci. 1996;93:11950–11955. doi: 10.1073/pnas.93.21.11950. [DOI] [PMC free article] [PubMed] [Google Scholar]
- Xie X, Lu J, Kulbokas EJ, Golub TR, Mootha V, Lindblad-Toh K, Lander ES, Kellis M. Systematic discovery of regulatory motifs in human promoters and 3′ UTRs by comparison of several mammals. Nature. 2005;434:338–45. doi: 10.1038/nature03441. [DOI] [PMC free article] [PubMed] [Google Scholar]
- Zaki PA, Quinn JC, Price DJ. Mouse models of telencephalic development. Curr Opin Genet Dev. 2003;13:423–37. doi: 10.1016/s0959-437x(03)00084-4. [DOI] [PubMed] [Google Scholar]
- Zhang X, Odom DT, Koo SH, Conkright MD, Canettieri G, Best J, Chen H, Jenner R, Herbolsheimer E, Jacobsen E, Kadam S, Ecker JR, Emerson B, Hogenesch JB, Unterman T, Young RA, Montminy M. Genome-wide analysis of cAMP-response element binding protein occupancy, phosphorylation, and target gene activation in human tissues. Proc Natl Acad Sci U S A. 2005;102:4459–64. doi: 10.1073/pnas.0501076102. [DOI] [PMC free article] [PubMed] [Google Scholar]
Associated Data
This section collects any data citations, data availability statements, or supplementary materials included in this article.