Abstract
Background and aim
Major histocompatibility complex class II deficient (Aα0/0) mice have decreased CD4+ T cells, making them immunologically similar to patients with acquired immunodeficiency syndrome (AIDS). Both patients with AIDS and Aα0/0 mice have hypertrophic gastric folds. To clarify the mechanism of gastric mucosal hyperplasia, we investigated the pathophysiology and the role of the innate immunity in the stomach of Aα0/0 mice.
Methods
Stomachs from 1–6 month old Aα0/0 mice, kept under specific pathogen free conditions, were examined at 1 month intervals histologically and immunohistochemically. Gene expression of proinflammatory cytokines, Toll‐like receptors (TLRs), cyclooxygenase (COX)‐2, and myeloperoxidase (MPO) activity in the gastric mucosa was investigated. Serum gastrin levels and gastric acidity were measured. Bacterial culture of the stomach was performed. To clarify the roles of hypergastrinaemia in the gastric mucosa, a gastrin receptor antagonist (AG041R) was administered.
Results
Aα0/0 mice had a diffusely thick corpus mucosa with infiltration of CD11b+ granulocytes and macrophages. Anti‐Ki67 staining demonstrated expansion of the proliferating neck zone. Gene expression of interleukin 1β, interferon γ, TLR‐2, TLR‐4, and COX‐2 were upregulated, and MPO activity was increased. Only a small amount of non‐pathogenic bacteria was detected in the stomach. Serum gastrin levels and Reg‐Iα positive cells in the gastric mucosa increased, despite normal gastric acidity. After treatment with AG041R, gastric mucosal thickness was significantly reduced.
Conclusion
Persistent activation of innate immunity in the stomach induced gastric mucosal hyperplasia through upregulation of gastrin synthesis in Aα0/0 mice, suggesting a pathophysiology similar to the gastric changes in patients with AIDS.
Keywords: gastric mucosal hyperplasia, gastrin, innate immunity, major histocompatibility complex, acquired immunodeficiency syndrome
Major histocompatibility complex (MHC) class II molecules have a cardinal role in regulating the immune response. These polymorphic heterodimers are displayed in diverse cell types of the immune system, exerting their influence by controlling cell‐cell interactions. One of the major expression sites of MHC class II molecules is the surface of antigen presenting cells, such as dendritic cells and macrophages, where they capture antigenic peptides and present them to CD4+ T cells. MHC class II molecules are also prominent on B cells and appear to coordinate the collaboration with CD4+ T helpers thought to be necessary for engendering an efficient antibody response. Moreover, they are present on various thymic stromal cells where they govern the positive and negative selection of CD4+ T cells, crucial events in the generation of a peripheral T cell repertoire that is both appropriate and self‐tolerant. Taken together, MHC class II molecules have important roles in antigen presentation, T‐B cell collaboration, and thymocyte education (T cell maturation).
MHC class II deficient mice were generated using the method of gene targeting in embryonic stem cells.1,2,3 Because of the lack of thymocyte education (T cell maturation), the mature CD4+CD8− T cells in both the thymus and periphery of MHC class II deficient mice are almost completely defective.1,2,3 Moreover, through lack of antigen presentation and T‐B cell interaction, MHC class II deficient mice cannot produce antigen specific antibodies4 but the number of non‐CD4+CD8− T cells, including granulocytes, monocytes/macrophages, and CD4−CD8+ T cells, are completely preserved.1,2,3 Thus MHC class II deficient mice have some immunological resemblance to patients with acquired immunodeficiency syndrome (AIDS) because of the decreased number of CD4+ T cells. Indeed, patients with AIDS have a defective adaptive immune system, thereby innate immunity is thought to be involved mainly in the protection against microorganisms. Patients with AIDS often possess hypertrophic gastric mucosa, which is usually associated with opportunistic infection.5,6,7,8
Accordingly, we examined the immune response of the gastric mucosa in the stomach of MHC class II deficient mice and observed marked gastric mucosal hyperplasia with excessive infiltration of polymorphonuclear cells and an increase in serum gastrin levels.
Thus the aims of the present study were to clarify the underlying mechanism of the development of gastric mucosal hyperplasia in MHC class II deficient mice and to elucidate the role of innate immunity in gastric mucosal cells.
Materials and methods
Mice
MHC class II deficient mice were originally produced as described by Kontgen et al and were kindly donated by Dr H. Bluethmann (F Hoffmann‐La Roche Ltd, Basel, Switzerland) (and thereafter designated Aα0/0 mice).3 Wild‐type (WT) C57BL/6 mice were purchased from Japan SLC (Shizuoka, Japan). All mice were bred at the animal facility of Kyoto University under specific pathogen free conditions. In our animal facility, specific pathogen free conditions are free from Helicobacter sp, mouse hepatitis virus, Sendai virus, Mycoplasma pulmonis, Tyzzer's organism, Corynebacterium kutcheri, Pasteurella pneumotropica, Salmonella sp, E coli O‐115, Giardia muris, Trichomonas sp, Spinonucleus muris, Entamoeba sp, Pneumocystis carinii, Syphacia sp, and Aspicularis tetraptera. Mice were offered commercially available food pellets (F2; Funabashi Farm, Chiba, Japan) and drinking tap water. The ethics committee for the Use of Experimental Animals of Kyoto University approved all protocols.
Measurement of gastric pH and histological examination
After 24 hours of starvation, mice (1–6 month old) were killed under ether anaesthesia at one month intervals and their stomachs and spleens were rapidly removed. Local pH in the corpus area of the stomach was measured with pH test paper (Advantec, Tokyo, Japan). The stomachs were fixed in 4% phosphate buffered formaldehyde (pH 7.2) and sections were stained with haematoxylin‐eosin. Well oriented sections from the base to the surface of the corpus and antrum were selected for measurement of mucosal thickness and for counting of immunostaining positive cells in 10 different visual fields for each stomach using a microscope with a calibrated micrometre scale, and the results were averaged.
Immunohistochemistry
Immunohistochemical staining was performed on freshly frozen sections (I‐A, B220, CD4, CD8, and CD11b) and formalin fixed paraffin embedded sections (Ki‐67, Reg‐Iα, and gastrin) using the avidin‐biotin immunoperoxidase method, as described previously.9,10 Briefly, freshly frozen sections were fixed in acetone and paraffin embedded sections were deparaffinised and rehydrated through xylene and ethanol washes. Then, sections for Ki‐67, Reg‐Iα, and gastrin immunostaining were incubated with 10% normal rabbit or goat serum for blocking. Sections were incubated with the primary antibodies biotin conjugated monoclonal anti‐I‐A, B220, CD4, CD8, CD11b (Becton and Dickinson, Franklin Lakes, New Jersey, USA), monoclonal anti‐Ki‐67 (Dako, Carpinteria, California, USA), monoclonal anti‐Reg‐Iα,9 and polyclonal antigastrin (Dako) antibodies. After incubation with the primary (I‐A, B220, CD4, CD8, and CD11b) and biotin conjugated secondary (Ki‐67, Reg‐Iα, and gastrin) antibodies, sections were incubated with avidin‐biotin peroxidase complex (ABC Elite Kit; Vector Laboratories, Burlingame, California, USA). Then, sections were reacted with a fresh mixture of 0.05% 3,3′‐diaminobenzidine and 0.005% H2O2 in Tris buffered saline (0.05 M, pH 7.6). Nuclei were counterstained with methylgreen‐pyronin or haematoxylin.
Assessment of gastric mucosal cell proliferation
To analyse the proliferation status of gastric mucosal cells, the corpus mucosa was divided into the following three zones according to the Ki‐67 staining pattern. The neck zone was Ki‐67‐positive, and is where the proliferating progenitor cells are thought to be located. The upper zone with the surface mucous cells is from the upper boundary of the neck zone to the luminal surface of the gastric pits. The lower zone with parietal, chief, and endocrine cells spans between the base of the gastric glands and the basal boundary of the neck zone. Mucosal height was measured in each zone, and the results were averaged.
Assessment of myeloperoxidase activity
Myeloperoxidase (MPO) activity was measured according to the method of Bradley and colleagues.11 Tissue samples were homogenised three times in hexadecyltrimethylammonium bromide buffer using a Polytron homogeniser (Brinkman Instruments, Rexdale, Canada). The homogenate was centrifuged, and MPO activity in supernatants was measured. One unit of MPO activity was defined as the amount required to degrade 1 mM H2O2 in one minute at 25°C.
Reverse transcription‐polymerase chain reaction (RT‐PCR)
To analyse gene expression of interleukin (IL)‐1β, IL‐6, interferon (IFN)‐γ, tumour necrosis factor (TNF)‐α, Toll‐like receptor (TLR) 2, TLR‐4, and cyclooxygenase (COX)‐2 by RT‐PCR, total RNA was extracted from the murine stomach with the RNA extraction solution (Isogen; Nippon Gene, Tokyo, Japan) and then reverse transcribed into complementary DNA with the SuperScript Preamplification System (Gibco‐BRL, Gaithersburg, Maryland, USA). Total RNA in the reaction mixture was heated at 42°C for 50 minutes and at 70°C for another 15 minutes and then chilled on ice. PCR was performed with a mixture of complementary DNAs, 20 mM Tris‐HCl (pH 8.4), 50 mM KCl, 2.5 mM MgCl2, 200 mM of each deoxynucleotide triphosphate (Perkin‐Elmer, Branchburg, New Jersey, USA), 50 pM of each specific primer, and 1.0 U of Taq DNA polymerase (AmpliTaq Gold; Perkin‐Elmer). The primer sequences used in this study are shown in table 1.
Table 1 Primer sequences used in reverse transcription‐polymerase chain reaction.
| Gene size (bp) | Sense antisense |
|---|---|
| IL‐1β | 5′‐ATGGCAACTGTTCCTGAACTCAACT‐3′ |
| 563 bp | 5′‐CAGGACAGGTATAGATTCTTTCCTTT‐3′ |
| IL‐6 | 5′‐ATGAAGTTCCTCTCTGCAAGAGACT‐3′ |
| 638 bp | 5′‐CACTAGGTTTGCCGAGTAGATCTC‐3′ |
| IFN‐γ | 5′‐TGCATCTTGGCTTTGCAGCTCTTCCTCATGGC‐3′ |
| 365 bp | 5′‐TGGACCTGTGGGTTGTTGACCTCAAACTTGGC‐3′ |
| TNF‐α | 5′‐TTCTGTCTACTGAACTTCGGGGTGATCGGTCC‐3′ |
| 354 bp | 5′‐GTATGAGATAGCAAATCGGCTGACGGTGTGGG‐3′ |
| TLR‐2 | 5′‐TCTGGGCAGTCTTGAACATTT‐3′ |
| 321 bp | 5′‐AGAGTCAGGTGATGGATGTCG‐3′ |
| TLR‐4 | 5′‐AGAGTCAGGTGATGGATGTCG‐3′ |
| 406 bp | 5′‐CAAGGGATAAGAACGCTGAGA‐3′ |
| COX‐2 | 5′‐CACAGTACACTACATCCTGACC‐3′ |
| 393 bp | 5′‐TCCTCGCTTCTGATTCTGTCTTG‐3′ |
| β‐actin | 5′‐GTGGGCCGCTCTAGGCACCAA‐3′ |
| 540 bp | 5′‐CTCTTTGATGTCACGCACGATTTC‐3′ |
bp, base pair; IL, interleukin; IFN, interferon; TNF, tumour necrosis factor; TLR, Toll‐like receptor; COX, cyclooxygenase.
Amplification was performed with a thermal cycler (GeneAmp PCR System 9600R; Perkin‐Elmer) in 25–35 cycles for 20 seconds at 95°C, one minute at 55°C, and one minute at 72°C. A 10 μl aliquot of each PCR product was electrophoresed on a 2.0% agarose gel containing ethidium bromide. The densities of bands on the gels were measured by an image autoanalysing system (Fotodyne, FOTOanalyst and Archive ECLIPSE; Advanced American Biotechnology, Fullerton, California, USA) and expressed as the absorbance level. The semiquantitative level of each product was corrected for the β‐actin density of each sample.
Culture of gastric tissue
Gastric tissue samples were collected using an aseptic procedure. Culture of aerobic and anaerobic bacteria and fungi was performed in Miroku Medical Laboratory Inc. (Nagano, Japan) by plating samples on the following culture media: 5% sheep's blood agar, chocolatised sheep's blood agar, Drigalski agar, and brucella HK agar with haemolysed rabbit and defibrillated sheep blood. The plates were examined at appropriate time intervals, and isolated colony types were quantitated and identified to the species level using standard identification procedures.12
Serum gastrin measurements
Blood samples were collected and serum was frozen at −20°C. Serum gastrin levels were measured by radioimmunoassay with a commercially available kit (Gastrin‐RIAKIT II; Dinabot, Tokyo, Japan).13,14
Effect of gastrin on the stomach
To examine the effect of gastrin on gastric hyperplasia, one month old Aα0/0 mice were divided into two groups. The first group received vehicle (0.5% sodium carboxymethyl cellulose; pH 7.6) via a gastric tube once a day for three months. The second group was treated with the gastrin receptor antagonist AG‐041R (Chugai, Tokyo, Japan) diluted in the vehicle, at a dose of 100 mg/kg. AG‐041R is one of the most potent and specific antagonists for the gastrin receptor and this dose of AG‐041R blocks the receptor.15,16
Statistical analysis
All values were expressed as mean (SEM). Data were analysed using the Student's t test when two groups were compared. When multiple groups were compared, data were examined by one way analysis of variance followed by Fisher's protected least significant difference. A p value of less than 0.05 was accepted as statistically significant.
Results
Phenotypes of lymphocytes in the spleen
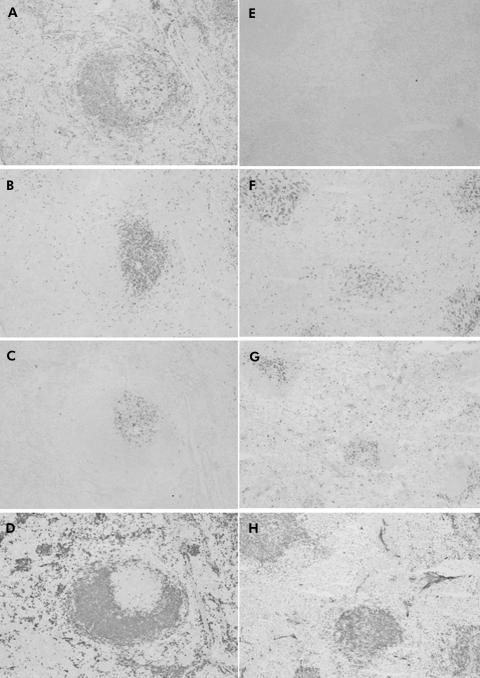
Immunohistologically, many I‐A positive cells were observed mainly in the B cell areas of the spleens of WT mice (fig 1A). In contrast, I‐A was deficient in the spleens of Aα0/0 mice (fig 1E). Compared with WT mice (fig 1B–D), CD4+ T cells (fig 1F), but not CD8+ (fig 1G) or B220+ (fig 1H) cells, were decreased in the spleen of Aα0/0 mice. These findings were compatible with previous reports of MHC class II deficient mice.1,2,3
Figure 1 Immunohistochemical staining for the spleen of wild‐type (WT) (A–D) and Aα0/0 mice (E–H) using antibodies for I‐A (A, E), CD4 (B, F), CD8 (C, G), and B220 (D, H). Many I‐A positive cells (A) were observed, mainly in the B220+ site (D) in the spleen of WT mice. Despite many B220+ cells (H), no I‐A positive cells were observed in Aα0/0 mice (E). The number of CD8+ cells was similar between WT mice (C) and Aα0/0 mice (G) but the number of CD4+ cells (F) was much smaller in Aα0/0 mice than in WT mice (B). Original magnification: A–H ×100.
Histological findings of the stomach
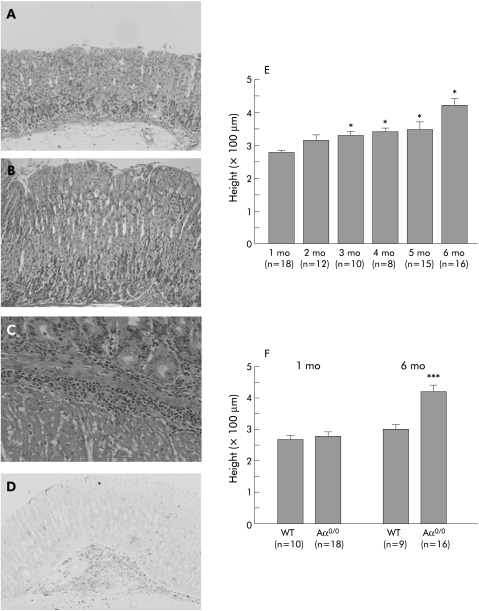
Compared with the gastric mucosa of six month old WT mice (fig 2A), that of Aα0/0 mice at the same age had hyperplasia with preserved parietal cells and prominent infiltration of CD11b+ granulocytes and macrophages (fig 2B–D). CD4+, CD8+, or B220+ cells were rarely observed (data not shown).
Figure 2 Histological findings of the stomach in wild‐type (WT) (A) and Aα0/0 (B–D) mice. The gastric mucosa of six month old Aα0/0 mice (B) had hyperplasia with preserved parietal cells and infiltration of CD11b+ polymorphonuclear cells (C, D) compared with that of WT mice (A). Mucosal height of Aα0/0 mice increased in a time dependent manner up to six months old (E). Mucosal height of WT and Aα0/0 mice was not significantly different at one month old (p = 0.47) but that of Aα0/0 mice was significantly greater than that of WT mice at six months old (p<0.001) (F). Results are expressed as mean (SEM). n = number of mice used and mo = month of age. ∗p<0.05, p = 0.47, and ∗∗∗p<0.001 compared with one month old Aα0/0 mice (E) and WT mice at the same age (F) by one way analysis of variance followed by Fisher's protected least significant difference (E) and the Student's t test (F), respectively. Original magnification: A, B ×200; C ×400; D ×100.
Gastric mucosal height was not significantly different between WT and Aα0/0 mice at one month old (p = 0.47). Gastric mucosal height of Aα0/0 mice however increased in a time dependent manner (fig 2E) and was significantly greater than that of WT mice at six months old (p<0.001) (fig 2F).
Proliferation of gastric corpus mucosal cells
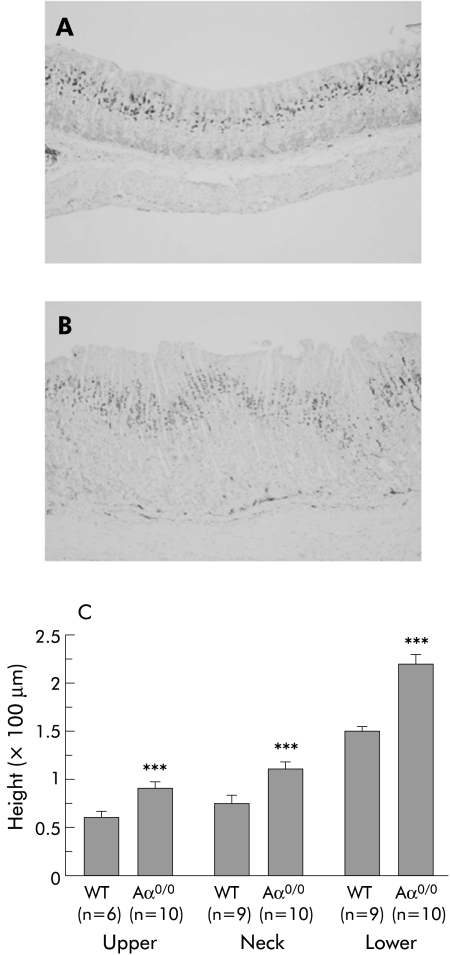
To assess the proliferation status of gastric mucosal cells, the corpus mucosa of six month old WT and Aα0/0 mice was stained for Ki‐67 as a marker of cell proliferation. Ki‐67 positive cells were restricted to the proliferating neck zone of the mucosa in WT mice (fig 3A). In contrast, the proliferative compartment was considerably expanded in the neck zone of Aα0/0 mice (fig 3B). Based on the Ki‐67 staining pattern, the height of each of the three zones of the gland (upper, neck, and lower) was measured in six month old WT and Aα0/0 mice. The height of the upper, neck, and lower zones in Aα0/0 mice was significantly greater than that in WT mice (p<0.001) (fig 3C).
Figure 3 Proliferation status of gastric corpus mucosal cells using Ki‐67 immunohistochemistry. There was a characteristic Ki‐67 staining pattern restricted to the proliferating neck zone in the mucosa of wild‐type (WT) mice (A). In contrast, the proliferative compartment was considerably expanded in Aα0/0 mice (B). At six months old, the height of the upper, neck, and lower zones in Aα0/0 mice, as divided by Ki‐67 signals, was significantly greater than that in WT mice (p<0.001) (C). Results are expressed as mean (SEM). n = number of mice used. ∗∗∗p<0.001 compared with the same mucosal zone of six month old WT mice by the Student's t test. Original magnification: A, B ×100.
MPO activity in the stomach
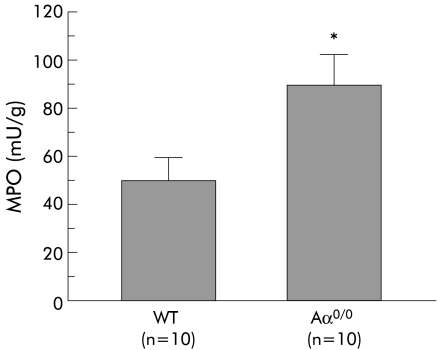
MPO activity in the stomach of six month old Aα0/0 mice (91.8 (14.1) mU/g, n = 10) was significantly higher than that of WT mice at the same age (51.2 (6.8) mU/g, n = 10) (p<0.05) (fig 4).
Figure 4 Myeloperoxidase (MPO) activity in the stomach of wild‐type (WT) and Aα0/0 mice at six months old. Results are expressed as mean (SEM). n = number of mice used. ∗p<0.05 compared with WT mice at the same age by the Student's t test.
Gene expression of proinflammatory cytokines, TLR‐2, TLR‐4, and COX‐2 in the stomach
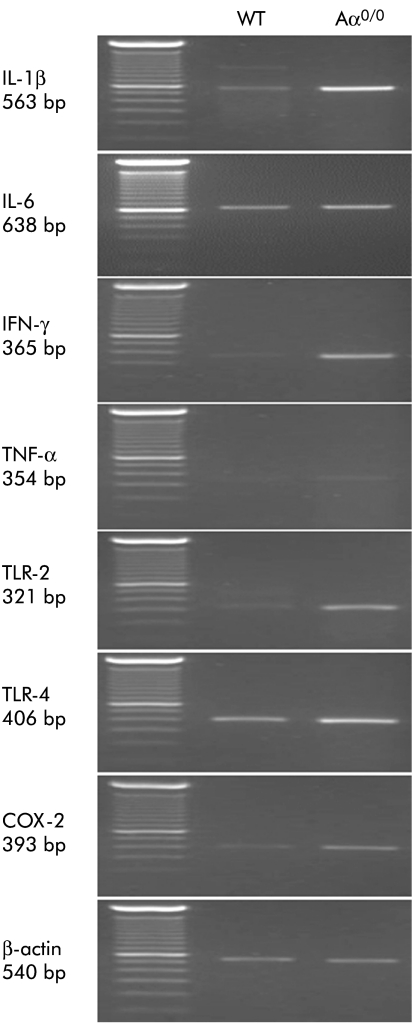
Compared with six month old WT mice, gene expression of IL‐1β, IFN‐γ, TLR‐2, TLR‐4, and COX‐2 was significantly upregulated in the stomach of Aα0/0 mice at the same age. Gene expression of IL‐6 and TNF‐α tended to increase in Aα0/0 mice but this was not statistically significant (fig 5, table 2).
Figure 5 Gene expression of interleukin (IL)‐1β, IL‐6, interferon γ (IFN‐γ), tumour necrosis factor α (TNF‐α), Toll‐like receptor 2 (TLR‐2) and 4 (TLR‐4), and cyclooxygenase 2 (COX‐2) in the stomach of wild‐type (WT) and Aα0/0 mice at six months old, as detected using reverse transcription‐polymerase chain reaction (PCR). PCR products were separated on 2.0% agarose gels and stained with ethidium bromide. Gene expression of IL‐1β, IFN‐γ, TLR‐2, TLR‐4, and COX‐2 was upregulated in Aα0/0 mice compared with WT mice. There was no significant difference in gene expression of IL‐6 and TNF‐α between WT mice and Aα0/0 mice.
Table 2 Comparison of gene expression in the stomachs of wild‐type (WT) and Aα0/0 mice determined by reverse transcription‐polymerase chain reaction.
| mRNA | Relative intensity of mRNA expression | p Value* | |
|---|---|---|---|
| WT | Aα0/0 | ||
| IL‐1β | 0.61 (0.15) | 7.21 (2.59) | <0.05 |
| IL‐6 | 3.90 (0.69) | 4.86 (0.74) | 0.36 |
| IFN‐γ | 0.21 (0.09) | 9.25 (3.44) | <0.05 |
| TNF‐α | 0.09 (0.04) | 0.30 (0.20) | 0.32 |
| TLR‐2 | 0.48 (0.08) | 5.69 (2.07) | <0.05 |
| TLR‐4 | 1.09 (0.22) | 8.17 (2.86) | <0.05 |
| COX‐2 | 0.54 (0.15) | 2.40 (0.53) | <0.01 |
IL, interleukin; IFN, interferon; TNF, tumour necrosis factor; TLR, Toll‐like receptor; COX, cyclooxygenase.
Values are means (SEM).
The densities of the bands were measured by an image autoanalysing system and corrected by using the β‐actin density of each sample. Samples were obtained from 10 stomachs of six month old mice in each group.
*p values were calculated using the Student's t test.
Bacterial culture of the stomach
Only a small amount of bacteria, which consisted of Escherichia coli, Enterococcus faecalis, and Gemella hemolysans, were detected in cultures of the stomach of Aα0/0 mice. Escherichia coli and Enterococcus faecalis were thought to be derived from mouse faeces. Gemella hemolysans is a low virulent Gram positive coccus and is part of the normal flora in the oral cavity and upper respiratory tract of many species of mammals. No fungi were detected in the stomach of Aα0/0 mice. These results were also observed in WT mice. There was no distinct difference between WT and Aα0/0 mice.
Gastric pH, serum gastrin levels, and immunohistochemistry for gastrin secreting cells in the stomach
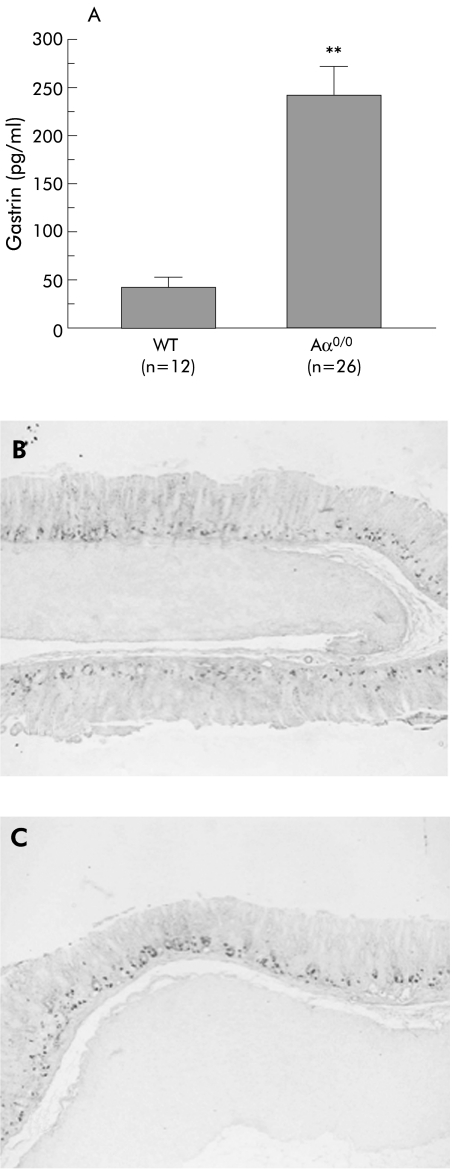
Fasting gastric pH in Aα0/0 mice (pH 2.1 (0.1), n = 44) was not significantly different from that in WT mice (pH 1.9 (0.1), n = 44) (p = 0.48). On the other hand, serum gastrin levels in Aα0/0 mice (239 (41.1) pg/ml, n = 26) significantly increased compared with those in WT mice (41 (7.6) pg/ml, n = 12) (p<0.01) (fig 6A). Immunohistochemistry for gastrin revealed that the number of gastrin secreting cells (G cells) in the antral mucosa in six month old Aα0/0 mice (1.7 (0.1)/gastric unit, n = 12) (fig 6C) did not significantly increase compared with that in WT mice at the same age (1.6 (0.1)/gastric unit, n = 9) (p = 0.29) (fig 6B).
Figure 6 Serum gastrin levels and immunohistochemical staining for gastrin secreting cells in wild‐type (WT) (B) and Aα0/0 mice (C). Serum gastrin levels in Aα0/0 mice significantly increased compared with those in WT mice (p<0.01) (A). There was no significant difference in the number of gastrin secreting cells in the antral mucosa of six month old WT (B) and Aα0/0 mice (C) using antigastrin antibody. Results are expressed as mean (SEM). n = number of mice used. ∗∗p<0.01 compared with WT mice by the Student's t test. Original magnification: B, C ×100.
Immunohistochemistry for Reg‐Iα in the stomach
A small number of Reg‐Iα positive cells, which consisted of enterochromaffin‐like cells and chief cells, were detected in the basal gland of the oxyntic mucosa of WT mice throughout this study. In contrast, although the number of Reg‐Iα positive cells in Aα0/0 mice was not different from that of WT mice at one month old (fig 7A), it increased in a time dependent manner in the gastric mucosa of Aα0/0 mice (fig 7B–D).

Figure 7 Immunohistochemical staining for Reg‐Iα in the stomach of Aα0/0 mice at one (A), two (B), five (C), and six (D) months old. Reg‐Iα positive cells increased in a time dependent manner in the basal gland of the oxyntic mucosa. At one month (A), there were a few Reg‐Iα highly positive wedge shaped cells, which are thought to be enterochromaffin‐like cells, in the visual field. At six months (D), however, there were many Reg‐Iα highly positive cells. Reg‐Iα weakly positive cells in the basal gland of the oxyntic mucosa are thought to be chief cells. Original magnification: A–D ×200.
Effects of administration of a gastrin receptor antagonist on the stomach of Aα0/0 mice
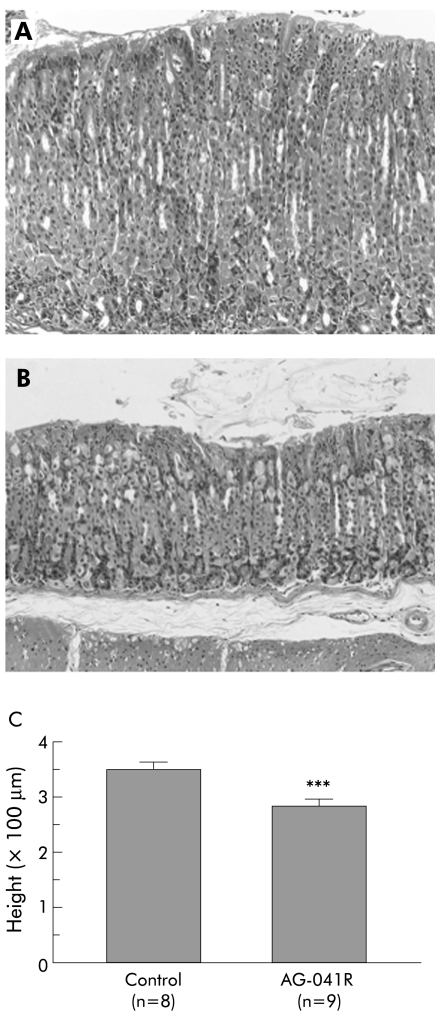
Compared with untreated Aα0/0 mice (n = 8) (fig 8A), administration of AG‐041R for three months significantly decreased the thickness of the corpus mucosa in Aα0/0 mice (n = 9; 278 (23) v 355 (17) μm; p<0.001) (fig 8B, C). Mucosal height of the AG‐041R treated group was not different from that of WT mice at the same age (four month old, average 278 μm, n = 11). Serum gastrin levels further increased in the AG‐041R treated group compared with untreated Aα0/0 mice (data not shown).
Figure 8 Effects of administration of the gastrin receptor antagonist (AG‐041R) on the stomachs of Aα0/0 mice. Mucosal thickness of Aα0/0 mice decreased after three month administration of AG‐041R (B) compared with control Aα0/0 mice that received vehicle alone (A). There was a significant difference in the height of the gastric mucosa of these two groups of mice (p<0.001) (C). Results are expressed as mean (SEM). n = number of mice used. ∗∗∗p<0.001 compared with control group of Aα0/0 mice by the Student's t test. Original magnification: A, B ×200.
Discussion
In the present study, MHC class II deficient (Aα0/0) mice developed prominent hyperplasia of the gastric mucosa, which was not accompanied by atrophic changes of the oxyntic mucosa as is often observed in the Helicobacter infected stomach. Importantly, mucosal hyperplasia was associated with hypergastrinaemia, and administration of a specific gastrin receptor antagonist significantly reduced mucosal hyperplasia, suggesting that gastrin is involved in hyperplasia of the gastric mucosa observed in Aα0/0 mice.
Helicobacter pylori infection occasionally induces hypertrophy of the gastric mucosa, as represented by giant fold gastritis.17,18 Moreover, patients with AIDS often develop hypertrophy of the gastric mucosa, which is usually associated with opportunistic infection in the stomach with microorganisms such as cytomegalovirus, cryptosporidium, Mycobacterium avium intracellulare complex, or toxoplasma.5,6,7,8 Interestingly, such hypertrophic changes observed in patients with Helicobacter pylori infection or in those with AIDS are reported to be reduced by eradicating the microorganisms in the stomach.6,17,18 Accordingly, such infections appear to have some role in the development of mucosal hypertrophy in those patients. In this study, however, we detected only a small amount of microbes in the stomachs of Aα0/0 mice, and none of specific pathogenic microorganisms, such as Helicobacter species, were detected. Thus it appears unlikely that overgrowth of pathogenic bacteria in the stomach is involved in gastric mucosal hyperplasia of Aα0/0 mice although we cannot rule out the possibility of chronic infection of microbes that was not detected by our culture study.
In spite of the presence of only a small amount of bacteria, however, we consistently found increased infiltration of CD11b+ cells such as granulocytes and macrophages as well as upregulation of MPO activity in the gastric mucosa of Aα0/0 mice compared with WT mice under the same breeding conditions. Moreover, gene expression of IL‐1β, IFN‐γ, TLR‐2, TLR‐4, and COX‐2 was significantly augmented in the stomachs of these mice. Because Aα0/0 mice have a limited number of CD4+ T cells and no MHC class II molecules on the surface of antigen presenting cells, they have very few functioning helper T cells and cannot produce effective antigen specific antibodies, thereby lacking adaptive immunity against various microorganisms.1,2,3,19 In such a deficient condition of adaptive immunity, it appears reasonable to suspect that innate immunity has a central role in defending against pathogenic organisms, and that might be the reason for the increased infiltration of granulocytes and macrophages and upregulation of various cytokines and TLRs in the gastric mucosa of MHC class II deficient (Aα0/0) mice. As noted above, however, only a small amount of bacteria was present in the stomach of those mice. Therefore, the precise mechanisms of prominent infiltration of granulocytes and macrophages in the gastric mucosa of Aα0/0 mice remains unclear. It might be due to chronic infection by unidentified microbes not detected by our culture study. Alternatively, it might result from generalised activation of innate immunity in the whole body of MHC class II deficient mice.
It is interesting that although serum gastrin levels in Aα0/0 mice were significantly higher than those of WT mice in our study, their fasting gastric pH was not different from that of WT mice. In this regard, Gillen et al demonstrated that Helicobacter induced gastritis reduced the sensitivity of the gastric mucosa to gastrin, resulting in elevated gastrin levels in association with apparently normal levels of acid secretion.20 Thus it is suggested that in our Aα0/0 mice, similar to Helicobacter induced gastritis, the increase in inflammatory infiltrates and overproduction of cytokines, such as IL‐1β, within the acid secretory mucosa, reduced the sensitivity of parietal cells and enterochromaffin‐like cells to gastrin. The fall in acid secretion due to this mechanism might cause a compensatory reaction of gastrin release, which then restores gastric acid secretion to near normal levels. On the other hand, several proinflammatory cytokines and chemokines, such as IL‐1β, IFN‐γ, TNF‐α, and IL‐8, increase gastrin secretion from G cells and at the same time affect somatostatin release from D cells.21,22,23 Thus the increase in gastrin secretion might be in part due to the enhanced production of some cytokines or chemokines that enhance gastrin release either directly or indirectly via a decrease in somatostatin release. Alternatively, as reported by Ofori‐Darko and colleagues,24 some bacterial proteins such as OmpA‐like protein might stimulate gastrin production. In patients with AIDS, gastric acid hyposecretion has been reported but hypergastrinaemia has been controversial. Moreover, the mechanisms leading to these alterations remain unknown.25,26,27
Because gastrin is a well known growth factor of the gastric mucosa,28,29,30 it is reasonable to consider that the elevated serum gastrin is involved in the mucosal hyperplasia of Aα0/0 mice. Indeed, in the present study, a specific gastrin receptor antagonist AG041R significantly reduced gastric mucosal thickness of Aα0/0 mice to the degree of WT mice. Of particular note is that mucosal hypertrophy observed in Aα0/0 mice consisted of hyperplasia of all three zones of the gastric mucosa; surface pit cell zone, proliferating neck zone, and glandular zone. These findings are consistent with observations that in addition to parietal cells and enterochromaffin‐like cells, cells at the neck zone also express gastrin receptors, indicating that multipotent proliferating cells are stimulated by gastrin.31 On the other hand, we also demonstrated a remarkable increase in Reg‐Iα positive cells in the hyperplastic oxyntic mucosa of Aα0/0 mice. The data appear to be consistent with findings that gastrin is a potent stimulator of Reg‐Iα gene expression as well as Reg‐Iα protein production.16,32,33 Because Reg‐Iα is a growth factor for gastrointestinal mucosa,9,16,33 it is possible that the growth promoting action of gastrin on the gastric mucosa in Aα0/0 mice is partly mediated by the increased production of Reg‐Iα induced by gastrin. In this regard, in contrast with our present observation, previously reported hypergastrinaemic mice such as gastrin transgenic mice are often associated with prominent hyperplasia of pit cells accompanied by glandular atrophy.28,29 Those data suggest that gastrin mainly enhances “upward” growth and differentiation in the gastric gland. In contrast, the gastric mucosa of Reg‐Iα transgenic mice is characterised by expansion of the glandular zone.34 Thus, in Aα0/0 mice, gastrin and Reg‐Iα might be working together by driving “upward” and “downward” growth and differentiation of the gastric mucosa, respectively. Sekikawa et al demonstrated that Reg‐Iα promoter activity in human gastric epithelial cells is enhanced by cytokines such as IL‐6 and IFN‐γ.35 Because gene expression of cytokines, including IFN‐γ, was increased in the gastric mucosa of Aα0/0 mice, increased cytokines, such as IFN‐γ, might also have roles in the increase in gastric mucosal hyperplasia through enhanced Reg‐Iα production. Apart from gastrin and Reg‐Iα, heparin binding epidermal growth factor‐like growth factor and amphiregulin might be involved in the mucosal hyperplasia of Aα0/0 mice to a certain extent because they are also reported to be induced by gastrin.36
In summary, persistent activation of innate immunity in the gastric microenvironment of MHC class II deficient (Aα0/0) mice induced hyperplasia of the gastric mucosa, and hypergastrinaemia appears to be involved in the hyperplasia of the gastric mucosa partly through Reg‐Iα production. In view of the defective immune function caused by the decrease in the number of CD4+ cells, MHC class II deficient mice are considered to be a possible animal model of AIDS. Interestingly, patients with AIDS often develop hypertrophy of the gastric mucosa induced by some types of opportunistic infection and, moreover, their gastric mucosa is infiltrated by many inflammatory cells, resembling MHC class II deficient (Aα0/0) mice.5,6,7,8 Thus whether or not similar mechanisms are working in the development of gastric mucosal hypertrophy in patients with AIDS is an interesting question to be elucidated in future studies.
Acknowledgements
We thank H Koda for his expert technical support. This study was supported by the Shimizu Foundation for the Promotion of Immunology Research and by a grant in aid for Scientific Research (A15209024 and 16790378) from the Japan Society for the Promotion of Science (JSPS).
Abbreviations
MHC - major histocompatibility complex
AIDS - acquired immunodeficiency syndrome
WT mice - wild‐type C57BL/6 mice
MPO - myeloperoxidase
IL - interleukin
IFN - interferon
TNF - tumour necrosis factor
TLR - Toll‐like receptor
COX - cyclooxygenase
RT‐PCR - reverse transcription‐polymerase chain reaction
bp - base pair
Footnotes
Conflict of interest: None declared.
References
- 1.Cosgrove D, Gray D, Dierich A.et al Mice lacking MHC class II molecules. Cell 1991661051–1066. [DOI] [PubMed] [Google Scholar]
- 2.Grusby M J, Johnson R S, Papaioannou V E.et al Depletion of CD4+ T cells in major histocompatibility complex class II‐deficient mice. Science 19912531417–1420. [DOI] [PubMed] [Google Scholar]
- 3.Kontgen F, Suss G, Stewart C.et al Targeted disruption of the MHC class II Aa gene in C57BL/6 mice. Int Immunol 19935957–964. [DOI] [PubMed] [Google Scholar]
- 4.Markowitz J S, Rogers P R, Grusby M J.et al B lymphocyte development and activation independent of MHC class II expression. J Immunol 19931501223–1233. [PubMed] [Google Scholar]
- 5.Pursner M, Haller J O, Berdon W E. Imaging features of Mycobacterium avium‐intracellulare complex (MAC) in children with AIDS. Pediatr Radiol 200030426–429. [DOI] [PubMed] [Google Scholar]
- 6.Falcone S, Murphy B J, Weinfeld A. Gastric manifestations of AIDS: radiographic findings on upper gastrointestinal examination. Gastrointest Radiol 19911695–98. [DOI] [PubMed] [Google Scholar]
- 7.Farman J, Lerner M E, Ng C.et al Cytomegalovirus gastritis: protean radiologic features. Gastrointest Radiol 199217202–206. [DOI] [PubMed] [Google Scholar]
- 8.Alpert L, Miller M, Alpert E.et al Gastric toxoplasmosis in acquired immunodeficiency syndrome: antemortem diagnosis with histopathologic characterization. Gastroenterology 1996110258–264. [DOI] [PubMed] [Google Scholar]
- 9.Asahara M, Mushiake S, Shimada S.et al Reg gene expression is increased in rat gastric enterochromaffin‐like cells following water immersion stress. Gastroenterology 199611145–55. [DOI] [PubMed] [Google Scholar]
- 10.Fukui T, Okazaki K, Tamaki H.et al Immunogenetic analysis of gastric MALT lymphoma‐like lesions induced by Helicobacter pylori infection in neonatally thymectomized mice. Lab Invest 200484485–492. [DOI] [PubMed] [Google Scholar]
- 11.Bradley P P, Priebat D A, Christensen R D.et al Measurement of cutaneous inflammation: estimation of neutrophil content with an enzyme marker. J Invest Dermatol 198278206–209. [DOI] [PubMed] [Google Scholar]
- 12.Murray P R, Baron E J, Pfaller M A.et alManual of clinical microbiology, 7th edn. Washington, DC: ASM Press 19991–1773.
- 13.McGuigan J E. Immunochemical studies with synthetic human gastrin. Gastroenterology 1968541005–1011. [PubMed] [Google Scholar]
- 14.Yalow R S, Berson S A. Radioimmunoassay of gastrin. Gastroenterology 1970581–14. [PubMed] [Google Scholar]
- 15.Chiba T, Kinoshita Y, Sawada M.et al The role of endogenous gastrin in the development of enterochromaffin‐like cell carcinoid tumors in Mastomys natalensis: a study with the specific gastrin receptor antagonist AG‐041R. Yale J Biol Med 199871247–255. [PMC free article] [PubMed] [Google Scholar]
- 16.Fukui H, Kinoshita Y, Maekawa T.et al Regenerating gene protein may mediate gastric mucosal proliferation induced by hypergastrinemia in rats. Gastroenterology 19981151483–1493. [DOI] [PubMed] [Google Scholar]
- 17.Gschwantler M, Bischof M, Singer E.et al Helicobacter pylori infection—clinical aspects and indications for treatment. Wien Med Wochenschr 2002152128–134. [DOI] [PubMed] [Google Scholar]
- 18.Muller H, Rappel S, Volkholz H.et al Lymphocytic gastritis—a rare disorder of the gastric mucosa. Pathologe 20012256–61. [DOI] [PubMed] [Google Scholar]
- 19.Grusby M J, Glimcher L H. Immune responses in MHC class II‐deficient mice. Annu Rev Immunol 199513417–435. [DOI] [PubMed] [Google Scholar]
- 20.Gillen D, el‐Omar E M, Wirz A A.et al The acid response to gastrin distinguishes duodenal ulcer patients from Helicobacter pylori‐infected healthy subjects. Gastroenterology 199811450–57. [DOI] [PubMed] [Google Scholar]
- 21.Lehmann F S, Stalder G A. Hypotheses on the role of cytokines in peptic ulcer disease. Eur J Clin Invest 199828511–519. [DOI] [PubMed] [Google Scholar]
- 22.Beales I, Calam J, Post L.et al Effect of transforming growth factor alpha and interleukin 8 on somatostatin release from canine fundic D cells. Gastroenterology 1997112136–143. [DOI] [PubMed] [Google Scholar]
- 23.Yamamoto S, Kaneko H, Konagaya T.et al Interactions among gastric somatostatin, interleukin‐8 and mucosal inflammation in Helicobacter pylori‐positive peptic ulcer patients. Helicobacter 20016136–145. [DOI] [PubMed] [Google Scholar]
- 24.Ofori‐Darko E, Zavros Y, Rieder G.et al An OmpA‐like protein from Acinetobacter spp. stimulates gastrin and interleukin‐8 promoters. Infect Immun 2000683657–3666. [DOI] [PMC free article] [PubMed] [Google Scholar]
- 25.Lake‐Bakaar G, Quadros E, Beidas S.et al Gastric secretory failure in patients with the acquired immunodeficiency syndrome (AIDS). Ann Intern Med 1988109502–504. [DOI] [PubMed] [Google Scholar]
- 26.Welage L S, Carver P L, Revankar S.et al Alterations in gastric acidity in patients infected with human immunodeficiency virus. Clin Infect Dis 1995211431–1438. [DOI] [PubMed] [Google Scholar]
- 27.Fabris P, Pilotto A, Bozzola L.et al Serum pepsinogen and gastrin levels in HIV‐positive patients: relationship with CD4+ cell count and Helicobacter pylori infection. Aliment Pharmacol Ther 200216807–811. [DOI] [PubMed] [Google Scholar]
- 28.Nakajima T, Konda Y, Izumi Y.et al Gastrin stimulates the growth of gastric pit cell precursors by inducing its own receptors. Am J Physiol Gastrointest Liver Physiol 2002282G359–G366. [DOI] [PubMed] [Google Scholar]
- 29.Nakajima T, Konda Y, Izumi Y.et al Gastrin interferes with the differentiation of gastric pit cells and parietal cells. Aliment Pharmacol Ther 200216(suppl 2)3–9. [DOI] [PubMed] [Google Scholar]
- 30.Jensen R T. Involvement of cholecystokinin/gastrin‐related peptides and their receptors in clinical gastrointestinal disorders. Pharmacol Toxicol 200291333–350. [DOI] [PubMed] [Google Scholar]
- 31.Kazumori H, Ishihara S, Kawashima K.et al Analysis of gastrin receptor gene expression in proliferating cells in the neck zone of gastric fundic glands using laser capture microdissection. FEBS Lett 2001489208–214. [DOI] [PubMed] [Google Scholar]
- 32.Fukui H, Franceschi F, Penland R L.et al Effects of Helicobacter pylori infection on the link between regenerating gene expression and serum gastrin levels in Mongolian gerbils. Lab Invest 2003831777–1786. [DOI] [PubMed] [Google Scholar]
- 33.Kinoshita Y, Ishihara S, Kadowaki Y.et al Reg protein is a unique growth factor of gastric mucosal cells. J Gastroenterol 200439507–513. [DOI] [PubMed] [Google Scholar]
- 34.Miyaoka Y, Kadowaki Y, Ishihara S.et al Transgenic overexpression of Reg protein caused gastric cell proliferation and differentiation along parietal cell and chief cell lineages. Oncogene 2004233572–3579. [DOI] [PubMed] [Google Scholar]
- 35.Sekikawa A, Fukui H, Fujii S.et al REG Ialpha protein may function as a trophic and/or anti‐apoptotic factor in the development of gastric cancer. Gastroenterology 2005128642–653. [DOI] [PubMed] [Google Scholar]
- 36.Kinoshita Y, Ishihara S. Mechanism of gastric mucosal proliferation induced by gastrin. J Gastroenterol Hepatol 200015(suppl)D7–11. [DOI] [PubMed] [Google Scholar]


