Abstract
Background and aims
Recent studies with μ opioid receptor (MOR) deficient mice support a physiological anti‐inflammatory effect of MOR at the colon interface. To better understand the potential pharmacological effect of certain opiates in inflammatory bowel diseases (IBD), we (1) evaluated the regulation in vivo and in vitro of human MOR expression by inflammation; and (2) tested the potential anti‐inflammatory function of a specific opiate (DALDA) in inflamed and resting human mucosa.
Patients and methods
Expression of MOR mRNA and protein was evaluated in healthy and inflamed small bowel and colonic tissues, isolated peripheral blood mononuclear cells and purified monocytes, and CD4+ and CD8+ T cells from healthy donors and IBD patients. The effect of cytokines and nuclear factor κB (NFκB) activation on MOR expression in lymphocyte T and monocytic human cell lines was assessed. Finally, DALDA induced anti‐inflammatory effect was investigated in mucosal explants from controls and IBD patients.
Results
MOR was expressed in ileal and colonic enteric neurones as well as in immunocytes such as myeloid cells and CD4+ and CD8+ T cells. Overexpressed in active IBD mucosa, MOR was significantly enhanced by cytokines and repressed by NFκB inhibitor in myeloid and lymphocytic cell lines. Furthermore, ex vivo DALDA treatment dampened tumour necrosis factor α mRNA expression in the colon of active IBD patients.
Conclusions
Given the increased expression of MOR and the ex vivo beneficial effect of DALDA in active IBD, natural and/or synthetic opioid agonists could help to prevent overt pathological intestinal inflammation.
Keywords: mu opioid receptors, intestinal inflammation, inflammatory bowel diseases
The µ opioid receptor (MOR) is a G protein coupled receptor,1 widely expressed in the central nervous system2,3,4 and peripheral tissues.5,6,7 Activation of MOR by endogenous or exogenous agonists has a pleiotropic action on immune and physiological processes, such as microbial infections, pain relief, analgesia, respiratory depression, euphoria, and addiction.8,9 Notably, the effect of opiates is complex and mediated through regulatory transcription factors, such as RXR, nuclear factor κB (NFκB), AP‐2, SOX, and/or Sp1/Sp3.10,11,12 Although the analgesic role of MOR in the central nervous system has been largely described, the physiological and beneficial roles of MOR activation in human gastrointestinal tract remain elusive.
Recently, we and others have shown that MOR is involved in the homeostatic regulation of immunological and inflammatory reactions in the mouse gastrointestinal tract.13,14,15,16,17 Notably, systemic administration of selective synthetic MOR agonists prevented colitis in hapten induced and T cell dependent experimental models of colitis, and increased susceptibility to colitis is observed in a MOR dependent manner.16 Consistently, complementary results suggested that MOR exerts its anti‐inflammatory effect in the colon through regulation of cytokine production and/or T cell proliferation,9 but further experiments are required to better understand the physiopathological role and therapeutic effects of, respectively, MOR and their specific agonists in inflammatory bowel diseases (IBD).
MOR activating peptides (such as β‐endorphin) affect intestinal motility, secretion, and immune and inflammatory responses,18,19,20,21,22 suggesting that abnormal content of such peptides in the gastrointestinal tract and/or in peripheral blood might influence IBD pathogenesis.23 Whereas the distribution of certain gut neuropeptides (that is, substance P) have been extensively studied,24 regulation and function of MOR and its ligand in the human gut have not yet been investigated.
Herein we explored and compared the expression, regulation, and function of MOR in controls and in patients with IBD. We provide evidence that inflammatory molecules increased in vitro and in vivo MOR expression in myeloid and lymphocytic cells. Furthermore, using organ cultures of colonic biopsies, we found that a selective peripheral MOR agonist can modulate locally the production of tumour necrosis factor α (TNF‐α). Taken together, these data confirm the physiological role of MOR in the regulation of human intestinal inflammation and the potential therapeutic benefit of using selective peripheral MOR agonists in IBD.
Materials and methods
Reagents
[D‐Arg2, Lys4]‐Dermophin‐(1‐4)‐amide (DALDA) was purchased from Sigma‐Aldrich (Saint‐Quentin Fallavier, France). The recombinant cytokines TNF‐α, interleukin 1β (IL‐1β), and interferon‐γ (IFN‐γ) were obtained from Sigma‐Aldrich. The chemical inhibitor of the NFκB signalling pathway (namely CAPE (caffeic acid phenethyl ester)) was obtained from Sigma‐Aldrich.
Patients' biopsies
The diagnosis of ulcerative colitis (UC) and Crohn's disease (CD) was established using standard criteria. Transparietal ileal and colonic samples were taken during surgery from 54 subjects (37 IBD patients and 17 controls). Mean duration of CD and UC was 6.6 (2) years and 2.9 (1) years, respectively. Most IBD patients (27/37, 73%) received medical treatments—that is, steroids (n = 8), salicylates (n = 10), ciclosporin (n = 6), and antibiotics (n = 3)—during the three months before surgery. Patients and controls taking opioids on a regular basis were excluded. Preoperatively, all patients and controls received a benzodiazepine (midazolam 0.1 mg/kg) and anaesthesia was induced with morphine (sufentanil 0.5 µg/kg) supplemented with propofol 2 mg/kg. Inflamed and/or macroscopically/histologically healthy ileal and/or colonic biopsies were collected from 25 patients with CD (16 females, nine males; mean age 31 years (range 18–44)) undergoing ileocolectomy. Colonic samples from inflamed and/or healthy areas were obtained from 12 patients undergoing colectomy for acute UC (four females, eight males; mean age 41 years (range 20–62)). As controls, surgical ileal and colonic biopsies taken from healthy areas were sampled under the same conditions in 17 non‐IBD patients, including 14 patients with colon cancer (five females, nine males; mean age 63 years (range 39–81)) and three with diverticular disease (one female, two males; mean age 54 years (range 39–74)). One fragment of these specimens was sent for histological analysis, paraffin embedded, and stained with haematoxylin‐eosin. The remaining portion was immediately frozen in liquid nitrogen and stored at −80°C for analysis of MOR expression by real time reverse transcription‐polymerase chain reaction (RT‐PCR) and immunochemistry.
Peripheral blood mononuclear cells from patients and controls
Peripheral blood mononuclear cells (PBMC) were separated on a Ficoll gradient (Amersham Pharmacia Biotech) and washed in phosphate buffered saline (PBS) until analysis of MOR and TNF‐α by real time PCR and immunohistochemistry. Peripheral blood was collected from 24 patients with CD (17 females, seven males; mean age 32 years (range 19–57)), 16 patients with UC (four females, 12 males; mean age 40 years (range 18–56)), and 23 patients with IBS (13 females, 10 males; mean age 47 years (range 25–71)) (table 1). Mean duration of CD and UC was 6 (1.9) years and 6.1 (1.8) years, respectively. Ten patients with CD were in remission with a low CD activity index (CDAI <150) and 14 had moderately active disease (220<CDAI<350). Among the 16 UC patients, six were in remission and 10 had clinically mild UC.
Table 1 Characteristics and respective treatments of patients included for µ opioid receptor expression analysis in peripheral blood mononuclear cells.
| Disease status | Age (y) | Sex (F/M) | Clinical manifestations (n) | Therapeutic management (n) |
|---|---|---|---|---|
| Crohn's disease | 32 (9) | 17/7 | Ileal (7) | None (4) |
| Ileocolonic (11) | Immunosuppressors (16) | |||
| Colonic (6) | Steroids (2) | |||
| Aminosalicylics (2) | ||||
| Ulcerative colitis | 40 (10) | 4/12 | Colonic (16) | None (4) |
| Aminosalicylics (3) | ||||
| Steroids (4) | ||||
| Aminosalicylics and steroids (2) | ||||
| Immunosuppressors (3) | ||||
| Controls | 47 (14) | 13/10 | None (23) |
Monocytes, CD8+, and CD4+ T cells were further purified using magnetic activated cell sorting, as previously described.25,26 Monocytes were isolated from PBMC by positive immunoselection using anti‐CD4 monoclonal antibody (mAb) coated magnetic microbeads, according to the manufacturer's protocol (Miltenyi Biotec, Paris, France). CD8+ T cells were subsequently purified from the negative cell fraction by positive immunoselection with anti‐CD8 mAb coated magnetic microbeads (Miltenyi Biotec). CD4+ T cells were then obtained from the retaining unbound cell fraction by depletion of CD8, CD14, CD16, CD19, CD36, CD56, CD123, T cell receptor γ/δ, and glycophorin A cells (Miltenyi Biotec). Cell purification was assessed by flow cytometry analysis (FACScalibur; BD Biosciences, Le Pont de Claix, France) with fluorescein isothiocyanate labelled CD8, phycoerythrin labelled CD4, and allophycocyanine labelled CD14 antibodies (Miltenyi Biotec). Mean purity was 71 (7)% for monocytes, 88 (5)% for CD4+ T cells, and 90 (3)% for CD8+ T cells.
Analysis of MOR mRNA expression
Human T lymphocyte (Jurkat) and monocytic (THP1) cell lines were routinely grown in RPMI 1640 medium supplemented with 10% heat inactivated fetal bovine serum (Eurobio) in a humidified chamber at 37°C in 5% CO2 and 95% relative humidity. Regulation of MOR expression by the TNF‐α, IL‐1β, or IFN‐γ pathway was evaluated after two hours of cytokine stimulation at 10 ng/ml of Jurkat and THP1 cell lines, preincubated or not for two hours with CAPE 10 µg/ml. All experiments were performed in triplicate and repeated three times for reproducibility. Cell viability was determined by trypan blue exclusion. After washing, cells were collected for RNA extraction and quantification of MOR and TNF‐α mRNA by real time RT‐PCR.
Total RNA was isolated from cells and intestinal tissues using Rneasy kits (Macherey Nagel, Hoerdt, France) according to the manufacturer's instructions. RNA quantification was performed using spectrophotometry. After treatment at 37°C for 30 minutes with 20–50 units of RNase free DNase I (Roche Diagnostics Corporation, Meylan, France), oligo‐dT primers (Roche Diagnostics Corporation) were used to synthesise single stranded cDNA. MOR and TNF‐α mRNAs were quantified using SYBR green Master Mix (Applera, Courtaboeuf, France) with specific human oligonucleotides (table 2) in a GeneAmp Abiprism 7000 (Applera). In each assay, calibrated and no‐template controls were included. Each sample was run in triplicate. SYBR green dye intensity was analysed using the Abiprism 7000 SDS software (Applera). The size of human MOR and TNF‐α PCR products for each set of primers was tested after ethidium bromide staining on agarose gel (3%). Human MOR and TNF‐α PCR products were sequenced using ABI PRISM 377 XL (Applied Biosystems, Foster City, California, USA). All results were normalised to the unaffected housekeeping human gene β‐actin.
Table 2 Human primer sequences for quantitative real time polymerase chain reaction (F, forward; R, reverse).
| Primer name | Sequence |
|---|---|
| β‐actin F | 5′‐TCA CCC ACA CTG TGC CCA TCT ACG‐3′ |
| β‐actin R | 5′‐CAG CGG AAC CGC TCA TTG CCA ATG‐3′ |
| TNF‐α F | 5′‐GGA GAA GGG TGA CCG ACT CA‐3′ |
| TNF‐α R | 5′‐CTG CCC AGA CTC GGC AA‐3′ |
| MOR F | 5′‐ATG CCA GTG CTC ATC ATT AC‐3′ |
| MOR R | 5′‐GAT CCT TCG AAG ATT CCT GTC CT‐3′ |
MOR, µ opioid receptor; TNF‐α, tumour necrosis factor α.
Analysis of MOR protein expression
Immunodetection of MOR was performed on both paraffin embedded and cryostat sections and also on Jurkat and THP1 cell lines preincubated with 3% H2O2 methanol for 20 minutes in order to quench endogenous peroxidase activity. Then, sections were blocked for 15 minutes with 5% milk, 0.1% bovine serum albumin in phosphate buffer saline, and incubated for 30 minutes with the primary rabbit polyclonal antibody directed against MOR at room temperature (dilution 1:500; Diasorin, Stillwater, California, USA). After a wash with PBS, sections were incubated for 30 minutes with EnVision horseradish peroxidase conjugate (Dako, Trappes, France) at room temperature. Sections were faintly counterstained with Harris haematoxylin, rinsed with distilled water, and coverslipped with glycerol. The number of MOR immunoreactive cells was counted in five different high power fields and expressed per 100 stromal cells. Only cells with a clearly detectable nucleus were counted. Sections from pituitary gland were used as positive controls. Negative controls consisted of omission of the first antibody and use of normal rabbit immunoglobulins (Dako) instead of primary antibody.
Double immunohistochemistry was performed on cryostat sections. After incubation with the primary rabbit polyclonal antibody directed against MOR, sections were rinsed and subsequently incubated for 30 minutes with Envision+peroxidase (Dako) and washed again with PBS. The reaction product was visualised by incubation for 10 minutes in 0.05 M acetate buffer at pH 4.9 containing 0.05% 3‐amino‐9‐ethylcarbazole and 0.01% H2O2, resulting in red immunoreactive staining. Subsequently, sections were rinsed with PBS, washed with distilled water, and incubated for 30 minutes with the second primary antibody directed against CD4 (clone MT310; dilution 1/100; Dako) or CD8 (clone C8/144B; dilution 1/100; Dako). After a wash with PBS, sections were incubated for 30 minutes with a biotin labelled rabbit antimouse antibody followed by a monoclonal antibiotin‐alkaline phosphatase conjugate (Sigma‐Aldrich). The blue reaction product was developed using Fast Blue BB sal (4‐benzoylamino‐2,5‐diethoxybenzene‐diazonium chloride; Sigma‐Aldrich) for five minutes. Finally, sections were faintly counterstained with Harris haematoxylin, rinsed with distilled water, and coverslipped with mounting media. Results were independently analysed by two observers and matched.
Culture of intestinal biopsy specimens from patients
Six colonic biopsies were taken from a healthy area in patients with CD (n = 6, four females, two males; mean age 35 years (range 19–61)), UC (n = 3, three males; mean age 29 years (range 26–31)), and irritable bowel syndrome (n = 3, two females, one male; mean age 40 years (range 34–51)). Patients with irritable bowel syndrome received no specific medical treatment at the time of endoscopy. Six of the nine IBD patients received salicylates (n = 2), steroids (n = 3), or azathioprine (n = 1). Mean duration of CD and UC was 14.2 (3.4) and 5.5 (2.2) years, respectively. None of these patients had active disease at the time of endoscopy. Biopsies were immediately placed in HBSS‐CMF supplemented with 100 IU/ml penicillin and 100 mg/ml streptomycin for 24 hour organ culture. After washing, endoscopic biopsies were incubated in a humidified atmosphere for 24 hours at 37°C in six well tissue culture plates containing 2 ml RPMI 1640 supplemented or not with the selective MOR agonist [D‐Arg2, Lys4]‐Dermophin‐(1‐4)‐amide (DALDA) 1 and 10 µM.27 Supernatants were removed, filtered, and stored at −80°C for lactate dehydrogenase release determination, and biopsies were processed to quantify TNF‐α mRNA by real time RT‐PCR.
Statistics
Data are expressed as mean (SEM). All comparisons were analysed by the Mann‐Whitney test. Statistical analyses were performed using the StatView 4.5 statistical program (Proxyd). Differences were considered significant when the p value was <0.05.
Results
Quantification of MOR mRNA levels in ileal and colonic tissues of IBD patients and controls
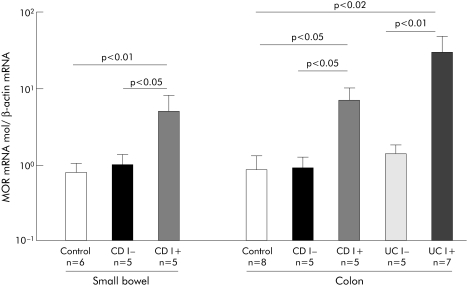
MOR mRNA was quantified by real time RT‐PCR in the healthy and inflamed transparietal ileal and colonic specimens of patients with IBD and controls. MOR mRNA levels were similar between the healthy ileal and colonic samples of IBD patients and controls. Importantly, a mean 6–7‐fold increase in MOR expression was observed in inflamed CD ileal and colonic tissues compared with healthy intestine (respectively, 6.5 (2.9) v 0.99 (0.35) (p<0.05) and 7.03 (0.05) v 0.88 (0.39) (p<0.05)). Similarly, a 30‐fold increase in expression of MOR mRNA levels was observed in inflamed compared with non‐inflamed colon of UC patients (30.3 (19.2) v 1.4 (0.4), respectively; p<0.01) (fig 1). Given the low number of patients in the present study, we could not test for any significant differences in MOR mRNA levels from IBD patients according to different medical treatments.
Figure 1 Mu opioid receptor (MOR) mRNA in patients with inflammatory bowel disease. Quantification of MOR mRNA in inflamed (I+) and non‐inflamed (I−) small bowel and colon of controls and patients with Crohn's disease (CD) or ulcerative colitis (UC). Number of patients and statistical significance are indicated, and results are expressed as mean (SEM).
Identification of the cellular sources of MOR in IBD patients
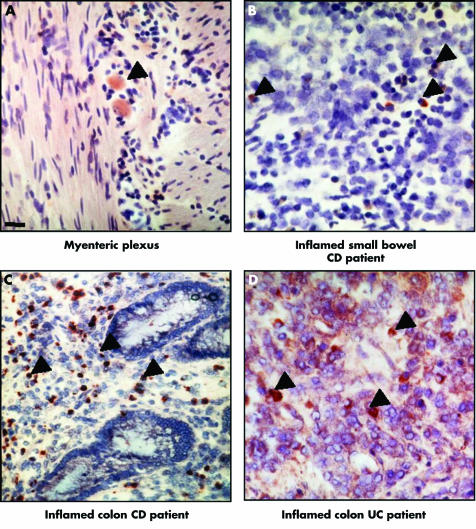
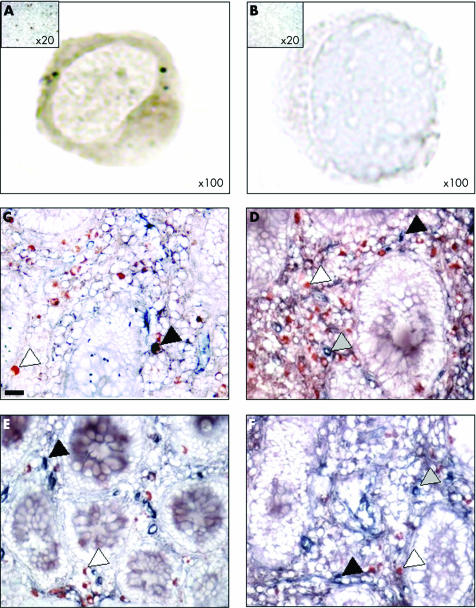
To investigate the distribution of intestinal cells expressing MOR in health and disease, we performed immunohistochemistry using an antibody directed against MOR in the healthy and inflamed ileum and colon of our cohort of patients (fig 2). In all healthy ileal and colon samples of IBD patients and controls, MOR protein was mainly and similarly detected in less than 1% of lamina propria mononuclear cells (LPMC) as well as in neuronal cell bodies located in the submucosal and myenteric plexuses (fig 2A). No specific staining was constantly observed in epithelial, endothelial, or smooth muscle cells. Consistent with our preliminary RT‐PCR data, the pattern of stained cells was significantly different in the inflamed intestine of IBD patients with increased MOR staining limited to LPMC reaching approximately 4–10% and 11–15% of stromal cells, respectively, in the inflamed tissues of patients with CD and UC (fig 2B–D) and was undetectable in LPMC from controls. Compared with healthy small bowel or colon specimens, we failed to detect any significant increase in the numbers of MOR immunopositive nerve cells bodies in the inflamed tissues of IBD patients. Ileal and colonic tissues of patients with CD and UC revealed positive staining for MOR in approximately 10% and 30% of lamina propria CD4+ and CD8+ T cells, respectively (fig 3). No detectable double staining was observed in control patients (data not shown). Controls omitting the first antibody or the use of an irrelevant antibody were negative.
Figure 2 Immunolocalisation of μ opioid receptor (MOR) in the gut of patients with inflammatory bowel disease (IBD). (A–D) MOR immunoreactive cells (black arrows) from a representative IBD patient in (A) the myenteric plexus of non‐inflamed small bowel; (B–D) lamina propria mononuclear cells from (B) inflamed small bowel, (C) colon, and (D) inflamed colon. CD, Crohn's disease; UC, ulcerative colitis. Magnification ×40. Scale bar represents 5 μm.
Figure 3 Mu opioid receptor (MOR) immunoreactive cells in peripheral blood mononuclear cells (PBMC) and mucosal CD4+ and CD8+ T cells of patients with inflammatory bowel disease. (A, B) MOR immunostaining in PBMC of one representative Crohn's disease (CD) patient and the corresponding negative control (magnification ×100). The control, consisting of normal rabbit immunoglobulins, was negative. Insert: low magnification ×20 of MOR immunostaining of a CD patient and control. (C–F) Double immunostaining for MOR (red) and CD4 (blue) (C, D) or MOR (red) and CD8 (blue) (E, F) (original magnification ×400) in biopsies taken from one patient with CD in non‐inflamed (C, E) and inflamed (D, F) areas. Whereas only a few CD4+ and CD8+ cells stained positively with the antibody directed against MOR in the non‐inflamed mucosa, an increased number of CD4+ T cells (blue), MOR+ (red), and CD4+/MOR+ cells were observed in the inflamed mucosa of the CD patient. Scale bar represents 5 μm.
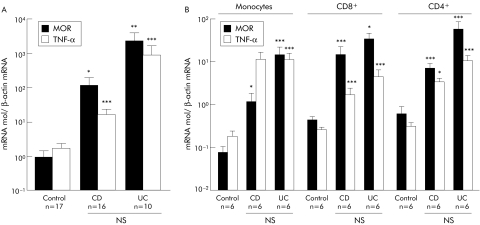
As MOR overexpressing LPMC within intestinal inflammatory sites associated with CD and UC are mainly recruited from the peripheral blood circulation, we compared expression of MOR mRNA in PBMC of IBD patients and controls without inflammation (fig 4A). Irrespective of the inflammatory status of IBD patients, levels of MOR mRNA were significantly increased in PBMC of CD (112 (89)) and UC (2267 (1870)) patients compared with controls (0.9 (0.5); p<0.05 and p<0.02, respectively) (fig 4A). No significant differences in MOR mRNA levels were found between PBMC of CD and UC patients. Furthermore, 55 (13)% of the PBMC from IBD patients revealed cytoplasmic and membranous MOR staining (fig 3). In order to determine the precise in vivo phenotype of MOR expressing cells, we used immunoselection to purify monocytes, CD4+, and CD8+ T cells of IBD patients and controls. Independent of the clinical status of the IBD patients, monocyte and T cell MOR mRNA levels were significantly higher than in controls and paralleled TNF‐α mRNA levels (fig 4B). Taken together, these results suggest that peripheral blood, activated LPMC, and infiltrated T cells are major sources of MOR, providing a possible explanation for the local increase in MOR expression in active IBD mucosa.
Figure 4 Mu opioid receptor (MOR) and tumour necrosis factor α (TNF‐α) mRNA expression in patients with inflammatory bowel disease and in controls. Quantification of MOR and TNFα mRNA by real time reverse transcription‐polymerase chain reaction in (A) peripheral blood mononuclear cells and (B) purified monocytes, CD4+, and CD8+ T cells of patients with Crohn's disease (CD), ulcerative colitis (UC), and controls. The number of patients and statistical significance are indicated, and results are expressed as mean (SEM). *p<0.05, **p<0.02, ***p<0.01.
MOR expression is regulated through the TNF‐α, IL‐1β, and IFN‐γ pathways
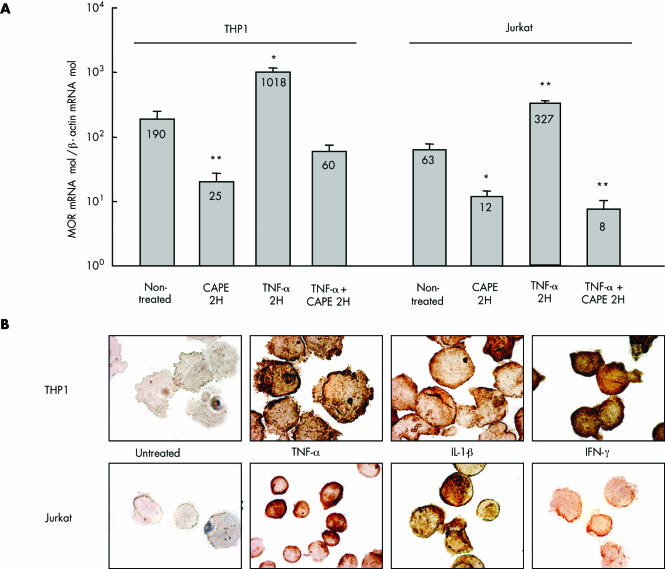
To further investigate the mechanism of enhancement of MOR in inflamed intestinal tissues and PBMC in IBD, we looked at regulation of MOR expression by inflammatory mediators. We determined if TNF‐α, IL‐1β, or IFN‐γ were able to induce MOR expression in Jurkat and THP1 cell lines. Incubation with TNF‐α significantly upregulated MOR mRNA expression by approximately fivefold compared with untreated Jurkat or THP‐1 cells (fig 5A). Furthermore, this result was confirmed at the protein level in Jurkat and THP‐1 cell lines stimulated with either TNF‐α, IL‐1β, or IFN‐γ (fig 5B). This increased expression of MOR mRNA by TNF‐α was suppressed when cells were preincubated with CAPE (fig 5A). Similarly, downregulation of MOR mRNA expression was observed in non‐activated Jurkat and THP1 cells incubated with CAPE compared with untreated cells (fig 5A). These results suggest that NFκB is involved in the steady state and TNF‐α induced MOR expression in monocytes and T cells.
Figure 5 Cytokine induced regulation of μ opioid receptor (MOR) in the lymphocytic (Jurkat) and monocytic (THP1) human cell lines. (A) Quantification of MOR mRNA in Jurkat and THP1 cell lines treated with caffeic acid phenethyl ester (CAPE) for two hours (2H), tumour necrosis factor α (TNF‐α), and TNF‐α+CAPE compared with non‐treated cells. Statistical significance compared with non‐treated cells is indicated and results are expressed as mean (SEM). *p<0.05, **p<0.01. (B) MOR immunostaining in Jurkat and THP1 cell lines treated or not for two hours with TNF‐α, interferon γ (IFN‐γ), and interleukin 1β (IL‐1β) (magnification ×1000). Control consisting of the use of normal rabbit immunoglobulins was negative.
MOR agonist DALDA reduced TNF‐α production in human colonic mucosa
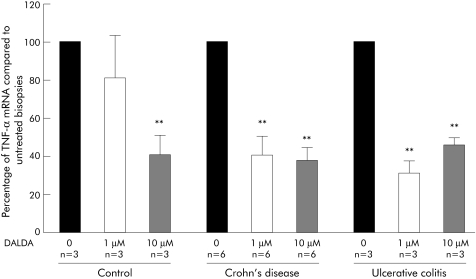
To test the hypothesis that DALDA can dampen human intestinal inflammation, we evaluated the effects on TNF‐α mRNA production of the specific MOR agonist DALDA in organ cultures of healthy colonic biopsies from nine untreated IBD patients (six CD, three UC) and three controls. After 24 hours of culture, we observed a 60% decrease in TNF‐α mRNA production in biopsies from CD and UC patients cultured with DALDA 1 or 10 µM compared with non‐treated biopsies (fig 6). In controls, a significant 60% decrease in production of TNFα mRNA was also observed when biopsies were cultured with DALDA 10 µM (fig 6). Release of lactate dehydrogenase from specimens in culture remained low and stable over the 24 hour period, which was not influenced by the presence of DALDA in the medium (data not shown).
Figure 6 Effect of [D‐Arg2, Lys4]‐Dermophin‐(1‐4)‐amide (DALDA) on tumour necrosis factor α (TNF‐α) production in organ cultures of colonic biopsies. Levels of TNF‐α mRNA quantified by real time polymerase chain reaction in human colon biopsies after 24 hours of culture with medium alone (0) and two concentrations of DALDA (1 µM and 10 µM). Number of samples and statistical significance are indicated. Results are expressed as mean (SEM) fold inhibition compared with control (medium alone). Number of experiments and statistical significance (**p<0.01) are indicated.
Discussion
Mu, delta, and kappa opioid receptors are expressed throughout the nervous system in neurones, the spinal cord, midbrain, and cortex.2,3,4,28 Intestinal expression of MOR has been reported in different animal species, with particular abundance in the myenteric and submucosal plexuses6,29 and in lesser amounts on epithelial cells from guinea pig intestinal crypts30 and porcine jejunum.31 Although it is well established that MOR expression in the central nervous system mediates central pain modulation,32 our knowledge regarding its location, regulation, and function in the gut is less advanced. Using real time RT‐PCR and immunohistochemistry, expression of MOR was present in a fraction of neuronal cell bodies of the submucosal and myenteric plexuses and also in some infiltrating monocytes and T cells in the inflamed ileum and colon. Without any significant detectable MOR protein expression in epithelial, endothelial, and smooth muscle cells, expression of MOR in the human inflamed intestine during IBD is thus mainly restricted to inflammatory mucosal mononuclear and lymphocytic cells.
Previous studies in rodents have demonstrated that inflammation in peripheral tissues is often associated with enhancement of MOR axonal transport.33,34,35 Similarly, in the intestine of mice, upregulation of MOR expression was described in the jejunal myenteric plexus after croton oil induced inflammation.17,36 We observed in IBD patients a ∼6–30‐fold increased expression of MOR mRNA in inflamed small bowel and colon compared with healthy intestine. This enhancement of MOR transcription was associated locally with an increase in the number of MOR immunoreactive cells infiltrating the mucosa. As most peripheral blood monocytes acquired the ability to express MOR mRNA and protein in patients with CD and UC, it seems reasonable to suggest that accumulation of MOR in the gut of IBD patients might result mainly from increased migration of circulatory cells to the site of inflammation and/or from enhancement of MOR expression by activated resident mucosal monocytes and/or T cells.
At the physiological level, β‐endorphin downregulates inflammatory responses in a MOR dependent manner.23 Impaired release of β‐endorphin by the gastrointestinal tract and/or by peripheral blood leucocytes have been associated with IBD,37,38 suggesting that chronic inflammation may lead to an exhausted release of β‐endorphin or alternatively that MOR activation is somehow critical in IBD development. Further work should establish whether an unbalanced ligand/receptor ratio is essential in IBD pathogenesis and whether oral administration of opioid agonists can have therapeutic effect.
The regulatory mechanisms of increased MOR expression by mononuclear cells in IBD patients remain speculative. In cell lines, MOR mRNA production is regulated by activator protein 1 and IL‐4 through binding of STAT‐6 transcription factors to the MOR gene promoter.17,39 Herein, we showed that MOR mRNA and protein expression were induced similarly by TNF‐α, IFN‐γ, and IL‐1β in THP1 and Jurkat cell lines. An inhibitory effect observed with CAPE, an inhibitor of NFκB activation, suggests that the NFκB pathway is required for TNF‐α induced MOR expression. These results are consistent with the recent in vitro data defining NFκB and STAT binding sites on the human MOR gene promoter in the control of MOR expression.9 Given the regulatory role of particular commensal bacteria in the development of IBD, further works are needed to assess the impact of bacterial induced inflammation and the intestinal innate immune system on MOR expression and function.
In a previous study, we have reported in experimental models of colitis in mice that MOR exerts an anti‐inflammatory effect in the colon through regulation of cytokine production and T cell proliferation.16 Herein, we showed ex vivo that DALDA can dampen the production of TNF‐α mRNA by more than 60% and with a higher efficiency in IBD patients compared with controls, suggesting the importance of the physiological availability of MOR agonists. Apart from the regulatory effect of MOR activation on various immune/inflammatory cells40,41,42,43 and within the gastrointestinal mucosa,16 novel MOR agonists are currently in development. However, for a rational use of particular MOR agonists, further work should unravel how to prevent the central and peripheral side effects of these molecules, such as euphoria, respiratory depression, addiction, opioid withdrawal‐like syndrome, or severe inhibition of intestinal motility, which may result in toxic megacolon.
In conclusion, the results of this and former studies suggest that MOR is clearly upregulated during IBD with a plausible beneficial effect on accelerated intestinal transit and on the severity and duration of the inflammatory process. The increased availability of MOR and its agonists at the intestinal interface of IBD patients and demonstration of their anti‐inflammatory effects would promise the development of innovative drugs, such as by upregulating endogenous opiates and/or opioid receptor expression and/or by using new opioid compounds with topical anti‐inflammatory effects.
Acknowledgements
We thank the various members of the Tsicopoulos A and Geboes K labs for discussions and suggestions, as well as M Breisse and V Jeronimo for their valuable technical assistance.
Abbreviations
CAPE - caffeic acid phenethyl ester
CD - Crohn's disease
CDAI - CD activity index
DALDA - [D‐Arg2, Lys4]‐Dermophin‐(1‐4)‐amide
IBD - inflammatory bowel disease
IL‐1β - interleukin 1β
IFN‐γ - interferon γ
LPMC - lamina propria mononuclear cell
mAb - monoclonal antibody
MOR - µ opioid receptor
NFκB - nuclear factor κB
PBMC - peripheral blood mononuclear cell
PBS - phosphate buffered saline
RT‐PCR - reverse transcription‐polymerase chain reaction
TNF‐α - tumour necrosis factor α
UC - ulcerative colitis
Footnotes
We are grateful for the support of grants from the Institut de Recherche des Maladies de l'Appareil Digestif, the Association Francois Aupetit, the Institut Universitaire de France, the Centre Hospitalier et Universitaire de Lille, and the Région Nord‐Pas de Calais.
Conflict of interest: None declared.
References
- 1.Kieffer B L. Recent advances in molecular recognition and signal transduction of active peptides: receptors for opioid peptides. Cell Mol Neurobiol 199515615–635. [DOI] [PubMed] [Google Scholar]
- 2.Mansour A, Fox C A, Burke S.et al Mu, delta, and kappa opioid receptor mRNA expression in the rat CNS: an in situ hybridization study. J Comp Neurol 1994350412–438. [DOI] [PubMed] [Google Scholar]
- 3.Mansour A, Fox C A, Akil H.et al Opioid‐receptor mRNA expression in the rat CNS: anatomical and functional implications. Trends Neurosci 19951822–29. [DOI] [PubMed] [Google Scholar]
- 4.Mansour A, Fox C A, Burke S.et al Immunohistochemical localization of the cloned mu opioid receptor in the rat CNS. J Chem Neuroanat 19958283–305. [DOI] [PubMed] [Google Scholar]
- 5.Coggeshall R E, Zhou S, Carlton S M. Opioid receptors on peripheral sensory axons. Brain Res 1997764126–132. [DOI] [PubMed] [Google Scholar]
- 6.Sternini C. Receptors and transmission in the brain‐gut axis: potential for novel therapies. III. Mu‐opioid receptors in the enteric nervous system. Am J Physiol Gastrointest Liver Physiol 2001281G8–15. [DOI] [PubMed] [Google Scholar]
- 7.Elvenes J, Andjelkov N, Figenschau Y.et al Expression of functional mu‐opioid receptors in human osteoarthritic cartilage and chondrocytes. Biochem Biophys Res Commun 2003311202–207. [DOI] [PubMed] [Google Scholar]
- 8.Kieffer B L, Gaveriaux‐Ruff C. Exploring the opioid system by gene knockout. Prog Neurobiol 200266285–306. [DOI] [PubMed] [Google Scholar]
- 9.Tegeder I, Geisslinger G. Opioids as modulators of cell death and survival—unraveling mechanisms and revealing new indications. Pharmacol Rev 200456351–369. [DOI] [PubMed] [Google Scholar]
- 10.Law P Y, Loh H H, Wei L N. Insights into the receptor transcription and signaling: implications in opioid tolerance and dependence. Neuropharmacology 200447(suppl 1)300–311. [DOI] [PubMed] [Google Scholar]
- 11.Pol O, Puig M M. Expression of opioid receptors during peripheral inflammation. Curr Top Med Chem 2004451–61. [DOI] [PubMed] [Google Scholar]
- 12.Wei L N, Loh H H. Regulation of opioid receptor expression. Curr Opin Pharmacol 2002269–75. [DOI] [PubMed] [Google Scholar]
- 13.Roy S, Barke R A, Loh H H. MU‐opioid receptor‐knockout mice: role of mu‐opioid receptor in morphine mediated immune functions. Brain Res Mol Brain Res 199861190–194. [DOI] [PubMed] [Google Scholar]
- 14.Inui Y, Azuma Y, Ohura K. Differential alteration of functions of rat peritoneal macrophages responsive to endogenous opioid peptide endomorphin‐1. Int Immunopharmacol 200221133–1142. [DOI] [PubMed] [Google Scholar]
- 15.Gomez‐Flores R, Weber R J. Differential effects of buprenorphine and morphine on immune and neuroendocrine functions following acute administration in the rat mesencephalon periaqueductal gray. Immunopharmacology 200048145–156. [DOI] [PubMed] [Google Scholar]
- 16.Philippe D, Dubuquoy L, Groux H.et al Anti‐inflammatory properties of the mu opioid receptor support its use in the treatment of colon inflammation. J Clin Invest 20031111329–1338. [DOI] [PMC free article] [PubMed] [Google Scholar]
- 17.Kraus J, Borner C, Giannini E.et al Regulation of mu‐opioid receptor gene transcription by interleukin‐4 and influence of an allelic variation within a STAT6 transcription factor binding site. J Biol Chem 200127643901–43908. [DOI] [PubMed] [Google Scholar]
- 18.Valle L, Pol O, Puig M M. Intestinal inflammation enhances the inhibitory effects of opioids on intestinal permeability in mice. J Pharmacol Exp Ther 2001296378–387. [PubMed] [Google Scholar]
- 19.Turnberg L A. Antisecretory activity of opiates in vitro and in vivo in man. Scand J Gastroenterol Suppl 19838479–83. [PubMed] [Google Scholar]
- 20.Boyd C A. Opiates and intestinal secretion. Lancet 197621085. [DOI] [PubMed] [Google Scholar]
- 21.Gray A C, White P J, Coupar I M. Characterisation of opioid receptors involved in modulating circular and longitudinal muscle contraction in the rat ileum. Br J Pharmacol 2005144687–694. [DOI] [PMC free article] [PubMed] [Google Scholar]
- 22.Liu B H, Mo P, Zhang S B. Effects of mu and kappa opioid receptor agonists and antagonists on contraction of isolated colon strips of rats with cathartic colon. World J Gastroenterol 2004101672–1674. [DOI] [PMC free article] [PubMed] [Google Scholar]
- 23.Panerai A E, Sacerdote P. Beta‐endorphin in the immune system: a role at last? Immunol Today 199718317–319. [DOI] [PubMed] [Google Scholar]
- 24.O'Connor T M, O'Connell J, O'Brien D I.et al The role of substance P in inflammatory disease. J Cell Physiol 2004201167–180. [DOI] [PubMed] [Google Scholar]
- 25.Nguyen X D, Eichler H, Dugrillon A.et al Flow cytometric analysis of T cell proliferation in a mixed lymphocyte reaction with dendritic cells. J Immunol Methods 200327557–68. [DOI] [PubMed] [Google Scholar]
- 26.Stanciu L A, Shute J, Holgate S T.et al Production of IL‐8 and IL‐4 by positively and negatively selected CD4+ and CD8+ human T cells following a four‐step cell separation method including magnetic cell sorting (MACS). J Immunol Methods 1996189107–115. [DOI] [PubMed] [Google Scholar]
- 27.Borruel N, Carol M, Casellas F.et al Increased mucosal tumour necrosis factor alpha production in Crohn's disease can be downregulated ex vivo by probiotic bacteria. Gut 200251659–664. [DOI] [PMC free article] [PubMed] [Google Scholar]
- 28.Satoh M, Minami M. Molecular pharmacology of the opioid receptors. Pharmacol Ther 199568343–364. [DOI] [PubMed] [Google Scholar]
- 29.Townsend D T, Portoghese P S, Brown D R. Characterization of specific opioid binding sites in neural membranes from the myenteric plexus of porcine small intestine. J Pharmacol Exp Ther 2004308385–393. [DOI] [PubMed] [Google Scholar]
- 30.Lang M E, Davison J S, Bates S L.et al Opioid receptors on guinea‐pig intestinal crypt epithelial cells. J Physiol 1996497161–174. [DOI] [PMC free article] [PubMed] [Google Scholar]
- 31.Quito F L, Seybold V S, Brown D R. Opiate binding sites in mucosa of pig small intestine. Life Sci 199149L219–L222. [DOI] [PubMed] [Google Scholar]
- 32.Zubieta J K, Smith Y R, Bueller J A.et al Regional mu opioid receptor regulation of sensory and affective dimensions of pain. Science 2001293311–315. [DOI] [PubMed] [Google Scholar]
- 33.Hassan A H, Ableitner A, Stein C.et al Inflammation of the rat paw enhances axonal transport of opioid receptors in the sciatic nerve and increases their density in the inflamed tissue. Neuroscience 199355185–195. [DOI] [PubMed] [Google Scholar]
- 34.Jeanjean A P, Moussaoui S M, Maloteaux J M.et al Interleukin‐1 beta induces long‐term increase of axonally transported opiate receptors and substance P. Neuroscience 199568151–157.7477920 [Google Scholar]
- 35.Mousa S A, Zhang Q, Sitte N.et al Beta‐endorphin‐containing memory‐cells and mu‐opioid receptors undergo transport to peripheral inflamed tissue. J Neuroimmunol 200111571–78. [DOI] [PubMed] [Google Scholar]
- 36.Puig M M, Pol O. Peripheral effects of opioids in a model of chronic intestinal inflammation in mice. J Pharmacol Exp Ther 19982871068–1075. [PubMed] [Google Scholar]
- 37.Koch T R, Carney J A, Go V L. Distribution and quantitation of gut neuropeptides in normal intestine and inflammatory bowel diseases. Dig Dis Sci 198732369–376. [DOI] [PubMed] [Google Scholar]
- 38.Wiedermann C J, Sacerdote P, Propst A.et al Decreased beta‐endorphin content in peripheral blood mononuclear leukocytes from patients with Crohn's disease. Brain Behav Immun 19948261–269. [DOI] [PubMed] [Google Scholar]
- 39.Borner C, Hollt V, Kraus J. Involvement of activator protein‐1 in transcriptional regulation of the human mu‐opioid receptor gene. Mol Pharmacol 200261800–805. [DOI] [PubMed] [Google Scholar]
- 40.Bidlack J M. Detection and function of opioid receptors on cells from the immune system. Clin Diagn Lab Immunol 20007719–723. [DOI] [PMC free article] [PubMed] [Google Scholar]
- 41.Sharp B M. Opioid receptor expression and function. J Neuroimmunol 20041473–5. [DOI] [PubMed] [Google Scholar]
- 42.Chuang T K, Killam K F, Jr, Chuang L F.et al Mu opioid receptor gene expression in immune cells. Biochem Biophys Res Commun 1995216922–930. [DOI] [PubMed] [Google Scholar]
- 43.Makarenkova V P, Esche C, Kost N V.et al Identification of delta‐ and mu‐type opioid receptors on human and murine dendritic cells. J Neuroimmunol 200111768–77. [DOI] [PubMed] [Google Scholar]


