Abstract
Background
Signal transducers and activators of transcription (STATs) play a critical role in antiviral defence. STAT3 is also important in cell protection against inflammatory damage. STAT proteins are activated by interferons and by hepatoprotective cytokines of the interleukin 6 superfamily, including cardiotrophin 1.
Methods
We analysed the status of STATs in hepatitis C virus (HCV) infected livers and the relationship between expression and activation of STATs and HCV replication in Huh7 cells transfected with HCV genomic replicon.
Results
STAT3α expression was reduced in HCV infected livers showing an inverse correlation with serum alanine aminotransferase. In patients with HCV infection, nuclear staining for phosphorylated STAT3 was faint in parenchymal cells (although conspicuous in infiltrating leucocytes), in contrast with strong nuclear staining in hepatocytes from control livers. Expression and activation of STAT1 (a factor activated by both interferon (IFN)‐α and IFN‐γ) were increased in HCV infected livers, particularly in those with high inflammatory activity. Conversely, phosphorylated STAT2 (a factor selectively activated by IFN‐α) was undetectable in livers with HCV infection, a finding that was associated with marked downregulation of the two functional subunits of the IFN‐α receptor. HCV replication in Huh7 cells caused STAT3α downregulation and blocked STAT3 phosphorylation by either IFN‐α or cardiotrophin 1. HCV replication in Huh7 cells also inhibited STAT1 and STAT2 activation by IFN‐α while there was no impairment of STAT1 phosphorylation by the proinflammatory cytokine IFN‐γ.
Conclusions
STAT3 is downregulated in HCV infected livers and in Huh7 cells bearing the full length HCV replicon. HCV replication is associated with impaired Jak‐STAT signalling by antiviral and cytoprotective cytokines. These effects may favour viral replication while facilitating the progression of liver disease.
Keywords: interferon, hepatitis C virus, interferon receptor, suppressor of cytokine signalling, protein inhibitor of activated STAT
Signal transducers and activators of transcription (STATs) are a family of proteins unique in their ability to both transduce extracellular signals and regulate transcription directly.1 STATs transmit extracellular signals from growth factors and cytokines such as type I and type II interferons (IFNs) and the interleukin (IL)‐6 superfamily (which includes IL‐6, cardiotrophin‐1 (CT‐1), and oncostatin, among others). The interaction of these cytokines with specific surface receptors triggers activation of STATs through phosphorylation at specific tyrosine residues by the receptor associated Jak kinases. Once phosphorylated, STATs homo‐ or heterodimerise and this is followed by nuclear translocation and transcriptional regulation of STAT responsible genes.
It is well documented that activation of STAT1 and STAT2 is essential for the antiviral effect of IFNs.2,3 It has also been shown that activation of STAT3 is necessary for IFN‐α to exert its antiviral activity.4 Recent data indicate that STAT3 induces anti‐ hepatitis C virus (HCV) activity in liver cells.5 In addition to its role in defence against viral infection, STAT3 exerts potent cytoprotective and anti‐inflammatory effects.6,7,8 It has been reported that STAT3 activation by CT‐1 or IL‐6 provides hepatoprotection in various models of liver injury.9,10,11,12,13 CT‐1 is a particularly hepatoprotective cytokine which, in contrast with IL‐6, is synthesised by liver parenchymal cells.9,10 The IL‐6 family of cytokines use the common receptor subunit gp130 for signal transduction. Binding to the receptor results in activation of gp130 associated kinases and phosphorylation of STAT3 and STAT1.14,15 Type I IFNs bind to a receptor composed by two subunits, IFNAR1 and IFNAR2.16 IFNAR2 has three splicing forms, including full length IFNA2Rc, short form IFNAR2b, and soluble form IFNAR2a. The full length IFNAR2c is involved in both ligand binding and signal transduction, whereas both the short form IFNAR2b and the soluble form IFNAR2a have been implicated in suppression of type I IFN signalling.17 Signal transduction is mediated by Jak kinases, which phosphorylate STAT1, STAT2, and STAT3 proteins.2,18 In the case of type II IFN (IFN‐γ), binding to receptor leads to phosphorylation of STAT1.19
Negative regulators of STATs include suppressor of cytokine signalling (SOCS) family members20 SOCS1 and SOCS3 which prevent phosphorylation of STATs by inhibiting receptor associated Jak kinases.21 In addition, gene transcription can be inhibited by protein inhibitor of activated STATs (PIAS).22,23 PIAS1 and PIAS3 inhibit binding of STAT1 and STAT3, respectively, to response elements in promoters of target genes.
HCV causes persistent infection in 70–80% of patients, indicating that this agent has developed efficient mechanisms to escape host antiviral defences. As STATs are essential to set in motion antiviral and cytoprotective mechanisms within the infected cell, in the present work our aim was to analyse expression and activation of STATs in the liver of patients with chronic hepatitis C (CH‐C) and to correlate these changes with liver damage and level of HCV replication. To determine whether alterations of STATs observed in CH‐C could be ascribed to the presence of replicating HCV in liver, we investigated expression of STATs and induction of the Jak‐STAT signalling pathway by IFNs and CT‐1 in hepatoma cells transfected with a full length HCV replicon.
Patients and methods
Patients
Liver biopsies were obtained from 61 CH‐C patients. Diagnosis of CH‐C was based on elevation of serum transaminases for more than six months, positivity for anti‐HCV antibodies, presence of HCV‐RNA by reverse transcription‐polymerase chain reaction (RT‐PCR), and histological evidence of chronic hepatitis. Alcohol consumption and other causes of liver disease were excluded. None of the patients had received antiviral treatment in the six months before the study. Liver biopsies were divided into two parts. The first part (approximately two thirds) was used for histological examination and the second for RNA or protein extraction. Because the amount of tissue was not enough to perform all determinations, two different cohorts of CH‐C patients were analysed. The first cohort (n = 34) was used for RNA extraction. In the second cohort (n = 24) we performed extracts for total protein. Normal liver samples were obtained from 28 patients at laparotomy. Intervention was performed because of gastrointestinal neoplasm in 11 cases, pancreatic tumour in nine cases, cholelithiasis in four cases, hydatidic cyst in two cases, cholangiocarcinoma in one case, and hiatal hernia in one case. These subjects had not received anti‐inflammatory or cytotoxic therapy previous to operation, and in all cases histological examination of biopsy material showed normal liver architecture. We also studied liver biopsies from another control group (n = 24) with miscellaneous liver disorders unrelated to HCV (nine chronic hepatitis B, one drugs, one primary biliary cirrhosis, 10 autoinmune hepatitis, three steatohepatitis). In this miscellaneous group, liver damage was similar to that of CH‐C patients. The main biochemical, virological, and histological features of patients at the time of liver biopsy are described in table 1. Written consent was obtained in all cases.
Table 1 Clinical features of patients enrolled in the study.
| Characteristic | HCV+ group | Normal liver group | Miscellaneous group |
|---|---|---|---|
| Serum biochemistry (mean (SD)) | |||
| AST (IU/l) | 58.1 (47.2) | 15.1 (4.4) | 70.8 (49.8) |
| ALT (IU/l) | 91.1 (71.1) | 19.0 (9.1) | 119.2 (78.9) |
| GGTP (IU/l) | 48.3 (51.8) | 30.1 (16.3) | 156.7 (265) |
| Albumin (g/dl) | 4.16 (0.3) | – | 4.6 (0.43) |
| Viral load (IU/ml) (median (range)) | 6.7×10⁶ (154–1.6×10⁸) | – | – |
| Genotype (n) | |||
| 1b | 34 | – | – |
| Non‐1b | 15 | – | – |
| Non determined | 9 | – | – |
| Inflammatory activity | 6.6 (2.5) | – | 5.7 (3.3) |
| Fibrosis score | 1.2 (1.1) | – | 1.5 (1.7) |
HCV, hepatitis C virus; AST, aspartate aminotransferase; ALT, alanine aminotransferase; GGTP, γ‐glutamyl transpeptidase.
Generation of HCV replicon cell lines
Huh7 cells expressing full length HCV replicon were established as described previously.24 Briefly, pI389/Core‐3′/5.1 (kind gift from Dr Bartenschlager) were linearised with ScaI and used as templates for RNA synthesis using the T7 RNA polymerase (Promega, Madison, Wisconsin, USA). Synthesised RNA (20 μg) was used to electroporate 107 Huh7 cells and 24 hours later 500 μg/ml of G418 were added. Twice a week culture medium supplemented with G418 was replaced and four weeks after transfection the colonies resistant to G418 were collected, mixed, and used for further analysis.
After pretreating the HCV replicon cells for six hours with 50 mmol/l of AG490 (Calbiochem, Darmstadt, Germany), which is an inhibitor of STAT3 activation, cells were treated for 48 hours with 50 U/ml of IFN‐α in the presence of AG490 and harvested for western blot or mRNA expression analysis.
Antibodies
Anti‐phospho‐STAT1tyr701, anti‐phospho‐STAT3tyr705 antibodies, and antirabbit IgG horseradish peroxidase linked antibody were purchased from Cell Signaling Technology (Beverly, Massachusetts, USA). Anti‐STAT3, anti‐phospho‐STAT1ser727, anti‐STAT2, and anti‐phospho‐STAT2tyr689 antibodies were from Upstate Biotechnology (Lake Placid, New York, USA). Anti‐STAT1 antibody was from Santa Cruz Biotechnology (Santa Cruz, California, USA). Antiactin antibody was from Sigma‐Aldrich (Steinheim, Germany).
RNA and protein extraction from liver tissues
Before RNA extraction, liver tissue was homogenised in 1 ml of Ultraspec (Biotex, Houston, Texas, USA) and total RNA was obtained following the Ultraspec protocol, which is based on the method described by Chomczynski and Sacchi.25
Liver total protein was obtained as follows: tissue was homogenised in 200 μl of lysis buffer containing 10 mmol/l Tris‐Cl, pH 7.4, 1 mmol/L KCl, and 0.1 mmol/l EGTA, supplemented with 1 μg/ml aprotinin, 1 mmol/l PMSF, 10 μg/ml trypsin inhibitor, 10 μg/ml leupeptin, 1 μg/ml pepstatin, 1 mM Na2VO4, and 1 mM NaF. Protein extracts were collected by centrifugation at 100 000 g for 45 minutes and supernatants were stored at −80°C.
Analysis of mRNA expression by quantitative real time PCR
Total RNA (2 μg) was treated with DNase (Gibco‐BRL, Paisley, UK) prior to RT with M‐MLV reverse transcriptase (Gibco‐BRL) in the presence of RNaseOUT (Gibco‐BRL). STATs, IFNAR, PIAS, SOCS3, HCV, and β‐actin expression were measured by quantitative real time PCR using a LightCycler (Roche Diagnostic, Mannheim, Germany) and LC‐DNA Master SYBR Green mix. Aliquots of 2 μl from the cDNA pool were used for each PCR, containing upstream and downstream primers for each gene (table 2). To determine specificity, final PCR products were analysed by melting curves and electrophoresis. Results were normalised to β‐actin. The amount of each transcript was expressed by the formula:
Table 2 Primers used in this study.
| Gene | Sense primer (5′‐3′) | Antisense primer (5′‐3′) |
|---|---|---|
| STAT1 | GCTATTCACAACCACTCATTCA | ACAAGATACAGCCACATAGACA |
| STAT3α | GTCCGTGGAACCATACACAA | CAATGGTATTGCTGCAGGTG |
| STAT3β | GTCCGTGGAACCATACACAA | ACTGCATCAATGAATGGTGTC |
| SOCS3 | TGCGCCTCAAGACCTTCAGC | GATGCGCAGGTTCTTGGTCC |
| PIAS3 | TGCTGGCCGGAACAAGAGTG | AGGGGGCAAAGAGAGAAGGG |
| PIAS1 | TCCCACCCAATCTTTGTGTG | GCCGCATTTTACCAAGTGGA |
| IFNAR1 | AAACAGTCTGGAAACACGCCTG | CGCAGCATAAATGACAAACGG |
| IFNAR2c | CCAAAGTCTTGAATTTTCATAAC | TGCCTCAGTATCGCTATCAC |
| IFNAR2a | CCAGGAATCAGAATTTTCATAAC | TGCCTCAGTATCGCTATCAC |
| IFNAR2b | TCACAGGTGCAGTCATAATG | TGCCTCAGTATCGCTATCAC |
| β‐actin | AGCCTCGCCTTTGCCGA | CTGGTGCCTGGGGCG |
| HCV | CCTGTGAGGAACTACTGTCT | CTATCAGGCAGTACCACAAG |
STAT, signal transducer and activator of transcription; SOCS, suppressor of cytokine signalling; PIAS, protein inhibitor of activated STAT; IFNAR, interferon α/β receptor; HCV, hepatitis C virus.
2ct(actin)−ct(gene)
ct being the point at which fluorescence rises appreciably above background fluorescence.
Western blot analysis
Total liver protein (60 μg) was loaded onto sodium dodecyl sulphate‐7.5% polyacrylamide gels. After electrophoresis, it was transferred to nitrocellulose membranes (Bio‐Rad Laboratories). Membranes were incubated in TBS‐T (50 mM Tris‐HCl (pH 7.6), 200 mM NaCl, and 0.1% Tween‐20) with 5% dry milk. Proteins were detected by incubation with specific antibody in TBS‐T. After extensive washing, horseradish peroxidase conjugated antibody was added for one hour. Protein bands were visualised using the enhanced chemiluminescence detection system (Perkin Elmer, Boston, Massachusetts, USA). Membranes were autoradiographed and bands were quantified by densitometric analysis (Molecular Analyst/PC software; Bio‐Rad).
STAT2 immunoprecipitation
Human liver protein (700 μg) was incubated with 6 μg of anti‐STAT2 antibody overnight at 4°C and then added to protein G‐sepharose for two hours at 4°C. After sodium dodecyl sulphate‐polyacrylamide gel electrophoresis and transfer onto nitrocellulose membrane, protein was detected with anti‐phospho‐STAT2tyr689 antibody.
Phospho‐Stat3 immunohistochemistry
Liver sections (4 μm) were cut from paraffin blocks and captured on electrically charged slides. Sections were dewaxed in xylene and taken through a series of ethanol washes. Antigen retrieval was performed by microwave pressure cooking for five minutes at full pressure in 10 mmol/l sodium citrate buffer (pH 6). Endogenous peroxidase activity was blocked by incubation in 3% hydrogen peroxide for 30 minutes. Phospho‐STAT3 antibody was incubated at a dilution of 1:25 overnight at 4°C and immunodetection was performed with the EnVision system (DakoCytomation, Carpinteria, California, USA). Incubations either omitting the specific antibody or containing rabbit normal serum (Dako) were used as a negative control. Sections were counterstained with methyl green.
Statistical analysis
Normality was assessed using the Shapiro‐Wilk W test. Statistical analyses were performed using parametric (Student's t test) and non‐parametric (Kruskal‐Wallis and Mann‐Whitney U) tests. Correlation was assessed by Spearman's or Pearson's correlation coefficients. All p values were two tailed and were considered significant if the associated value was less than 0.05. Descriptive data for continuous variables are reported as means (SD) or as medians (interquartile range). SPSS 9.0 for Windows was used for statistical analysis.
Results
Expression of STAT3 in liver tissue
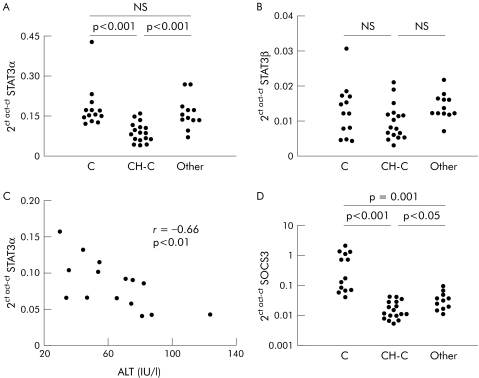
STAT3 has two splice forms, STAT3α and STAT3β, STAT3β being a dominant negative regulator of STAT3.26 As shown in fig 1A, mRNA levels of STAT3α were significantly decreased in liver samples from CH‐C patients compared with normal livers and also compared with a miscellaneous group of chronic liver diseases. However, STAT3β mRNA values were similar in the three groups of patients (fig 1B). In CH‐C patients, STAT3α mRNA correlated inversely with serum alanine aminotransferase (fig 1C).
Figure 1 Quantitation of signal transducer and activator of transcription (STAT)3 and suppressor of cytokine signalling (SOCS)3 mRNA levels by real time polymerase chain reaction in the liver: relationship to serum transaminases. (A, B) STAT3α and STAT3β mRNA expression in normal liver (C), in liver from patients with chronic hepatitis C (CH‐C), and in liver from a miscellaneous group of patients with liver diseases unrelated to hepatitis C virus (HCV) (Other). (C) Relationship between the level of STAT3α mRNA expression in the liver and serum alanine aminotransferase (ALT) levels in patients with CH‐C. (D) SOCS3 mRNA expression in normal liver, in liver from patients with CH‐C and in liver from a miscellaneous group of patients with liver diseases unrelated to HCV.
SOCS3 is a target gene for STAT3, which can be considered as a marker of STAT3 transcriptional activity. In CH‐C, we found a significant decrease in SOCS3 mRNA compared with normal livers and with livers from other conditions unrelated to HCV (fig 1D), suggesting impaired STAT3 function in CH‐C patients.
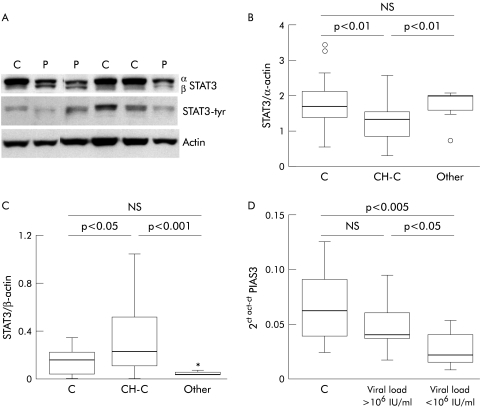
In parallel with these findings, western blot analysis showed a decrease in STAT3α protein in the livers from CH‐C patients (n = 22) with respect to normal hepatic tissue (n = 14) and samples from patients with miscellaneous chronic liver diseases (n = 9) (fig 2A, B). Also, we found an increase in STAT3β protein in CH‐C (n = 22) compared with normal liver (n = 14) and livers from patients with different forms of chronic liver diseases (n = 9) (fig 2A, C). Interestingly, we observed a positive correlation between STAT3β protein and viral load (r = 0.5, p<0.05). PIAS3 is an inhibitor of STAT3 activation.22 We detected a significant decrease in PIAS3 mRNA only in those patients with low viral load (fig 2D), suggesting that in these cases there are cell mechanisms tending to prevent STAT3 inactivation.
Figure 2 Expression of signal transducer and activator of transcription (STAT)3 protein and protein inhibitor of activated STAT (PIAS)3 mRNA in liver tissue. (A) Representative immunoblot of STAT3 isoforms, STAT3‐tyrosine phosphorylation (tyr) and the corresponding actin in liver tissue from patients with chronic hepatitis C (P) and normal liver (C). (B, C) Densitometric analysis of total STAT3α and STAT3β protein in liver from chronic hepatitis C patients (CH‐C), in normal liver (C), and in liver from a miscellaneous group of patients with liver diseases unrelated to hepatitis C virus (Other). (D) mRNA expression of PIAS3 in normal liver (C) and in liver from patients with CH‐C with a high (>106 UI/ml) or low (<106 UI/ml) viral load in serum.
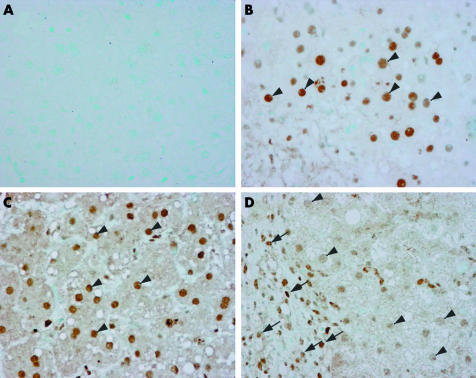
Levels of phosphorylated STAT3 (as assessed by western blot) showed overlap between HCV patients and controls (data not shown). However, as in HCV infected livers STAT3 is expressed by different cell types, we analysed the presence and histological distribution of activated STAT3 in liver tissue from HCV infected patients and controls. Immunohistochemical analysis of Tyr‐STAT3 was performed in four normal livers, in three HCV infected livers with a high viral load, and in one patient with alcoholic hepatitis. We found strong nuclear staining of phospho‐STAT3 in hepatocytes both in normal livers and in alcoholic hepatitis (fig 3B, C). In contrast, in HCV infected livers, nuclear staining was faint in hepatocytes while it was more marked in infiltrating mononuclear cells (fig 3D). Differences in activated STAT3 staining between parenchymal cells and cells of the inflammatory infiltrate might explain the overlap in Tyr‐STAT3 observed in western blot studies between HCV patients and controls. Taken together, our data indicate that HCV infection is associated with reduced STAT3 activity in parenchymal liver cells.
Figure 3 Immunohistochemical detection of phospho‐signal transducer and activator of transcription (STAT)3 in normal liver (B), in the liver from an alcoholic hepatitis patient (C), and in the liver from a patient with chronic hepatitis C virus infection and high viral load (D). (A) Negative control without primary antibody. Arrows indicate nuclei of infiltrating mononuclear cells; arrowheads indicate nuclei of hepatocytes.
STAT1 expression in liver tissue
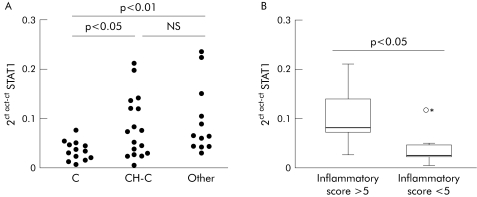
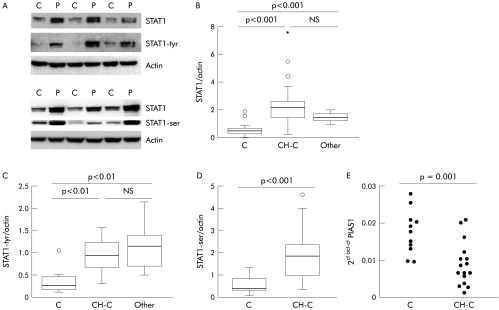
STAT1 mRNA abundance was significantly increased in liver tissue from CH‐C patients compared with normal livers (fig 4A). In patients, we observed a relationship between STAT1 mRNA levels and histological degree of liver inflammation. Thus patients with high inflammatory activity (grade 6 or higher, as determined by Knodell score, n = 9) had increased values for STAT1 mRNA compared with patients with low inflammatory activity (grade 5 or less, n = 8) (fig 4B). Liver STAT1 mRNA was also elevated to a similar degree as in CH‐C in a miscellaneous group of patients with chronic hepatitis of various aetiologies (fig 4A).
Figure 4 Quantitation of signal transducer and activator of transcription (STAT)1 mRNA by real time polymerase chain reaction in liver tissue. (A) STAT1 mRNA values in normal liver (C), in liver tissue from patients with chronic hepatitis C (CH‐C), and in liver from a miscellaneous group of patients with liver diseases unrelated to hepatitis C virus (Other). (B) STAT1 mRNA expression in liver tissue from CH‐C patients with high (>5) or low (<5) inflammatory activity, as determined by the Knodell score.
Densitometric values for total and phospho‐STAT1 were significantly higher in livers from CH‐C patients (n = 24) and in livers from a miscellaneous group of chronic liver diseases (n = 9) compared with normal liver (n = 15) (fig 5A‐5D). No relationship was found between STAT1 and viral load or transaminases. However, STAT1‐ser correlated with γ‐glutamyl‐transpeptidase (r = 0.55, p<0.01) in CH‐C.
Figure 5 Signal transducer and activator of transcription (STAT)1 protein and mRNA expression of protein inhibitor of activated STAT (PIAS)1 in liver tissue. (A) Representative immunoblot of total STAT1, STAT1‐tyrosine phosphorylation (tyr), STAT1‐serine phosphorylation (ser), and the corresponding actin in liver tissue from patients with chronic hepatitis C (CH‐C) (P) and normal liver (C). (B–D) Densitometric analysis of total STAT1 protein, STAT1‐tyr, and STAT1‐ser in liver from CH‐C patients, normal liver (C), and liver from a miscellaneous group of patients with liver diseases unrelated to hepatitis C virus (Other). (E) Quantitation of PIAS1 mRNA level by real time polymerase chain reaction in normal liver (C) and in liver tissue from patients with CH‐C.
PIAS1 is an inhibitor of activated STAT1 by interfering with STAT1‐DNA binding. We found a significant decrease in PIAS1 mRNA in CH‐C compared with normal livers (fig 5E), suggesting that the effect of phospho‐STAT1 on gene transcription is not blocked by this inhibitor.
Expression of STAT2 and type I interferon receptor in liver tissue
Total STAT2 protein was similar in CH‐C and normal livers (data not shown). Due to limitations in the sensitivity of the analytical method for detection of phospho‐STAT2 in liver, a higher amount of tissue (obtained from explanted organs) had to be used and an immunoprecipitation step previous to immunoblot for STAT2‐tyr was performed. We analysed three cases of HCV induced cirrhosis and three control livers. As shown in fig 6A, activated STAT2 was detectable in normal liver but was completely absent in livers with HCV infection. As STAT2 is activated specifically through type I IFN signalling cascade, we investigated expression of IFN‐α/β receptor in liver samples. We observed that mRNA abundance of IFNAR2c and IFNAR1 (the two transducing components of receptor) were significantly lower in specimens from CH‐C than in normal livers while values of these transcripts were comparable with normal in a miscellaneous group of chronic hepatitis patients (fig 6B, C). Transcriptional expression of IFNAR2a was similar among the three groups studied (data not shown).
Figure 6 Signal transducer and activator of transcription (STAT)2 protein and interferon (IFN)α/β receptor mRNA expression in liver tissue. (A) Immunoprecipitation of total STAT2 and STAT2‐tyrosine phosphorylation (tyr) in liver from patients with cirrhosis C (P) and normal liver (C). (B) Quantitation of the full length isoform of IFNAR2 (IFNAR2c) mRNA values by real time polymerase chain reaction in normal liver (C), in liver tissue from patients with chronic hepatitis C (CH‐C), and in liver from a miscellaneous group of patients with liver diseases unrelated to hepatitis C virus (Other). (C) IFNAR1 mRNA levels in normal liver (C), in liver tissue from patients with CH‐C, and in liver from a miscellaneous group of patients with liver diseases unrelated to hepatitis C virus.
Characterisation of Jak‐STAT signalling pathway in the replicon system
To analyse whether HCV replication could induce changes in the Jak‐STAT signalling cascade similar to those observed in liver from CH‐C patients, we analysed this signalling pathway in Huh7 cells with HCV replicon.
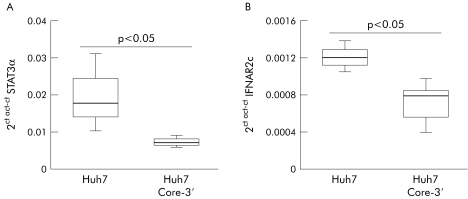
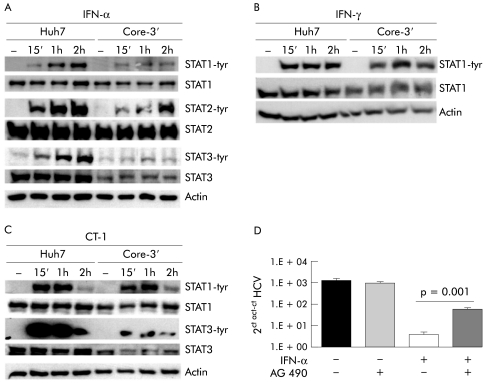
We found that many alterations in the STATs signalling cascade observed in CH‐C livers were also present in cells expressing the replicon. As in liver biopsies, in these cells we detected a marked decrease in STAT3 mRNA and protein, and also of IFNRA2c mRNA compared with control Huh7 cells (fig 7A, B; 8A, C). Replication of HCV‐RNA was also associated with marked impairment of the IFN‐α signalling cascade with a striking defect in STAT1, STAT2, and STAT3 phosphorylation after stimulation with this cytokine (fig 8A). Also, HCV replication markedly inhibited STAT3 phosphorylation by CT‐1 (fig 8C) but did not affect STAT1 activation by either IFN‐γ or CT‐1 (fig 8B, C).
Figure 7 Quantification of signal transducer and activator of transcription (STAT)3α (A) and interferon α/β receptor (IFNAR)2c (B) mRNA levels by real time polymerase chain reaction in Huh7 and Huh7 genomic hepatitis C virus replicon cell line (Core‐3′).
Figure 8 Characterisation of the Jak‐signal transducer and activator of transcription (STAT) pathway in Huh7 and Huh7 hepatitis C virus (HCV) replicon cell line. (A) Analysis of STAT1, STAT2, and STAT3 activation in Huh7 and Huh7 Core‐3′ cell lines treated with 50 U/ml of interferon (IFN)‐α2. (B) STAT1 tyrosine phosphorylation (tyr) in Huh7 and Huh7 genomic HCV replicon (Core‐3′) cell lines after treatment with 50 U/ml of IFN‐γ. (C) STAT1 and STAT3 activation in Huh7 and Huh7 genomic HCV replicon (Core‐3′) cell lines after treatment with 50 ng/ml of cardiotrophin 1 (CT‐1). (D) HCV replication in Huh7 genomic HCV replicon cell line pretreated with AG490 and then stimulated with IFN‐α (50 U/ml) for 48 hours.
As HCV replication in Huh7 cells caused a reduction in both STAT3 expression and phosphorylation, we analysed whether impairment of STAT3 activation might affect the antiviral effect of IFN‐α in cells sustaining HCV replication. Thus we incubated the replicon cells in the presence of AG490, an inhibitor of STAT3 phosphorylation,27 in order to achieve more intense blockade of STAT3 activation in these cells. As shown in fig 8D, IFN‐α exhibited a reduced ability to decrease viral load in replicon cells pretreated with AG490, suggesting that blockade of STAT3 activation hampers the antiviral effect of IFN‐α in cells with replicating HCV.
Discussion
The mechanisms by which HCV resists host antiviral defences and induces liver injury remain poorly defined. STATs proteins are part of a signalling pathway that is involved in cell resistance to viral infection, cell survival, and cell protection against inflammation induced damage.2,4,7,8,11,13,28 In this work we analysed the status of STATs in the liver of CH‐C patients and in cells supporting HCV replication. Data in this paper show a parallel between in vivo and in vitro findings.
STAT3 is a critical factor for cell defence against inflammatory damage and viral infection.4,7,8 There are two splice forms of this factor, STAT3α and STAT3β, the latter being a dominant negative regulator of STAT3.26 In HCV infected livers we observed an increase in STAT3β protein in direct correlation with viral load, an observation which is in agreement with the antiviral activity of STAT3. On the other hand, we found that both mRNA and protein levels of STAT3α were reduced in the liver of CH‐C patients and also in Huh7 cells with HCV replicon. These data suggest a role for HCV in abating STAT3α expression. Interestingly, the abundance of STAT3α mRNA correlated inversely with alanine aminotransferase, a finding that is in keeping with the known cytoprotective function of STAT3α. In CH‐C we also found a significant reduction in SOCS3. As SOCS3 transcription reflects STAT3 activity, our data indicate an overall decrease in functional STAT3 in HCV infected livers. PIAS3 is a known inhibitor of STAT3 transcriptional activity.22 We detected a decrease in PIAS3 in those cases with a low viral load, again suggesting an inverse relationship between active STAT3 and HCV replication.
Our immunohistochemical observations showed lower levels of activated STAT3 in the nuclei of hepatocytes in livers from HCV infected patients with a high viral load compared with controls. These data are consistent with five additional lines of evidence that indicate derangement of STAT3 signalling in HCV infection, namely: (1) reduced STAT3 mRNA in HCV infected livers; (2) decreased STAT3α protein in livers with HCV infection; (3) diminished hepatic SOCS3 in patients with HCV infection; (4) decreased STAT3 protein in cells with HCV replicon; and (5) impaired phospho‐STAT3 on IFN‐α or CT‐1 stimulation in cells with HCV replicon.
To determine whether the presence of replicating HCV might interfere with activation of STAT3, we analysed phosphorylation of this factor in Huh7 cells in the presence or absence of HCV replicon after incubation of cells with IFN‐α or CT‐1. We found that HCV replication blocked STAT3 phosphorylation by either IFN‐α or CT‐1. This effect was rather specific as STAT1 phosphorylation by CT‐1 was not affected by the presence of HCV replicon. Therefore, HCV appears to selectively interfere with STAT3 activation by either antiviral (IFN‐α) or hepatoprotective (CT‐1) cytokines. We found that when activation of STAT3 was blocked more completely by incubation of replicon cells with AG490, the antiviral effect of IFN‐α was clearly reduced. Because of the known cytoprotective effects of STAT3, blockade of STAT3 activation by HCV not only favours viral replication but may also reduce the defence against inflammatory liver damage. According to this view, the strategy employed by HCV to facilitate viral replication in infected cells might simultaneously contribute to progression of the disease. This concept is in agreement with the clinical observation that patients with more advanced liver fibrosis are generally less responsive to IFN therapy.29
Different reports using in vitro assays have suggested that HCV proteins may interfere with the IFN induced Jak‐STAT signalling pathway.30,31,32,33,34 However, most of these studies have been performed under conditions of forced expression of HCV proteins without accompanying HCV replication. In contrast with a previous report34 showing decreased STAT1 expression in cells transfected with HCV genomic and subgenomic constructs, we did not find a substantial decrease in STAT1 protein in replicon cells, possibly due to different experimental conditions and differences in the level of HCV protein expression in the cells. However, in our work, using the HCV replicon system, we found that HCV replication blocks activation of STAT1, STAT2, and STAT3 after stimulation with IFN‐α. This indicates complete interference of HCV with the IFN‐α induced Jak‐STAT signalling cascade. Again, this effect appears to be rather selective as the IFN‐γ signalling pathway remains intact and IFN‐γ induced STAT1 phosphorylation proceeds normally in cells with HCV replicon. These observations are consistent with our findings in CH‐C livers where STAT2 phosphorylation was absent while STAT1 was upregulated and intensely phosphorylated. Taken together these data suggest that IFN‐α signalling was abrogated in HCV infected livers and that the intense STAT1 activation may be due to IFN‐γ which is a key mediator of the inflammatory reaction in CH‐C35 and an inducer and activator of STAT1.36 In fact, we found a relationship between STAT1 expression and the intensity of inflammatory reaction with higher levels of STAT1 mRNA in those with a higher inflammatory score.
HCV interference with IFN‐α signalling led us to investigate expression of different subunits of the IFN‐α receptor. Previous reports using qualitative RT‐PCR and immunohistochemistry,37,38 have shown decreased expression of IFNAR in liver from CH‐C patients exhibiting resistance to IFN‐α therapy. Our study provides new data on IFNAR1 and IFNAR2 splice isoforms. We observed that the two components that are involved both in ligand binding and signal transduction (IFNAR1 and IFNAR2c) are selectively decreased in HCV infected livers while the soluble form (IFNAR2a) was in the normal range. In parallel with these results we found that replication of HCV in Huh7 cells also causes downregulation of IFNR2c.
In summary, HCV reduces STAT3 expression in liver and blocks STAT3 activation by either IFN‐α or CT‐1. In addition, HCV inhibits IFN‐α induced STAT1 and STAT2 activation but does not affect STAT1 phosphorylation by IFN‐γ or CT‐1. The inhibitory effects of HCV on STAT3 expression and on activation of the Jak‐STAT signalling cascade by antiviral and cytoprotective cytokines may favour viral replication while facilitating progression of liver disease.
Acknowledgements
The authors thank Beatriz Carte, Sandra Jusue, and Jose‐Ignacio Riezu for technical advice and helpful comments. This project was supported trough the “UTE” project CIMA”, Instituto de Salud Carlos III C03/C02.
Abbreviations
CH‐C - chronic hepatitis C
CT‐1 - cardiotrophin 1
HCV - hepatitis C virus
IFN - interferon
IFNAR - interferon α/β receptor
IL - interleukin
PIAS - protein inhibitor of activated STAT
RT‐PCR - reverse transcription‐polymerase chain reaction
SOCS - suppressor of cytokine signalling
STAT - signal transducer and activator of transcription
Footnotes
Conflict of interest: None declared.
References
- 1.Ihle J N. The Stat family in cytokine signaling. Curr Opin Cell Biol 200113211–217. [DOI] [PubMed] [Google Scholar]
- 2.David M. Signal transduction by type I interferons. Biotechniques 2002(Suppl)58–65. [PubMed]
- 3.Heim M H. Intracellular signalling and antiviral effects of interferons. Dig Liver Dis 200032257–263. [DOI] [PubMed] [Google Scholar]
- 4.Yang C H, Murti A, Pfeffer L M. STAT3 complements defects in an interferon‐resistant cell line: evidence for an essential role for STAT3 in interferon signaling and biological activities. Proc Natl Acad Sci U S A 1998955568–5572. [DOI] [PMC free article] [PubMed] [Google Scholar]
- 5.Zhu H, Shang X, Terada N.et al STAT3 induces anti‐hepatitis C viral activity in liver cells. Biochem Biophys Res Commun 2004324518–528. [DOI] [PubMed] [Google Scholar]
- 6.Haga S, Terui K, Zhang H Q.et al Stat3 protects against Fas‐induced liver injury by redox‐dependent and ‐independent mechanisms. J Clin Invest 2003112989–998. [DOI] [PMC free article] [PubMed] [Google Scholar]
- 7.Jacoby J J, Kalinowski A, Liu M G.et al Cardiomyocyte‐restricted knockout of STAT3 results in higher sensitivity to inflammation, cardiac fibrosis, and heart failure with advanced age. Proc Natl Acad Sci U S A 200310012929–12934. [DOI] [PMC free article] [PubMed] [Google Scholar]
- 8.Williams L, Bradley L, Smith A.et al Signal transducer and activator of transcription 3 is the dominant mediator of the anti‐inflammatory effects of IL‐10 in human macrophages. J Immunol 2004172567–576. [DOI] [PubMed] [Google Scholar]
- 9.Bustos M, Beraza N, Lasarte J J.et al Protection against liver damage by cardiotrophin‐1: a hepatocyte survival factor up‐regulated in the regenerating liver in rats. Gastroenterology 2003125192–201. [DOI] [PubMed] [Google Scholar]
- 10.Beraza N, Marques J M, Martinez‐Anso E.et al Interplay among cardiotrophin‐1, prostaglandins, and vascular endothelial growth factor in rat liver regeneration. Hepatology 200541460–469. [DOI] [PubMed] [Google Scholar]
- 11.Klein C, Wustefeld T, Assmus U.et al The IL‐6‐gp130‐STAT3 pathway in hepatocytes triggers liver protection in T cell‐mediated liver injury. J Clin Invest 2005115860–869. [DOI] [PMC free article] [PubMed] [Google Scholar]
- 12.Kovalovich K, DeAngelis R A, Li W.et al Increased toxin‐induced liver injury and fibrosis in interleukin‐6‐deficient mice. Hepatology 200031149–159. [DOI] [PubMed] [Google Scholar]
- 13.Taub R. Hepatoprotection via the IL‐6/Stat3 pathway. J Clin Invest 2003112978–980. [DOI] [PMC free article] [PubMed] [Google Scholar]
- 14.Ernst M, Jenkins B J. Acquiring signalling specificity from the cytokine receptor gp130. Trends Genet 20042023–32. [DOI] [PubMed] [Google Scholar]
- 15.Heinrich P C, Behrmann I, Muller‐Newen G.et al Interleukin‐6‐type cytokine signalling through the gp130/Jak/STAT pathway. Biochem J 1998334297–314. [DOI] [PMC free article] [PubMed] [Google Scholar]
- 16.Pestka S. The human interferon alpha species and receptors. Biopolymers 200055254–287. [DOI] [PubMed] [Google Scholar]
- 17.Pfeffer L M, Basu L, Pfeffer S R.et al The short form of the interferon alpha/beta receptor chain 2 acts as a dominant negative for type I interferon action. J Biol Chem 199727211002–11005. [DOI] [PubMed] [Google Scholar]
- 18.Lau J F, Horvath C M. Mechanisms of type I interferon cell signaling and STAT‐mediated transcriptional responses. Mt Sinai J Med 200269156–168. [PubMed] [Google Scholar]
- 19.Stark G R, Kerr I M, Williams B R.et al How cells respond to interferons. Annu Rev Biochem 199867227–264. [DOI] [PubMed] [Google Scholar]
- 20.Krebs D L, Hilton D J. SOCS: physiological suppressors of cytokine signaling. J Cell Sci 20001132813–2819. [DOI] [PubMed] [Google Scholar]
- 21.Song M M, Shuai K. The suppressor of cytokine signaling (SOCS) 1 and SOCS3 but not SOCS2 proteins inhibit interferon‐mediated antiviral and antiproliferative activities. J Biol Chem 199827335056–35062. [DOI] [PubMed] [Google Scholar]
- 22.Chung C D, Liao J, Liu B.et al Specific inhibition of Stat3 signal transduction by PIAS3. Science 19972781803–1805. [DOI] [PubMed] [Google Scholar]
- 23.Liao J, Fu Y, Shuai K. Distinct roles of the NH2‐ and COOH‐terminal domains of the protein inhibitor of activated signal transducer and activator of transcription (STAT) 1 (PIAS1) in cytokine‐induced PIAS1‐Stat1 interaction. Proc Natl Acad Sci U S A 2000975267–5272. [DOI] [PMC free article] [PubMed] [Google Scholar]
- 24.Pietschmann T, Lohmann V, Kaul A.et al Persistent and transient replication of full‐length hepatitis C virus genomes in cell culture. J Virol 2002764008–4021. [DOI] [PMC free article] [PubMed] [Google Scholar]
- 25.Chomczynski P, Sacchi N. Single‐step method of RNA isolation by acid guanidinium thiocyanate‐phenol‐chloroform extraction. Anal Biochem 1987162156–159. [DOI] [PubMed] [Google Scholar]
- 26.Caldenhoven E, van Dijk T B, Solari R.et al STAT3beta, a splice variant of transcription factor STAT3, is a dominant negative regulator of transcription. J Biol Chem 199627113221–13227. [DOI] [PubMed] [Google Scholar]
- 27.Meydan N, Grunberger T, Dadi H.et al Inhibition of acute lymphoblastic leukaemia by a Jak‐2 inhibitor. Nature 1996379645–648. [DOI] [PubMed] [Google Scholar]
- 28.Gotoh B, Takeuchi K, Komatsu T.et al The STAT2 activation process is a crucial target of Sendai virus C protein for the blockade of alpha interferon signaling. J Virol 2003773360–3370. [DOI] [PMC free article] [PubMed] [Google Scholar]
- 29.Shiffman M L, Di Bisceglie A M, Lindsay K L.et al Peginterferon alfa‐2a and ribavirin in patients with chronic hepatitis C who have failed prior treatment. Gastroenterology 20041261015–1023. [DOI] [PubMed] [Google Scholar]
- 30.Heim M H, Moradpour D, Blum H E. Expression of hepatitis C virus proteins inhibits signal transduction through the Jak‐STAT pathway. J Virol 1999738469–8475. [DOI] [PMC free article] [PubMed] [Google Scholar]
- 31.Blindenbacher A, Duong F H, Hunziker L.et al Expression of hepatitis C virus proteins inhibits interferon alpha signaling in the liver of transgenic mice. Gastroenterology 20031241465–1475. [DOI] [PubMed] [Google Scholar]
- 32.Basu A, Meyer K, Ray R B.et al Hepatitis C virus core protein modulates the interferon‐induced transacting factors of Jak/Stat signaling pathway but does not affect the activation of downstream IRF‐1 or 561 gene. Virology 2001288379–390. [DOI] [PubMed] [Google Scholar]
- 33.Duong F H, Filipowicz M, Tripodi M.et al Hepatitis C virus inhibits interferon signaling through up‐regulation of protein phosphatase 2A. Gastroenterology 2004126263–277. [DOI] [PubMed] [Google Scholar]
- 34.Lin W, Choe W H, Hiasa Y.et al Hepatitis C virus expression suppresses interferon signaling by degrading STAT1. Gastroenterology 20051281034–1041. [DOI] [PubMed] [Google Scholar]
- 35.Napoli J, Bishop G A, McGuinness P H.et al Progressive liver injury in chronic hepatitis C infection correlates with increased intrahepatic expression of Th1‐associated cytokines. Hepatology 199624759–765. [DOI] [PubMed] [Google Scholar]
- 36.Bach E A, Aguet M, Schreiber R D. The IFN gamma receptor: a paradigm for cytokine receptor signaling. Annu Rev Immunol 199715563–591. [DOI] [PubMed] [Google Scholar]
- 37.Morita K, Tanaka K, Saito S.et al Expression of interferon receptor genes in the liver as a predictor of interferon response in patients with chronic hepatitis C. J Med Virol 199958359–365. [DOI] [PubMed] [Google Scholar]
- 38.Yatsuhashi H, Fujino T, Matsumoto T.et al Immunohistochemical analysis of hepatic interferon alpha‐beta receptor level: relationship between receptor expression and response to interferon therapy in patients with chronic hepatitis C. J Hepatol 199930995–1003. [DOI] [PubMed] [Google Scholar]


