Abstract
Aim
To analyse 24 hour variations in intraocular pressure (IOP) and central corneal thickness (CCT) in a group of glaucomatous patients.
Methods
30 patients with primary open angle glaucoma were hospitalised and underwent circadian evaluations (at 8 pm, midnight, 4 am, 8 am, noon, and 4 pm) of supine and sitting IOP, respectively, measured using a Perkins and a Goldmann tonometer, and CCT measured using an ultrasonic pachymeter (the mean value of three measurements within 5 μm). All patients were treated with timolol 0.5% twice daily and latanoprost 0.005% once daily.
Results
Mean supine IOP was 15.3 (SD 3.7) mm Hg (range 10–25), with circadian fluctuations of 7.3 (3.3) mm Hg. Mean sitting IOP was 15.1 (3.9) mm Hg (range 8–26), with circadian fluctuations of 5.4 (3.1) mm Hg. Mean CCT was 534 (39) μm (range 443–637 μm) with circadian fluctuations of 16.5 (6.2) μm (range 6–31 μm). Both the within patient and within time point fluctuations in CCT were statistically significant (p<0.0001, ANOVA).
Conclusions
The authors found considerable fluctuations in 24 hour IOP. The circadian fluctuations in CCT were small and, although statistically significant, did not seem to interfere with the circadian IOP assessment.
Keywords: glaucoma, intraocular pressure, corneal central thickness, pachymetry, circadian rhythm
Intraocular pressure (IOP) is an important parameter for glaucoma detection and follow up and, since the beginning of its medical treatment, reducing IOP has been the only way of slowing or halting disease progression. Like all biological parameters, IOP fluctuates over 24 hours,1,2,3,4,5 but the extent of the fluctuations and their importance in glaucoma patients are still debated.6,7,8,9
The “gold standard” for IOP evaluation is Goldmann tonometry, which is highly precise and shows the least interobserver variability. However, various factors can reduce its reliability,10,11,12,13,14 one of the most important of which is central corneal thickness (CCT). Although the effect of CCT on IOP measurements was assumed by Goldmann12 in 1957, and then experimentally demonstrated by Ehlers15 in 1975, it is only recently that the problems in measuring IOP created by refractive surgery have underlined its clinical importance.16,17 Though a number of cross sectional studies have shown that ocular hypertensive eyes have thicker mean CCT,18,19,20,21,22,23 whereas low tension glaucoma (LTG) is characterised by lower mean CCT,19,21,23,24,25 and primary open angle glaucoma (POAG) by normal mean CCT,19,21 individual corneal thickness largely varies and overlaps between groups. Nevertheless, pachymetry is important to correctly classify and diagnose these conditions.18,19,21,23,26
There are still many unanswered questions concerning CCT. First of all, although many correcting factors have been proposed in order to obtain an estimate of “actual” IOP with respect to CCT, there is still no agreement about their clinical usefulness.15,22,23,27,28,29
Furthermore, there is no pachymetric “gold standard.” Ultrasonic pachymeters are the most used in clinical settings; they are generally portable and easy to use, but they require adequate training because probe alignment and perpendicular contact with the central cornea are critical to ensure reliable data.30 Ultrasonic pachymetry provides the most precise CCT measurements,30 and its interoperator and intraoperator reproducibility is good,31 but its accuracy has recently been questioned because it can overestimate CCT in comparison with confocal microscopy.30 In an attempt to avoid these limitations, various non‐contact pachymeters (optical devices, confocal microscopy,32 and optical coherence tomography33) have been introduced into clinical practice.
The variability of corneal thickness is a further controversial issue. Most studies have considered CCT a “static” parameter and ignored its possible fluctuations (as correctly pointed out in Doughty's meta‐analysis34), and more recent studies of CCT variability have considered only daytime fluctuations,31,35 with the exception of Harper's study of circadian variations in normal subjects.36
The aim of this study was to evaluate the circadian fluctuations of CCT in a group of glaucomatous patients, and their potential effects on IOP assessments.
Patients and methods
The study was carried out at the San Paolo Hospital Eye Clinic of the University of Milan. The patients attending the glaucoma service underwent a complete ophthalmic examination in order assess their eligibility, and 30 consecutive glaucomatous patients were enrolled (see table 1). In order to avoid the effects of different medical treatments, only patients treated with an unfixed association of timolol maleate 0.5% twice daily and latanoprost 0.005% once daily were considered.
Table 1 Main patient characteristics.
| Number of subjects | 30 |
| Race, white | 30 |
| Age range, years | 55–84 |
| Sex | 12 F, 18 M |
| Refraction (D), mean (SD) | −0.9 (4.2) |
| MD (dB), mean (SD) | −6.6 (8.0) |
| CPSD (dB), mean (SD) | 5.6 (4.5) |
MD: mean defect; CPSD: corrected pattern standard deviation.
The inclusion criterion was bilateral POAG, defined as an untreated IOP >21 mm Hg (measured on two consecutive occasions separated by an interval of at least 2 hours but no more than 12 weeks), a glaucomatous visual field (on the basis of at least two reliable Humphrey 30–2 full threshold tests), and glaucomatous optic disc changes (evaluated by means of colour stereophotographs) or retinal nerve fibre layer defects (evaluated by means of a scanning laser ophthalmoscope).
The exclusion criteria were low tension, exfoliation, pigmentary or secondary glaucomas; previous refractive surgery; any ocular surgery less than 3 months before enrolment; present or past contact lens wear; present or past corneal disease or injury; significant tear secretion abnormality; significant wake‐sleep rhythm disturbances; and hypnotic drug consumption.
Before enrolment, the procedures and the aims of the study were carefully explained to the patients, who signed an informed consent form approved by the ethics committee of San Paolo Hospital. The study was performed according to the Declaration of Helsinki.
The enrolled patients were hospitalised at 7 pm to undergo a circadian evaluation of CCT, and supine and sitting IOP in one randomly chosen eye (randomisation by means of a list of random numbers), as previously described.4,5 Briefly, the measurements were made at 8 pm, midnight, 4 am, 8 am, noon, and 4 pm; the 8 pm, and 8 am measurements were made before the instillation of timolol maleate 0.5%. Latanoprost was instilled at 10 pm.
One drop of oxibuprocaine and fluorescein was instilled before each measurement. Supine IOP was measured by means of a Perkins tonometer, after which the patients walked about 10 metres to the ophthalmic cabinet and their sitting IOP was measured using a Goldmann tonometer. Finally, CCT was measured on the mid‐pupillary/papillary axis (the mean of three readings within 5 μm) using a DGH 2000 AP ultrasonic pachymeter (DGH Technology Inc, San Diego, CA, USA).
A slit lamp examination was performed before each CCT measurement in order to ensure the absence of corneal epithelial defects. No dilation or gonioscopy was used during the study period in order to avoid any corneal surface damage or distortion.37
Statistical analysis
The tonometric measurements were made by two experienced observers (PF and FM), whose concordance was evaluated before the eligibility examination by means of the calculation of kappa statistics (κ)38 over 50 measurements each using the Perkins and Goldmann tonometers. A cut‐off point of 2 mm Hg (the lowest published interobserver variability for Goldmann tonometry)39 was used to define agreement, which was found to be excellent (κ = 0.84).
The CCT measurements were made by a single observer (PF). Intraobserver agreement was evaluated by comparing 50 CCT measurements of a single eye of a volunteer. Ten measurements were made on the same day at each time point of 8 am, 10 am, noon, 2 pm, and 4 pm, and agreement was defined as the presence of values within plus or minus 5 μm of the mean CCT (corresponding to the 95% confidence interval40). The mean CCT was 507 (SD 3) μm, and the agreement was excellent (κ = 0.94).
The IOP and CCT data are given as mean values, standard deviations, and ranges. The coefficient of variation (COV, defined as the percentage standard deviation divided by the mean) was also calculated in order to facilitate comparisons with the variations reported in other studies.
The t test for paired samples was used to compare mean supine and sitting IOP. Two way analysis of variance for repeated observations38 was used to test the hypothesis that there were no significant within patient or within time point changes in CCT changes during the circadian evaluation.
The Bravais‐Pearson coefficient of linear correlation (ρ) was used to check the correlations between the following variables: mean CCT; variations in CCT (percentage, standard deviation, and COV); mean supine IOP; variations in mean supine IOP; mean sitting IOP; variations in mean sitting IOP; mean defect and corrected pattern standard deviation at standard automated perimetry; and refraction. The correlation was considered negligible if ρ<0.2; weak if 0.2<ρ<0.5; good if 0.5<ρ<0.8; strong if ρ>0.8.38
Results
The key results of the study are summarised in table 2. IOP and CCT data of patients operated of cataract surgery (seven patients) or trabeculectomy (two patients) were comparable to data of patients who did not undergo eye surgery.
Table 2 Main results of the study.
| Supine IOP (mm Hg) | Sitting IOP (mm Hg) | CCT (μm) | |
|---|---|---|---|
| Mean value | 15.3 | 15.1 | 534 |
| Standard deviation | 3.7 | 3.9 | 39 |
| Range | 10–25 | 8–26 | 443–637 |
| Coefficient of variation | 24.2% | 25.8% | 7.3% |
| Mean results at each time point | |||
| 8 pm | 15.2 | 15.3 | 529.8 |
| Midnight | 16.5 | 15.7 | 535.9 |
| 4 am | 15.7 | 15.0 | 538.9 |
| 8 am | 15.9 | 15.2 | 535.5 |
| Noon | 14.2 | 14.9 | 531.7 |
| 4 pm | 14.2 | 14.8 | 529.5 |
| Standard deviation* | 0.93 | 0.34 | 3.8 |
| Coefficient of variation* | 6.1% | 2.6% | 0.7% |
| Mean results per patient over the 24 hours | |||
| Coefficient of variation (SD) | 18.8% (7.5%) | 13.4% (6.7%) | 1.2% (0.4%) |
| Range | 6.6%–33.1% | 3.6%–36.5% | 0.4%–2.4% |
| Mean individual variation | 7.3 (3.3) | 5.4 (3.1) | 16.5 (6.2) |
| Percentage (SD) | 63% (33%) | 45% (33%) | 3.2% (1.2%) |
| Range | 3–15 | 1–17 | 6–31 |
| Percentage | 22%–150% | 7%–189% | 1.1%–6.2% |
*Considering the mean values at the six time points.
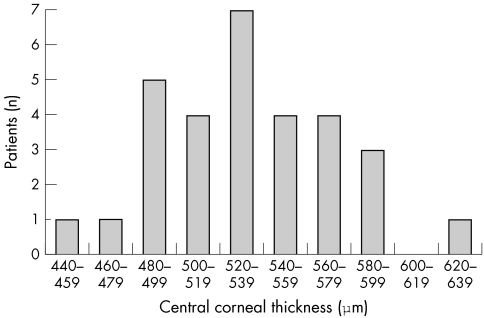
Mean supine IOP was 15.3 (SD 3.7, range 10–25) mm Hg; mean sitting IOP was 15.1 (SD 3.9, range 8–26) mm Hg; and mean CCT was 534 (SD 39, range 443–637) μm (see fig 1 for the distribution of mean CCT values).
Figure 1 Central corneal thickness in the study population.
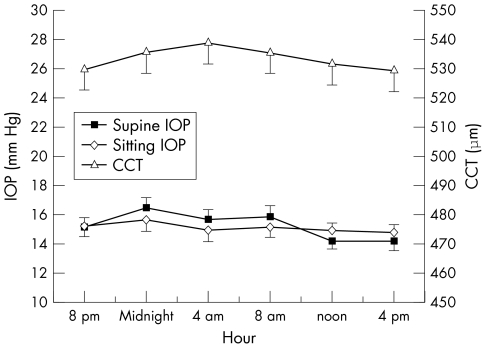
Figure 2 shows the 24 hour curves of mean supine and sitting IOP, and CCT. There were no significant changes in supine IOP at any time point, although it peaked at midnight (16.5 mm Hg) and troughed at noon and 4 pm (14.2 mm Hg), nor any significant change in sitting IOP (mean values between 14.8 mm Hg and 15.7 mm Hg). The same was true when the day and night‐time measurements were compared. Mean time point CCT ranged from 530–539 μm, with a 0.7% COV comparing all time points.
Figure 2 Mean circadian curves of supine IOP (mm Hg), sitting IOP (mm Hg), and CCT (μm). The bars represent standard errors.
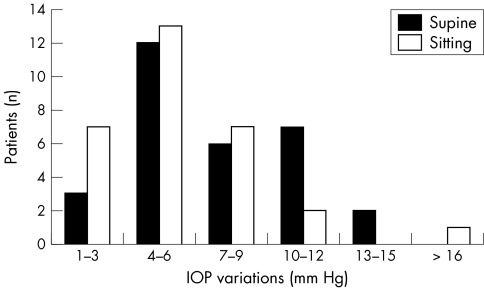
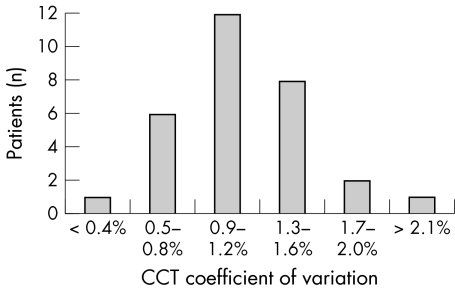
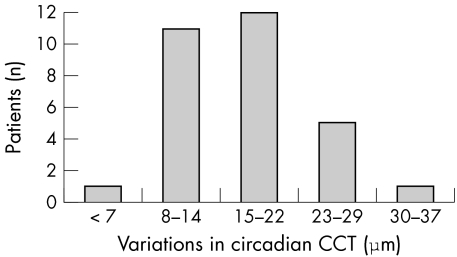
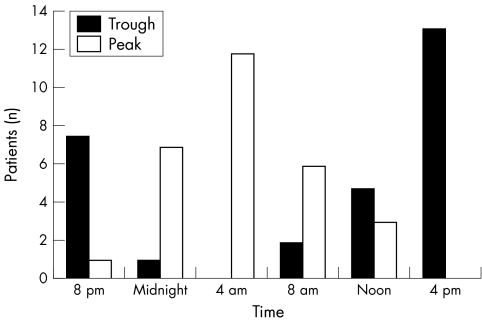
Variability became more important when the within patient curves were considered. The mean variations in supine and sitting IOP were respectively 7.3 (3.3) mm Hg and 5.4 (3.1) mm Hg (fig 3), and mean CCT changes were 16.5 (6.2) μm, with mean COV = 1.2 (0.4%) (figs 4 and 5). The distribution of CCT peaks and troughs over time is shown in figure 6. In terms of the values at each time point, the difference between peak CCT (at 4 am) and trough CCT (at 4 pm) was about 9 μm (p<0.0001, ANOVA; table 3).
Figure 3 Variations in supine and sitting IOP over 24 hours.
Figure 4 Coefficient of variation (COV) of central corneal thickness (CCT) over 24 hours.
Figure 5 Patient CCT variations (μm) over 24 hours.
Figure 6 Frequency of CCT peaks and troughs at each time point. Both distribution curves are gaussian, with mean peaks at 4 am and mean troughs at 4 pm.
Table 3 CCT analysis of variance.
| Source of variation | Degrees of freedom | Sums of squares | Mean square | F test | p Value |
|---|---|---|---|---|---|
| Patients | 29 | 267912,561 | 9238,364 | 300 | <0.0001 |
| Time points | 5 | 2156,361 | 431,272 | 14 | <0.0001 |
| Residual | 145 | 4465,806 | 30,799 | ||
| Total | 179 | 274534,728 |
The Bravais‐Pearson coefficient of linear correlation was negligible or weak for all of the variables except for the good correlations between mean supine IOP and mean CCT (ρ = 0.53), and between mean sitting IOP and mean defect at standard automated perimetry (ρ = 0.64). In particular, there were negligible or weak correlations for CCT COV and CCT (ρ = −0.11), mean supine IOP (ρ = 0.02) and its variation (ρ = 0.11), and mean sitting IOP (ρ = −0.10) and its variation (ρ = 0.42).
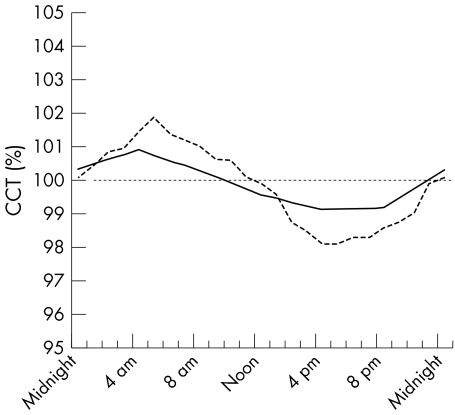
The CCT curve shown in figure 2 was recalculated in terms of the percentage deviation from the mean (considered as 100%) in order to compare it with the circadian CCT curve estimated by Doughty in his meta‐analysis of normal, non‐white subjects.34 As shown in figure 7, the two curves were very similar except for the fact that our 24 hour variations did not exceed plus or minus 1%, whereas Doughty's were about plus or minus 2%.
Figure 7 Percentage CCT fluctuations over 24 hours in this study (solid line, plus or minus 1%) and Doughty's meta‐analysis (broken line, plus or minus 2%). Both curves intersect the 100% line at about 10 am/noon; this is reasonably the best interval in which to measure CCT as it is nearest to its mean value.
Discussion
To the best of our knowledge this is the first study of circadian variations in CCT and their relations to supine and sitting IOP in a group of glaucomatous subjects. A 48 hour study of CCT was published by Harper et al on a small group (n = 8) of normal subjects to evaluate fluctuations in CCT during the sleep phase.36 Conversely, the main objective of the present study was to evaluate circadian CCT variations in a group of glaucomatous patients and their role in the circadian assessment of IOP.
We found very small variations in circadian supine and sitting IOP, with mean values of respectively 15.3 (0.9) mm Hg and 15.1 (0.3) mm Hg; the biggest difference of 2.3 mm Hg found in the supine curve between midnight and noon values was neither clinically nor statistically significant. When comparing this finding with previously published data,1,2,3,4,5 it is necessary to consider the possibility of the treatment induced stabilisation of circadian IOP values.
Greater fluctuations in 24 hour IOP were found when the within patient curves were analysed, with mean variations of 7.3 (range 3–15) mm Hg in supine IOP, and mean variations of 5.4 (range 1–17) mm Hg in sitting IOP. Goldmann tonometry revealed fluctuations of more than 5 mm Hg in about 60% (fig 3) despite the use of treatment schedules that are considered to be very effective in the majority of clinical settings. Although there were no significant differences in daytime v night‐time IOP values, 50% of the supine and 40% of the sitting IOP peaks occurred at midnight or 4 am, thus confirming the clinical importance of circadian IOP evaluations in order to be sure of treatment efficacy in glaucomatous patients.4,5 The timings found in our study seem to confirm previous findings by Liu et al in glaucomatous patients40 and young healthy subjects.41
The mean CCT values were very similar to those reported in the literature.23,34 The high range in CCT values (443–637 μm) in our homogeneous sample of POAG patients receiving the same therapy confirms the importance of individual assessments in better estimating “true” IOP and detecting possible risk factors for disease progression.42
The 24 hour variations in CCT were small: mean within patient variation 16.5 (6.2) μm (3.2 μm (1.2%); range 6–31 μm) and mean COV 1.2 (0.4%) (range 0.4–2.4%). In relation to the mean CCT at each time point, the difference between peak CCT (at 4 am) and trough CCT (at 4 pm) was about 9 μm (p<0.0001). This may reflect the well documented changes in corneal metabolism occurring during the night, with increased lactate and corneal swelling.43
The circadian CCT curve in the present study was very similar to that of Doughty's meta‐analysis of normal, non‐white subjects,34 except for the fact that our fluctuations were smaller (plus or minus 1% v plus or minus 2%). This may have been because of the high degree of intraobserver reproducibility in our study, or to the absence of some factors that may increase CCT variability, such as pregnancy,44 menstruation,45 or oral contraceptive use.46 As shown in figure 7, both curves intersected the 100% line between 10 am and noon, which is probably the best time to measure CCT as it is nearest to its mean value.
There was a good correlation between mean supine IOP and mean CCT (ρ = 0.53), which confirms that an increase in CCT is associated with an increase in IOP. The fluctuations in CCT did not correlate with the other clinical parameters of mean CCT, mean IOP, IOP fluctuations, or refraction.
Harper36 found that CCT varied by 7.2% over 48 hours (with an interval of about 6 hours during the night), as against the 3.2% observed in our study in which the measurements were continued every 4 hours even during the night. One possible reason for decreased variability in the present study is that disturbances in normal sleep‐wake rhythms may change corneal metabolism during the night.
CCT measurements can be theoretically affected when made by means of an ultrasonic pachymeter after applanation tonometry, but two previous studies21,37 found no significant influence, and Damji37 strongly recommended measuring IOP before CCT. Only one study35 has measured CCT before tonometry.
Although avoided in other studies on the grounds that the use of a local anaesthetic may disrupt the epithelial barrier, we followed the usual clinical practice of instilling one drop of oxybuprocaine before our IOP and CCT measurements in order to allow more reliable measurements of both; however, biomicroscopy was regularly used to exclude any changes in the corneal surface at each time point.
It would have been ideally preferable to obtain data from untreated patients because CCT and its variability may be influenced by glaucoma treatment. It has been found that timolol may increase CCT47 and latanoprost may decrease it,48 but the differences from baseline were small (within plus or minus 1%) and can be considered clinically negligible. We therefore preferred to study a homogeneous sample of POAG patients identically treated with the unfixed combination of timolol and latanoprost. No data have been published concerning the effect of glaucoma treatment on circadian fluctuations in CCT.
In conclusion, our data relating to glaucomatous patients suggest that, although statistically significant, circadian CCT fluctuations do not significantly influence circadian IOP measurements, which are crucial when considering glaucoma therapy. With respect to the assumption of Doughty's meta‐analysis that “for eyes with chronic disease, […] even modest changes (that is, 10%) in CCT can be expected to have a measurable impact on tonometry measures,”34 we found fluctuations of only 3%.
Abbreviations
CCT - central corneal thickness
COV - coefficient of variation
CPSD - corrected pattern standard deviation
IOP - intraocular pressure
LTG - low tension glaucoma
MD - mean defect
POAG - primary open angle glaucoma
Footnotes
Ethics approval: #985/2003.
References
- 1.Konstas A G, Katsimbris J M, Lallos N.et al Latanoprost 0.005% versus bimatoprost 0.03% in primary open‐angle glaucoma patients. Ophthalmology 2005112262–266. [DOI] [PubMed] [Google Scholar]
- 2.Konstas A G, Karabatsas C H, Lallos N.et al 24‐Hour intraocular pressures with brimonidine purite versus dorzolamide added to latanoprost in primary open‐angle glaucoma subjects. Ophthalmology 2005112603–608. [DOI] [PubMed] [Google Scholar]
- 3.Liu J H, Kripke D F, Weinreb R N. Comparison of the nocturnal effects of once‐daily timolol and latanoprost on intraocular pressure. Am J Ophthalmol 2004138389–395. [DOI] [PubMed] [Google Scholar]
- 4.Orzalesi N, Rossetti L, Invernizzi T.et al Effect of timolol, latanoprost, and dorzolamide on circadian IOP in glaucoma or ocular hypertension. Invest Ophthalmol Vis Sci 2000412566–2573. [PubMed] [Google Scholar]
- 5.Orzalesi N, Rossetti L, Bottoli A.et al The effect of latanoprost, brimonidine, and a fixed combination of timolol and dorzolamide on circadian intraocular pressure in patients with glaucoma or ocular hypertension. Arch Ophthalmol 2003121453–457. [DOI] [PubMed] [Google Scholar]
- 6.Asrani S, Zeimer R, Wilensky J.et al Large diurnal fluctuations in intraocular pressure are an independent risk factor in patients with glaucoma. J Glaucoma 20009134–142. [DOI] [PubMed] [Google Scholar]
- 7.Bengtsson B, Heijl A. Diurnal IOP fluctuation: not an independent risk factor for glaucomatous visual field loss in high‐risk ocular hypertension. Graefes Arch Clin Exp Ophthalmol 2005243513–518. [DOI] [PubMed] [Google Scholar]
- 8.Mosaed S, Liu J H, Weinreb R N. Correlation between office and peak nocturnal intraocular pressures in healthy subjects and glaucoma patients. Am J Ophthalmol 2005139320–324. [DOI] [PubMed] [Google Scholar]
- 9.Nouri‐Mahdavi K, Hoffman D, Coleman A L.et al Advanced Glaucoma Intervention Study. Predictive factors for glaucomatous visual field progression in the Advanced Glaucoma Intervention Study. Ophthalmology 20041111627–1635. [DOI] [PubMed] [Google Scholar]
- 10.Azuara‐Blanco A, Bhojani T K, Sarhan A R.et al Tono‐Pen determination of IOP in patients with band keratopathy or glued cornea. Br J Ophthalmol 199882634–636. [DOI] [PMC free article] [PubMed] [Google Scholar]
- 11.Drance S M. The coefficient of scleral rigidity in normal and glaucomatous eyes. Arch Ophthalmol 196063668–674. [DOI] [PubMed] [Google Scholar]
- 12.Goldmann H, Schmidt T. Uber applanationstonometrie. Ophthalmologica 1957134221–242. [DOI] [PubMed] [Google Scholar]
- 13.Holladay J T, Allison M E, Prager T C. Goldmann applanation tonometry in patients with regular corneal astigmatism. Am J Ophthalmol 19839690–93. [DOI] [PubMed] [Google Scholar]
- 14.Kaufman H E. Pressure measurement: which tonometer. Invest Ophthalmol Vis Sci 19721180–85. [PubMed] [Google Scholar]
- 15.Ehlers N, Bramsen T, Sperling S. Applanation tonometry and central corneal thickness. Acta Ophthalmol 19755334–43. [DOI] [PubMed] [Google Scholar]
- 16.Mardelli P G, Piebenga L W, Whitacre M M.et al The effect of excimer laser photorefractive keratectomy on intraocular pressure measurements using Goldmann applanation tonometer. Surv Ophthalmol 1997104945–949. [DOI] [PubMed] [Google Scholar]
- 17.Rashad K M, Bahnassy A A. Changes in intraocular pressure after laser in situ keratomileusis. J Refract Surg 200117420–427. [DOI] [PubMed] [Google Scholar]
- 18.Argus W A. Ocular hypertension and central corneal thickness. Ophthalmology 19951021810–1812. [DOI] [PubMed] [Google Scholar]
- 19.Copt R P, Thomas R, Mermoud A. Corneal thickness in ocular hypertension, primary open‐angle glaucoma, and normal tension glaucoma. Arch Opthalmol 1999117104–105. [DOI] [PubMed] [Google Scholar]
- 20.Herman D C, Hodge D O, Bourne W M. Increased corneal thickness in patients with ocular hypertension. Arch Ophthalmol 2001119334–336. [DOI] [PubMed] [Google Scholar]
- 21.Herndon L W, Choudhri S A, Cox T.et al Central corneal thickness in normal, glaucomatous, and ocular hypertensive eyes. Arch Ophthalmol 19971151137–1141. [DOI] [PubMed] [Google Scholar]
- 22.Johnson M, Kass M A, Moses R A.et al Increased corneal thickness simulating elevated intraocular pressure. Arch Ophthalmol 197796664–665. [DOI] [PubMed] [Google Scholar]
- 23.Shah S, Chatterjee A, Mathai M.et al Relationship between corneal thickness and measured intraocular pressure in a general ophthalmology clinic. Ophthalmology 19991062154–2160. [DOI] [PubMed] [Google Scholar]
- 24.Ehlers N, Hansen F K. Central corneal thickness in low‐tension glaucoma. Acta Ophthalmol (Copenh) 197452740–746. [DOI] [PubMed] [Google Scholar]
- 25.Morad Y, Sharon E, Hefetz L.et al Corneal thickness and curvature in normal‐tension glaucoma. Am J Ophthalmol 1998125164–168. [DOI] [PubMed] [Google Scholar]
- 26.Tanaka G H. Corneal pachymetry: a prerequisite for applanation tonometry? Arch Ophthalmol 1998116544–545. [PubMed] [Google Scholar]
- 27.Bron A M, Creuzot‐Garcher C, Goudeau‐Boutillon S.et al Falsely elevated intraocular pressure due to increased central corneal thickness. Graefes Arch Clin Exp Ophthalmol 1999237220–224. [DOI] [PubMed] [Google Scholar]
- 28.Doughty M J, Zamzn M L. Human corneal thickness and its impact on intraocular pressure measures. A review and meta‐analysis approach. Surv Ophthalmol 200044367–408. [DOI] [PubMed] [Google Scholar]
- 29.Whitacre M M, Stein R A, Hassanein K. The effect of corneal thickness on applanation tonometry. Am J Ophthalmol 1993115592–596. [DOI] [PubMed] [Google Scholar]
- 30.McLaren J W, Nau C B, Erie J C.et al Corneal thickness measurement by confocal microscopy, ultrasound, and scanning slit methods. Am J Ophthalmol 20041371011–1020. [DOI] [PubMed] [Google Scholar]
- 31.Miglior S, Albe E, Guareschi M.et al Intraobserver and interobserver reproducibility in the evaluation of ultrasonic pachymetry measurements of central corneal thickness. Br J Ophthalmol 200488174–177. [DOI] [PMC free article] [PubMed] [Google Scholar]
- 32.Li H G, Petroll W M, Moller‐Pedersen T.et al Epithelial and corneal thickness measurements by in vivo confocal microscopy through focusing (CMTF). Curr Eye Res 199716214–221. [DOI] [PubMed] [Google Scholar]
- 33.Feng Y, Varikooty J, Simpson T L. Diurnal variation of corneal and corneal epithelial thickness measured using optical coherence tomography. Cornea 200120480–483. [DOI] [PubMed] [Google Scholar]
- 34.Doughty M J, Zaman M L. Human corneal thickness and its impact on intraocular pressure measures. A review and meta‐analysis approach. Surv Ophthalmol 200044367–408. [DOI] [PubMed] [Google Scholar]
- 35.Shah S, Spedding C, Bhojwani R.et al Assessment of the diurnal variation in central corneal thickness and intraocular pressure for patients with suspected glaucoma. Ophthalmology 20001071191–1193. [DOI] [PubMed] [Google Scholar]
- 36.Harper C L, Boulton M E, Bennett D.et al Diurnal variations in human corneal thickness. Br J Ophthalmol 1996801068–1072. [DOI] [PMC free article] [PubMed] [Google Scholar]
- 37.Damji K F, Muni R H, Munger R M. Influence of corneal variables on accuracy of intraocular pressure measurement. J Glaucoma 20031269–80. [DOI] [PubMed] [Google Scholar]
- 38.Altman D G.Practical statistics for medical research. London: Chapman and Hall, 1991
- 39.Sudesh S, Moseley M J, Thompson J R. Accuracy of Goldmann tonometry in clinical practice. Acta Ophthalmol (Copenh) 199371185–188. [DOI] [PubMed] [Google Scholar]
- 40.Liu J H, Zhang X, Kripke D F.et al Twenty‐four‐hour intraocular pressure pattern associated with early glaucomatous changes. Invest Ophthalmol Vis Sci 2003441586–1590. [DOI] [PubMed] [Google Scholar]
- 41.Liu J H, Kripke D F, Hoffman R E.et al Nocturnal elevation of intraocular pressare in young adults. Invest Ophthalmol Vis Sci 1998392707–2712. [PubMed] [Google Scholar]
- 42.Herndon L W, Weizer J S, Stinnett S S. Central corneal thickness as a risk factor for advanced glaucoma damage. Arch Ophthalmol 200412217–21. [DOI] [PubMed] [Google Scholar]
- 43.Klyce S D. Stromal lactate accumulation can account for corneal oedema osmotically following epithelial hypoxia in the rabbit. J Physiol 198132149–64. [DOI] [PMC free article] [PubMed] [Google Scholar]
- 44.Weinreb R N, Lu A, Beeson C. Maternal corneal thickness during pregnancy. Am J Ophthalmol 1988105258–260. [DOI] [PubMed] [Google Scholar]
- 45.Feldman F, Bain J, Matuk A R. Daily assessment of ocular and hormonal variables throughout the menstrual cycle. Arch Ophthalmol 1978961835–1838. [DOI] [PubMed] [Google Scholar]
- 46.Soni P S. Effects of oral contraceptive steroids on the thickness of human cornea. Am J Optom Physiol Opt 198057825–834. [DOI] [PubMed] [Google Scholar]
- 47.Nielsen C B, Nielsen P J. Effect of alpha‐ and beta‐receptor active drugs on corneal thickness. Acta Ophthalmol (Copenh) 198563351–354. [DOI] [PubMed] [Google Scholar]
- 48.Lass J H, Eriksson G L, Osterling L.et al Latanoprost Corneal Effects Study Group. Comparison of the corneal effects of latanoprost, fixed combination latanoprost‐timolol, and timolol: a double‐masked, randomized, one‐year study Ophthalmology 2001108264–271. [DOI] [PubMed] [Google Scholar]


