

Abstract
Alcohol is known to affect glutamate transmission. However, how chronic alcohol affects the synaptic structure mediating glutamate transmission is unknown. Repeated alcohol exposure in a subject with familial alcoholic history often leads to alcohol addiction. The current study adopts alcohol-preferring rats, which are known to develop high drinking. Two-photon microscopy analysis indicates that chronic alcohol of 14 weeks either, under continuous alcohol (C-Alc) or with repeated deprivation (RD-Alc), causes dysmorphology–– thickened, beaded, and disoriented dendrites that are reminiscent of reactive astrocytes –– in a subpopulation of medium spiny neurons. The density of dendritic spines was found differentially lower in the nucleus accumbens of RD-Alc and C-Alc groups as compared with those of Water groups. Large-sized spines and multiple-headed spines were increased in the RD-Alc group. The NMDA receptor subunit NR1 proteins, as analyzed with western blot, were upregulated in C-Alc, but not in RD-Alc. The upregulated NMDA receptor subunits of NR1 however, are predominantly a splice variant isoform with truncated exon 21, which is required for membrane-bound trafficking or anchoring into a spine synaptic site. These maladaptations may contribute to the transformation of spines. The changes, in density and head-size of spines and the corresponding NMDA receptors, demonstrated an alteration of microcircuitry for glutamate reception. The current study demonstrates for the first time that chronic alcohol exposure causes structural alteration of dendrites and their spines in the key reward brain region in animals that have a genetic background leading to alcohol addiction.
Keywords: Glutamate, NMDA, Extended amygdala, repeated deprivation, medium spiny neurons, Two-photon laser microscopy, postsynaptic, GABA, addiction, genetics, P rats
INTRODUCTION
The addictive component of substance and alcohol abuse is thought to alter neurochemistry and perhaps microcircuitry in the brain. The profound effects of ethanol on the glutamate (GLU) system, among others, may in turn mediate excessive alcohol drinking behavior. Acute ethanol potently inhibits N-methyl-d-aspartate (NMDA)-evoked neuronal activity in a current-dependent manner in the hippocampus, locus ceruleus [8,20,21,34]. In vitro, chronic alcohol treatments increase NMDA binding sites [42] and up-regulate NMDA subunits for NR1 or NR2B mRNA / protein [5,10,14]. In vivo, chronic alcohol either increases [6,12,31,35] or does not change [35] the number of GLU and its antagonist MK801 binding sites in the hippocampus, cortex, or cerebellum, but consistently increases NMDA expression in the hippocampus [35,38]. In reward related brain regions chronic alcohol enhances NMDA sensitivity in the nucleus accumbens (NAc) [33]. Experience-dependent changes in behavior that can persist for months or years may not be mediated simply by changes in neurotransmitter dynamics or receptor characteristics because of the rapid turnover of proteins involved in these processes. Chronic alcohol use, leading to addiction, may result in an adaptive change of dendritic spine structure, which reflects or accommodates the alteration of the postsynaptic complex. Local synaptic activity can cause the appearance of new spines or filopodia [9,22] or change spine shape [18] and spine motility [16] in a NMDA receptor-dependent manner. The active trafficking and docking of GLU receptors, NMDA, and alpha-amino-3-hydroxy-5-methylisoxazole-4-propionate (AMPA) are closely associated with dynamic scaffolding proteins, such as electron-dense postsynaptic density (PSD), homer, and Rac1 as well as signaling molecules which are crucial in determining spine morphology and synaptic function [13,32,41].
Chronic administration of psycho-stimulants amphetamine and cocaine have been shown to affect the structural integrity of neurons and dendrites in the prefrontal cortex, hippocampus, and the reward center nucleus accumbens (NAc) [25,27]. To understand the effects of chronic alcohol on dendrite structure in the NAc, without complication of force or induction paradigms over long-term drinking, we adopted alcohol-preferring (P) rats which can develop into drinking high alcohol content by free choice. To analyze dendritic spines at the single neuron level, we used two-photon microscopy analysis after intracellular Alexa488 fluorescence-filled single neurons. Two chronic alcohol paradigms, simulating daily drinking of multiple alcohol concentrations, with alcohol intake and periodic deprivation were used. We report here that over 14 weeks of chronic alcohol treatment, an extensive structural adaptation along with robust increases of selective NR1 isoforms are developed in the extended amygdala which is known to mediate substances of abuse
MATERIALS AMD METHODS
Animal Treatments
Ethanol-naïve adult (about postnatal day 90) male inbred alcohol-preferring (iP) rats bred in the Indiana Alcohol Research Center were used in the study. The iP rats were obtained from the Indiana University Medical Center / Veterans Affairs Medical Center (Indianapolis, IN) breeding colonies. The animals weighed an average of 380 ± 7 (mean ± SEM) g at the beginning of the experiment. There were no group differences in body weights. Three experimental groups were examined: (a) a water (Water) control group, (b) a continuous access to ethanol (C-Alc) group, and (c) a repeatedly ethanol deprived (RD-Alc) group. After habituation to the vivarium, animals were single-housed in hanging stainless steel cages in a temperature- (21ºC) and humidity- (50%) controlled vivarium. The vivarium was maintained on a 12/12h reverse dark/light cycle (lights off at 0900h). All animals had ad lib access to water and food. Animals used in these procedures were maintained in facilities fully accredited by the Association for the Assessment and Accreditation of Laboratory Animal Care (AAALAC). All experimental procedures were approved by the Institutional Animal Care and Use Committee of the Indiana University School of Medicine (Indianapolis, IN) and are in accordance with the guidelines of the Institutional Animal Care and Use Committee of the National Institute on Drug Abuse, National Institutes of Health, and the Guide for the Care and Use of Laboratory Animals (Institute of Laboratory Animal Resources, Commission on Life Sciences, 1996). Of 42 were used for i
Ethanol drinking procedures
For rats with access to ethanol, all were given concurrent access to multiple concentrations of ethanol (15% and 30%, v/v). It has been shown that access to multiple concentrations of ethanol increases the overall intake of ethanol – as opposed to access to a single concentration of ethanol – in many lines of rats including selectively bred alcohol preferring [30], alcohol non-preferring NP [2], and high alcohol-drinking HAD rats [2]. The C-Alc group had free-choice access to ethanol for 14 weeks. The Water group was run in parallel for 14 weeks. The RD-Alc group had an initial 6 weeks of 24-hr free-choice access to ethanol, followed by 2 cycles of 2 weeks of deprivation from and 2 weeks of re-exposure to ethanol access, making a total of 14 weeks. Re-exposure was initiated 1 hr after the onset of darkness (1000hr). The treatments were spread across the littermates; no more than 2 littermates were present in any one group. This was done to limit the littermate effect. Body weight, water bottle weight, and ethanol solution weights were obtained and recorded at least 3 days per week. Daily values for the intervening days, between the days when weights were recorded, were taken as the average of the prior and subsequent measurements. At the end of the 14-week period, all animals were killed 24 hrs after the last treatment paradigm.
Of total 72 treated rats, 42 rats (14 per treatment group) were used for intracellular microinjection of fluorescent dye and 32 rats with complete dye-filling were used for dendritic and spine analyses; 21 rats (7 per treatment group) were used for Western blotting analysis, and 9 (3 per treatment group) were used for immunocytochemistry.
Intracellular Microinjection of Fluorescent Dye
Upon death, animals were perfused with formaldehyde made fresh from 4% paraformaldehyde and 0.1% picric acid in a phosphate buffer with normal saline. The brains were then removed and sectioned into 400μm slices. For intracellular fluorescent dye injection, sharp electrodes were prepared from borosilicate glass (Warner Instruments) using an electrode puller (Kopf 750, David Kopf Instruments, Tujunga, CA). Electrodes were filled with 5 μl Alexa Fluor 488 (Molecular probes, Invitrogen Co, Carlsbad, CA). Under a Olympus BX 50 WI microscope with an infra-red filter at bright-field setting or a FITC-filter at fluorescent setting, the dye was iontophoresed by passing depolarizing current pulses (300 ms, 20~30 μA, 3 Hz) for 5–10 min into a medium size neuron (12–18μm in diameter), which comprise more than 90% of all neurons in the shell and core of the NAc. The location of the medium spiny neuron (MSN) was noted and the neurons within the nucleus accumbens were compared. The current pulses were generated by a pulse generator (Wavetek 182A, MetricTest, Hayward, CA) and delivered by an amplifier (Neuroprobe 1600, A-M Systems). The injected cells were examined under a fluorescence microscope with the FITC-filter. The MSNs were scanned, and 1024x1024 or 2048x2048 pixel fluorescence image volumes were collected every 0.6μm or 0.4 μm, depending on the resolution required, using a 60x water immersion objective with a BioRad two-photon laser scanning microscope system.
Two-photon Laser Scanning Microscopy (2-photon-LSM)
A BioRad MRC-1024 confocal / multiphoton microscope was used for laser scanning. The BioRad is equipped with Krypton-Argon and Argon lasers, providing fluorescence excitations at 488, 514, and 643 nm, a Titanium-Sapphire laser pumped with a 5 W Argon laser, tunable from 700 to 1000 nm, 3 internal imaging detectors, and 3 external non-descanned detectors for 2-photon imaging, which is attached to a Nikon Eclipse-200 inverted microscope on a TMC air flotation isolation table. The 3-dimensional rendering software permits visualization of 3-D microscopy datasets rendering frame rates up to 25 frames per second. The software packages Metamorph (Universal Imaging, Malvern, PA), Neurolucida-Neuroexplorer (Microbrightfiled Inc., Williston, VT), and 3DMA-Neuron (which is recently established in our laboratory with Dr. Brent Lindquist in SUNY Stony Brook, [17]) were used for analyzing images. They can segment images for feature detection, automatically identify and characterize objects with respect to parameters such as fluorescence power and morphology, and provide a quantitative analysis of spine parameters as indicated below.
3-D Neuronal Image Analysis
Initially, for spine density, NeuroExplorer™ Analysis and Virtual 3-D Image Analysis were both used, and the results compared. The Neurolucida-Neuroexplorer™ (MicroBright Field, Williston, VT) program was used for neuron tracing, and for volumetric and linear quantification of 3-D image volumes. After calibration, the scanned Bio-Rad image stacks were loaded into the Neurolucida™ software and separated into a number of slices based on image separation (z-step). Under the same optical magnification, the spine heads on the dendrites were marked frame by frame in the 3-D volume; dendrite length, the density and length of spines, and the spine distance to the cell body were computed by NeuroExplorer™. For Virtual 3-D Analysis, the serial two-photon images of dendritic and spine morphometry of MSN were similarly reconstructed from the stack of images. Two image planes in the reconstructed 3-D volume were blue- and red- color-coded respectively and visualized at two angles for stereoscopic viewing virtual 3-D images using MetamorphTM (Molecular Devices, Union City, CA) and Voxx (Indiana University). Counting of spines on any specific segment of dendrites was thus conducted in virtual 3-D with a slow rotation to view the dendritic profile at 360o. This avoids missing spines perpendicular to the plane of the dendrites in 2-D view. Our initial finding indicated that the two 3-D-analyses, Neurolucida-Neuroexplorer and virtual 3-D methods, generated similar results. The spine density presented here was adopted from the NeuroExplorer™ Analysis. To further analyze dendritic spine profile, including the density and volume of the spine head, 3DMA-Neuron Analysis was used. The 3DMA-Neuron program was developed at Stony Brook University (Lindquist et al) [17], and modified in our laboratory. 3DMA-Neuron was run on a Dell PC with a Linux operating system. To analyze a dendrite, a backbone (core line) is traced through each dendrite branch. Spines are algorithmically detected based on their distance (in 3-D) to the dendrite backbone, authenticated manually, and color-coded according to spine conformation. The spines were algorithmically identified as thin, stubby, or mushroom shaped according to their 3-D conformation, the nomenclature is similar to that defined earlier in 2-D [24]. Spine statistics on each dendritic segment were then computed. Overall Spine Density (Total #spine/Total length of dendrites) and Mean Spine Density were obtained for each dendritic segment.
A total of 32 animals (Water=9, C-Alc=12, and RD-Alc=11) were used in the spine and dendrite analysis. Three to five neurons were iontophoretically injected in each brain region of each hemisphere. Only fluorescence-fully-filled neurons were analyzed, which accounted for 70% of our injected cells.
Dendritic analyses
The MSN in the nucleus accumbens is characterized by a mostly round cell body, with an average size of 12–18μm in diameter, and with 3–5 dendrites directly derived from soma, each with rich spine decoration. The Centrifugal Ordering method with proximal to distal numbering (from soma) [39] was adopted for branch ordering. The 1st order branches are mostly short, those of 2nd order are longer, while 3rd order branches are considerably longer. In measuring the frequency of neurons undergoing dendritic dysmorphological changes, the fluorescence-fully-filled MSNs were pooled according to treatment with 6 animals per treatment. Three characteristic Dysmorphology were detected and together termed as “Reactive dendrite” resembling “Reactive astrocyte”. The dendritic thickening refers to a segment of dendrites with a diameter exceeding 2–3 times normal diameter, and often is accompanied by rough edges on the dendrite surface. Branch distortion refers to a change in the usual radiating dendritic orientation; in particular such dendrites make reverse turns toward the cell body (over an 180o turning). The beading or varicose formation is defined by formation of large beads (3–4μm in diameter) along the dendrites; the beaded structure can be a swelling beyond the maximal size of varicosities (2–3μm in diameter); [43]. The frequency of occurrence (presence or absence) of any of the above dysmorphology was recorded from total pools of Water=29, C-Alc=27, and Rd-Alc=29 neurons.
Spine Analysis
A spine is defined as a protrusion on a dendrite shaft, consisting of a variable length, narrow neck followed by a head at the distal end and may be stubby- (short neck with a sizable head), mushroom- (long neck, large head), or thin- (narrow neck, small head) shaped. The spine shape is mathematically determined as a function of neck-length and head size by the 3-DMA-Neuron program [17]. Shape classification of our neuron samples will be reported in a separate article. Spines are rarely seen on 1st order branches, but are considerably increased in number on 3rd and 4th order dendritic branches. When a 5th or 6th order dendritic branch exists, its spine distribution is similar to those of 3rd and 4th order branches. Two orders of branches, the 3rd / 4th order, and terminal branches, were analyzed for spine-density and dynamic adaptability respectively. The density-distribution of spines increases both as a function of the branch order as well as a function of the 3-D distance from the 1st to the 3rd / 4th order branch. The analysis of spine density was found to have greater consistency at 3rd or 4th orders beyond 25μm from the soma. When the branching point of the 3rd order branch is too close to the soma (<25μm), a 4th order branch is used for analysis; hereafter the 3rd order branch spine data described below includes this adaptation. The terminal branch is analyzed for its physiological distinction from the 3rd branch; it has been reported to be receptive to changes by psychostimulants [26]. We specifically avoid a terminal branch when it is also a first order branch, as it will have an irregular spine density at the beginning of the branch segment. For spine analyses, two randomly chosen dendrites from each MSN were averaged for each neuron, and the measured neuron parameters within each animal were averaged.
Western Blot Analysis
Adult rat brains were isolated from the three treatment groups described above – Water (n=7), C-Alc (n=7), and RD-Alc (n=7) – and frozen in Tissue-Tek O.T.C.@ (Sakura Finetek, Torrance, CA). The brains were coronally sectioned at 20μm to identify the level used for each sample. Tissues were collected on slides and stored at −80°C until used. Two sets of samples were collected from each brain. One set of 6 sections was isolated from the region that included the nucleus accumbens; the second set included regions of the central amygdala. Tissues were lysed in RIPA (Radio-Immunoprecipitation Assay) buffer at 10μl RIPA buffer / 20μm section [(50mM KCl, 50mM 1-Piperazineethane sulfonic acid, 4-(2-hydroxyethyl)- monosodium salt (Hepes 7.6 pH), 1mM ethylenediamine tetra-acetic acid (EDTA), 1mM dithiothreitol (DTT), 5% glycerol, protease inhibitor cocktail (Complete EDTA-free, Roche Diagnostics)]. Tissue was triturated 1 minute with a pipette, vigorously vortexed, and spun in a centrifuge for 2 minutes at 8,000 RPM. Supernatant was removed, and total protein concentrations were calculated using the Bio-Rad Colorimetric Protein Assay Kit (Bio-Rad, Hercules, CA). Standard curves were constructed using Bovine Serum Albumin (BSA) with serial dilutions from 0.2–0.9 mg/ml. The linear plot for BSA (OD595 versus Concentration mg/ml) was used to estimate all sample concentrations.
All Western blots followed a standard protocol [1,44]. Protein extracts were run on 8- 12% Polyacrylamide Gel Electrophoresis (PAGE) gels using 40μg total protein, then transferred to 45 micron nitrocellulose membrane (Bio-Rad, Hercules, CA). Membranes were stained with Ponceau-S (Sigma) to confer equivalent total protein loads and quality transfer. Gels were stained with Coomassie Blue to assure complete transfer. Membranes were blocked with 5% milk and 0.2% BSA in Tris-Buffered Saline Tween-20 (TBST) overnight, washed 3x in TBST, then incubated 6–8 hours at room temperature using the appropriate primary antibodies. Primary antibodies included: 1) a 21 residue synthetic peptide from the c-terminal region of NR-1 with no overlap at the phosphorylation sites (NR1ct, Upstate Cell Signaling, Lake Placid, NY). This antibody will recognize splice variant isoforms A, B, C, and F. 2) Anti Phospho-NR1 (Ser897) corresponding to amino acids 891–902 (NR1p, Upstate Cell Signaling, Lake Placid, NY). This antibody recognizes NR1 phosphorylated at Serine 897, and NR1 with dually phosphorylated at Serine 896 and 897. Mouse anti-glyceraldehyde-3-phosphate dehydrogenase (GAPDH) primary antibody (Upstate Biotechnology, Lake Placid, NY) was used as an internal control for all Westerns. Membranes were washed 3x in TBST, and incubated with the appropriate secondary antibody conjugated to Horseradish peroxidase (HRP) (Chemicon). HRP development used the Amersham Bioscience ECL-Plus western detection system (Amersham Bioscience, Piscataway, NJ). Blots were developed using CL-Xposure (Pierce, Rockford, IL) x-ray film following the ECL plus protocol. Membranes were stripped in a solution of 100mM 2-mercaptoethanol, 2% sodium dodecyl (lauryl) sulfate (SDS), and 62.5mM Tris-HCl with a pH 6.7 by incubation in a 50oC shaker water bath for 15min in a sealed plastic bag and then re-blocked with 5% dry milk /0.2% BSA/TBST. Membranes were then processed as above using anti-GAPDH primary antibody (adult and embryo tissue) as control. Films were scanned using a flat bed scanner, and images were transferred to NIH Image software.
Image analysis
A total of 6 sections / region / animal for each of three treatment groups (7 isolations per treatment group / three treatment groups) were used for western blot analysis with three different gels run for each protein sample tested. Each lane was measured for density +/− standard error of mean using the NIH Image Software after calibration of the density to a 20-panel OD595 grayscale control, supplied by Kodak (Kodak, Rochester, NY). GAPDH controls were density measured in the same manner to assure equal load per lane. GAPDH for each lane was measured, and slight variations in measurements were adjusted by a percentage to the highest values for that control gel. Measurements for each protein of interest were then measured and adjusted in accordance with the GAPDH load controls for that lane. All measurements for treatment groups were then averaged and reported as an average density measure +/− SEM. Therefore, all changes in a single protein’s expression for each alcohol treatment are reported as a percentage change compared to the Water group with an average of 21 lanes / region / treatment group. Statistical analysis for Westerns used ANVOA repeated measures at 95% confidence followed by post-hoc Fisher’s T-test. All statistics were analyzed using Statview.
Immunocytochemistry of NR1
Within 24 hours of last treatment, the three treatment groups (n=3 each group) were deeply anesthetized with a ketamine cocktail (i.p.1ml/kg), then perfused intracardially with NaCl 0.9% for 90 seconds, followed by 4% paraformaldehyde and 0.4% picric acid in phosphate buffer. The brains were removed and post-fixed overnight in the same fixative. Serial 30 μm coronal sections were then cut. Free floating vibratome sections were prepared and incubated with 3% (v/v) H2O2 in 0.1M phosphate buffered saline (PBS, pH 7.4) for 10 min. Sections were washed three times and preincubated in 0.3% Triton-x-100 for 24 hours before being incubated overnight with antibody against nonphosphorylated NR1ct and phosphorylated NR1p (described above) diluted in PBS containing 0.3% Triton x-100 and 1.5% normal rabbit-serum. The next day the sections were washed three times in PBS, and then incubated with a biotinylated secondary antibody (rabbit-anti-sheep IgG or donkey-anti-guinea pig; 1:250 dilution) for 1.5 h at room temperature. They were rinsed three times in PBS, incubated in avidin-biotin peroxidase complex (ABC, Vector Labs) for 1 h, rinsed three times again in PBS and two times in 0.05 M Tris-buffered saline (TBS) before the addition of 0.05% 3’-3’-diaminobenzidine and 0.003% H2O2 in TBS, which reveals the peroxidase activity. All sections were Nissl-counterstained with 1% methyl green to reveal the overall cellular profile.
Statistical analysis
Statistical analyses of dendritic spine parameters and western blot analysis were performed by averaging across animals. A one-way ANOVA among treatment groups followed by Fisher’s post hoc test was performed with a Statview program (JMP software, Cary, NC) for statistical examination of differences between control animals and treated groups.
RESULTS
Drinking scores
The average ethanol intakes achieved for the 14th week were 10.9 +/− 1.3 (mean +/− S.E.M.) g/kg/day for the RD-Alc animals, and 9.6 +/− 1.2 g/kg/day for the C-Alc animals. Previous work from our laboratory indicates that P rats consuming these amounts of alcohol would achieve blood alcohol concentrations (BACs) in excess of 50 mg% during bouts at the beginning and end of the dark cycle and upon initial re-exposure to alcohol for the RD-Alc group.
Similar to the previous observation, the omnibus 2 x 10 (ethanol treatment x week) ANOVA on ethanol drinking behavior across weeks did not reveal significant differences between the two ethanol treatment conditions; even though the repeatedly deprived animals drank more ethanol during the 1st week of the 1st re-exposure cycle, overall drinking behavior did not differ between the two groups across weeks. The 2 x 5 (ethanol treatment by day of re-exposure) ANOVAs for the daily ethanol consumption across the 1st four days of re-exposure, compared with baseline intake, for the two cycles did not reveal significant increases in ethanol intake upon re-exposure to access after either the 1st or 2nd deprivation cycle.
Dendritic Profile of Medium Spiny Neurons
The normal medium spiny neuron (MSN) has a round or short spindle-shaped cell body of about 12–18μm in diameter and 3–5 multi-branch dendrites of ~ 0.2–1μm in diameter without specific orientation. Each dendrite extends to a length of 50–250μm with a fairly consistent diameter. Each dendrite bifurcates within 10μm of soma, and then commonly branches into 3rd and up to 5th or 6th order, creating a dendritic arborization of about 200–300μm in diameter. Dendrites radiate from the soma without noticeable curvature. No one dendrite appeared to dominate the arborization. Three abnormal dendritic profiles were observed in a subpopulation of the MSN in alcohol treated rats –– thickened, beaded, and reverse-oriented dendrites––which we describe as “Reactive Dendrites” in the Method. Dendritic thickening exceeding 2–3 times normal diameter, occur in one or multiple dendrites of an MSN (Figure 1). Enlargement of dendritic ends are also observed in the alcohol treated groups. Beaded dendrites with large beads greater thatn 3–4μm in diameter occurred in the tertiary or the last segment of the dendrites. These altered structures are not normally seen in the Water group. There is no breakage of dendritic profile observed in any of the three groups. Curving dendrites in which dendrites make reverse turns (> 180o) toward the cell body occurs mostly in the last segment of the dendrites (Figure 1). The above dendritic profiles occurred only in a subpopulation of 10–15% of the MSNs (Table 1), indicating that there is variable sensitivity of the MSNs to alcohol exposure under the current alcohol exposure paradigm and time frame. However, the statistics on combination of the incidence of reactive dendrite is highly significant (see Table 1). The reactive dendrites occurred throughout all 6 rats in C-Alc and RD-Alc examined. Both C-Alc and RD-Alc show dysmorphology in dendritic profiles.
Figure 1.
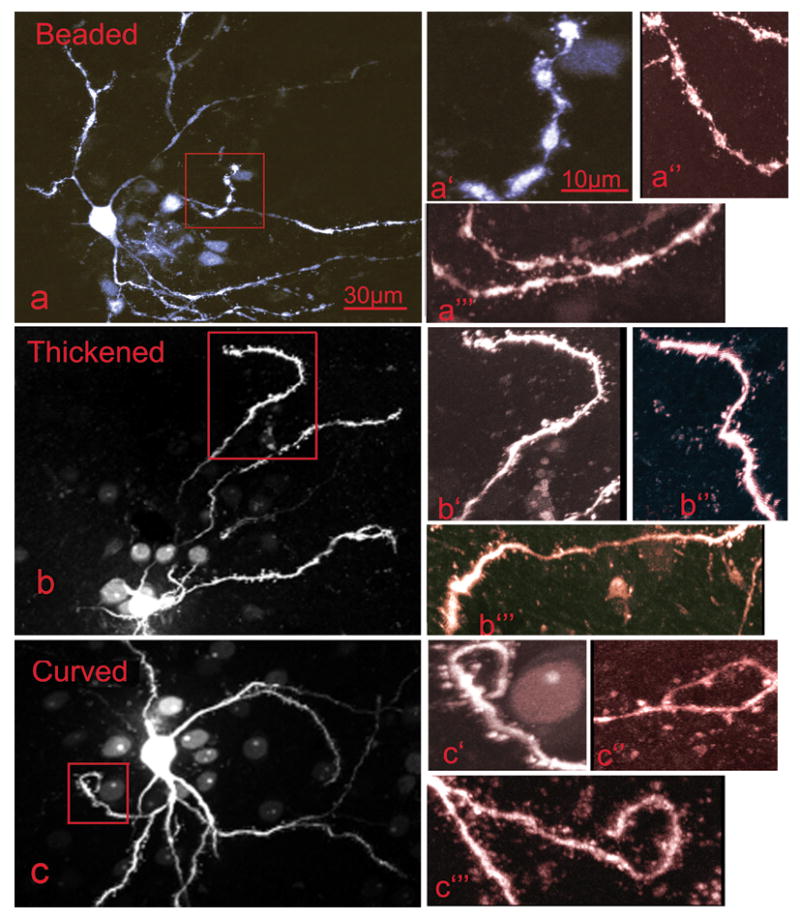
A subpopulation of median spiny neurons in the C-Alc and RD-Alc groups demonstrate dendritic dysmorphology, which is here termed Reactive Dendrites. The reactive dendrites are characterized by beading, thickening, and mis-orientating. Beaded dendrites (a, a′, a″, and a‴) have segmentations or formation of beads along the length of dendrites, in contrast to normal dendrites with smooth contour. Thickened dendrites (b, b′, b″, and b‴) have a diameter of 2–5 fold that of normal. Mis-oriented dendrites (c, c′,c″, and c‴) are tortuous along their length or reversely project toward, instead of radiating away from, the cell body at a terminal branch. The boxed areas featuring the dysmorphology in a, b, c are enlarged in a′, b′ and c′; additional examples for each category are shown in a″,a‴,b″,b‴,c″,and c‴. Scale bars: a, b, c=30μm; a′,a″,a‴,b′,b″,b‴,c′,c″,and c‴=10μm.
Table 1.
The occurrence of median spiny neurons with Reactive Dendrites in nucleus accumbens of Water and Chronic alcohol-exposed groups.
| Water
n=29 cells in 6 rats, |
C-Alc
n=27 cells in 6 rats |
RD-Alc
n=29 cells in 6 rats |
|
|---|---|---|---|
| Thickened | 0% | 0% | 10% |
| Beaded | 0% | 11% | 10% |
| Reverse | 0% | 15% | 14% |
Fisher Exact test. Statistical analysis of Reactive Dendrites which includes thickened, beaded and reversed–– Water vs C-Alc: p=0.002; Water vs RD-Alc: 0.0005; C-Alc vs RD-Alc: 0.56 (Fisher’s Exact test).
Spine analysis
The virtual 3-D views of the spines show a protrusion from the dendrite consisting of a thin neck (0.1–0.2μm diameter) of variable length, and a pin-head of variable shape and size. Morphometric subtypes of spines according to the length of the neck and the volume of the head of the spine include mushroom (long neck, 1.0–5.5μm), stub (short neck, 0.3–1.0μm), and thin (elongated head). A typical distribution of each subtype is shown in Figures 2 and 3. Spines are not evenly distributed on MSN dendrites–– they are characteristically absent in the 1st order, sparse (2–3 per 10μm) in 2nd order, and dense (6–8 per 10μm) in the 3rd and 4th order dendritic branches as observed in the Water group. The spine density of the dendrites of 5th or 6th order, when they exist, is similar to that of the 3rd / 4th order branches. There were no differences in spine density of dendrites from MSNs in the two hemispheres within our paradigms; the data was collapsed and pooled between the two hemispheres.
Figure 2.
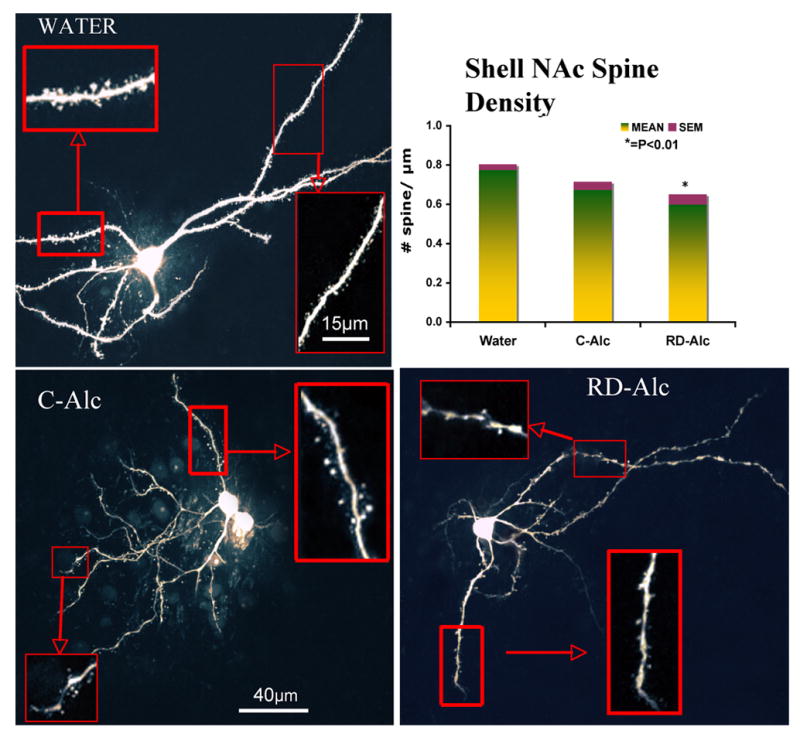
The medium spiny neurons in the shell of nucleus accumbens in the Water (a), Chronic (b), Repeated -deprivation (RD-Alc, c) groups. Dense and mid-size mushroom shape spines are typically seen on dendrites in the Water group. There is a general trend of decrease of spine density upon alcohol exposure. Example of 3rd order branches (solid boxes) and 1st/2nd order branches (dotted boxes) are showed in higher magnification. The analysis of 3rd order branch indicates that a lower spine density was found in the RD-Alc animals as compared with the Water group. Water, n=7; C-Alc, n=5; RD-Alc, n=5 rats. Scale bars:a,b,c=40μm, boxed area=15μm.
Figure 3.
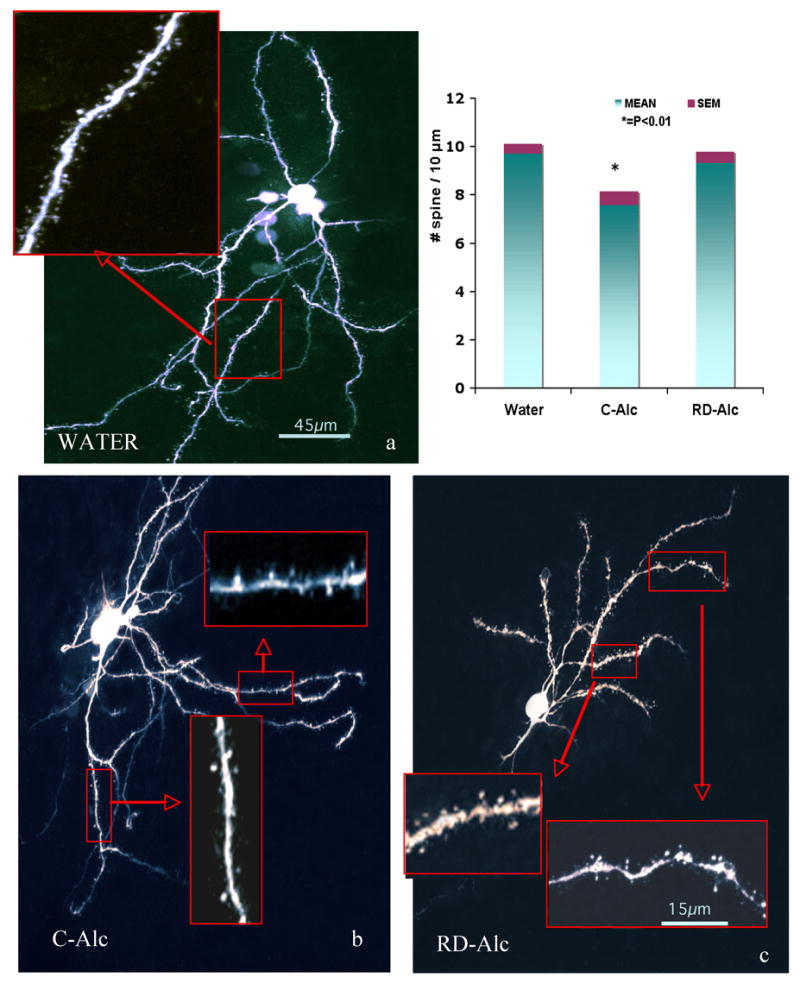
The medium spiny neurons in the core of nucleus accumbens in the Water (a,b), Chronic (c), Repeated-deprivation (RD-Alc, d) groups. Dense and mid-size mushroom shape spines are typically seen on dendrites in the Water group. Analysis of 3rd branches indicates that Lower spine density was found in the Continuous chronic alcohol (C-Alc) animals as compared with that of the Water group. Water, n=7; C-Alc, n=5; RD-Alc, n=5 each. Scale bars:a,b,c=45μm, boxed area=15μm.
After exposure to chronic alcohol, the dendritic spines varied greatly in comparison with those of the Water group. The density of spines from 3rd order as well as the terminal branches is significantly decreased in either the C-Alc group of the core (Figure 3) or the RD-Alc group of the shell of nucleus accumbens (Figure 2). (The shell and core of nucleus accumbens are delineated routinely by our serotonin and tyrosine hydroxylase immunostaining. Under fluorescent-illuminated microscope, surrounding the anterior commissure, the nucleus accumbens is rostral to the olfactory tubercle; the shell division is located medial to the lateral ventricle and ventral the septal nucleus; the core division is lateral to the ventricle and ventral to the striatum). The density of the terminal branch is also decreased in the RD-Alc as compared with that of the Water groups (Figure 4). However, the volume of the spine head is increased in RD-Alc as compared with those of the Water group counterparts (Figure 4). Thus, alcohol rendered smaller or similar spine density, but with larger spine head-size in the MSN in NAc.
Figure 4.
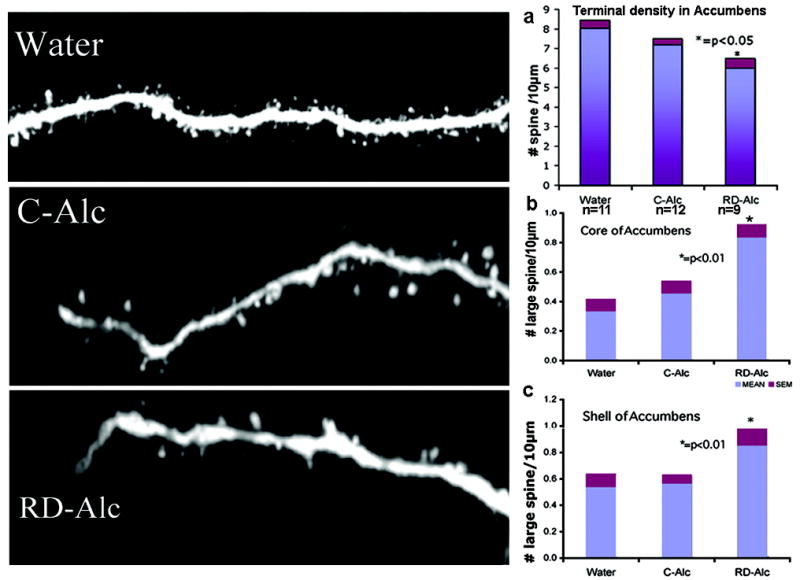
The density of spines in terminal branches of medium spiny neurons in nucleus accumbens is reduced in the RD-Alc group as compared to that of the Water group. The spine density of the terminal branch is similar in the core and shell and is combined in the analysis (a, n=number of rats). Neurolucida 3-D volume analysis for the size of spine shows that large spines with head size greater than 0.9 μm in diameter were increased in RD-Alc groups as compared to those of the Water group. (b) Core: Water, n=23 ; C-Alc, n=18; RD-Alc, n=14 neurons. (c) Shell: Water, n=11; C-Alc, n=14; RD-Alc, n=10 neurons
Two noticeable atypical spine morphologies, multi-headed spines and stacked-head spines, were found in the C-Alc and RD-Alc groups. The multi-headed spines are bifurcates or triplicates emerging from one common neck attached to the dendrite. The stacked-head spines, appear to be one head growing out of the other, are spine heads in serial arrangement (Figure 5). These irregular spine morphologies were found mostly in or beyond 3rd order dendrites in the two chronic alcohol treatments, and were not seen in the Water group, indicating alcohol-induced spine conformational changes.
Figure 5.
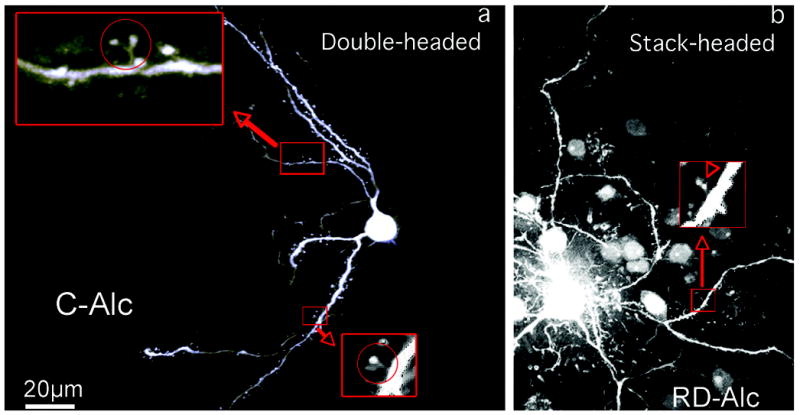
The generation of multiple-headed spines upon chronic alcohol treatment. The double-headed spine has two heads and a common neck to attach to the dendrite (a, circled). The stack-headed spine has two heads in serial and one neck to attach to the dendrite (b, arrowhead). Double-headed (a) and stack-headed spines (b) are increasingly seen in the C-Alc (a) and RD-Alc groups. The boxed areas are enlarged to show the double-headed (circle) and stack-headed spines. Scale bars: a,b=20μm.
Western Blot Analysis of NMDA receptor NR1 Subunit
Two antibodies specific to the C1 or C2 regions were used for detecting splice variants. The anti-NR1-ct antiserum is a rabbit polyclonal antibody against a 21-amino acid C2 cassette peptide of the non-phosphorylated region of Rat NR1 C-terminal; thus, it detects NR1-1a/b and NR1-2a/b. The anti-NR1p antiserum against the phosphorylated C1 cassette of the Rat NR1 C-terminal was used to detect NR1-1a/b and NR1-3a/b; this antiserum also detects the nature of phosphorylation of these NR1 isoforms.
In the brain regions at the level of nucleus accumbens multiple bands are recognized; the size indicates that the upper band (~123kd) coincides with the molecular weight of isoforms NR1-1a and NR1-1b; the lower band (116kd) coincides with isoforms NR1-2a and NR1-2b. Densitometry analysis indicates that a greater than 4-fold increase of NR1-2 isoform (~116kd band) (F(2,57)=357 P=.0001 T-test P<0.001) and 2-fold increase of NR1-1 isoform (~123kd band) (F(2,57)=178 P=.0001 T-test P<0.001) were found in the C-Alc group as compared with those of the Water group. In contrast, a mild increase of NR1-2 isoform with a reduction of NR1-1 isoform was found in the RD-Alc group as compared with those of the Water group (F(2,57)=357 P=.0001 T-test P<0.0001)(F(2,57)=178 P=.0001 T-test P<0.002) respective. In the brain regions at the level of the amygdala, only one band coinciding with a molecular weight of NR1-2 isoform was found; a decrease in the RD-Alc group and no difference in the C-Alc group as compared with those of the Water group were found (F(2,57)=17.5 P=.0001 T-test P<0.0002) (see Figure 6A).
Figure 6.
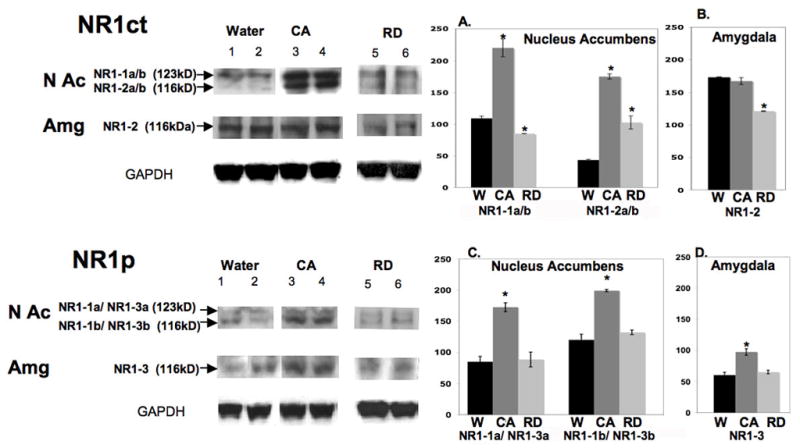
Protein expression of nonphophorylated NR1 (NR1ct, in upper panel) and phosphorylated NR1 (NR1p, in lower panel) in brain regions at the levels of the NAc or Amg. In the Upper panel NR1ct analysis, in the NAc region, a greater than 2.5-fold increase of NR1-1a/b isoform (~123KDa upper band, A) and a smaller increase of NR1-2a/b isoform (~116KDa, lower band, A) were found in the continuous alcohol treated (CA) group as compared to those of the Water (W) group. A mild increase of NR1-1a/b and no change of NR1-2a/b isoform were found in the repeated deprivation (RD) group as compared to those of the Water group (A.). In the brain areas of the amygdala (B.), only NR1-2 isoform was found. A decrease was found in the RD group and no difference in the C-Alc group as compared to that of the Water group. In Lower Panel NR1p analysis, there is a great increase of NR1-1a and NR1-3a (123KD, upper band) and NR1-1b/NR1-3b (116KD, lower band) in the C-Alc group with no difference in the RD group as compared to those of Water group in brain regions of NAc (C.) and Amg (NR1-3, D.). Overall, there is a greater increase of NR1-1 and NR1-2 than NR1-3 isoforms upon continuous chronic alcohol drinking. In densitometry measurement (A-D), ( * ) indicates significant difference by student t-test as compared to water controls (p<0.01). Number of animals tested in nucleus accumbens: Alcohol=7, Water=7 , RD=7; in Amygdala: Alcohol =7, Water =7, RD=7. GAPDH, internal protein control.
The anti-NR1p antiserum also recognizes multiple C-terminal splice variants. According to molecular weight, the upper band coincide with the isoforms NR1-1a / NR1-3a; the lower band coincides with NR1-1b / NR1-3b. Densitometry analysis indicates that in the brain regions at the level of the nucleus accumbens there is a 1.5-fold increase of NR1-1a / NR1-3a (F(2,57)=61.9 P=.0001 T-test P<0.0001) and a ~2-fold increase of NR1-1b/NR1-3b in the C-Alc group (F(2,57)=83.2 P=.0001 T-test P<0.0001), with no difference in the RD-Alc group as compared with those of the Water controls (see Figure 6B). In the brain regions at the level of the amygdala, only one band coinciding with a molecular weight of NR1-3 isoform was found; a increase in the C-Alc group and no difference in the RD-Alc group as compared with those of the Water group were found (F(2,57)=32.9 P=.0001 T-test P<0.0001) (see Figure 6B).
Overall, there is a greater increase of NR1-1, NR1-2, and NR1-3 isoforms upon continuous chronic alcohol drinking; this large increase is diminished or masked in alcohol drinking with repeated deprivations. In the brain regions at the level of the amygdala, only one band coinciding with molecular weight of NR1-2 or NR1-3 isoforms were found; the NR1-1 is missing in this region.
Immunocytochemical analysis of NMDA receptor NR1p
NR1p-immunostaining (NR1-im) labels most neuronal populations known to receive GLU inputs through the brain. These include: cortices, thalamus nuclei, limbic system and extended amygdala with distinct pattern and intensity. An apparent increase of NR1-im intensity was found in the shell of the nucleus accumbens in the C-Alc group as compared with that of the Water control. In contrast, there was an apparent decrease of NR1-im intensity in the RD-Alc group as compared with that of the Water controls (Figure 7). In the amygdala an apparent increase of NR1-im intensity was found in both basolateral and central amygdala in the C-Alc group as compare with those of the Water control. There is no apparent change of NR1-im intensity in the RD-Alc group as compared with those of the Water controls (Figure 8).
Figure 7.
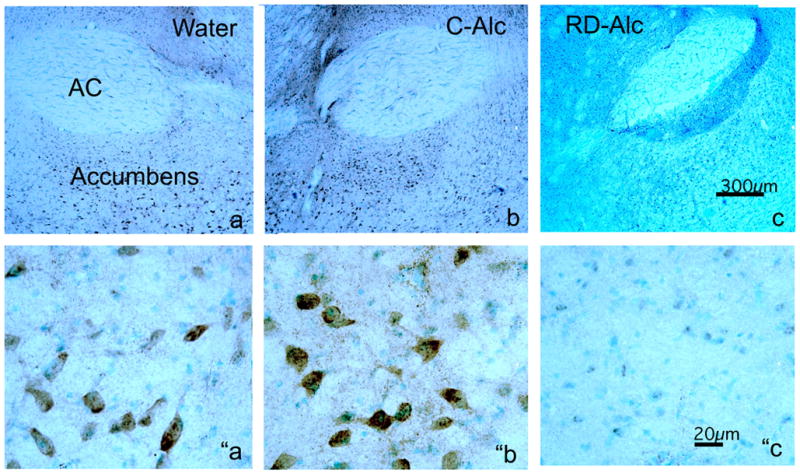
Chronic alcohol on immunostaining (im) of NMDA phosphorylated subunit NR1 (NR1p) in the nucleus accumbens (a,b,c). The intensity of NR1p-im is increased upon continuous chronic alcohol exposure (C-Alc; b and “b) but reduced upon repeated deprivation (RD-Alc; c and “c) as compared with those of the Water control (a and “a). The reduction of the NR1p-im in RD-Alc seem to be more selectively localized in the nucleus accumbens than those shown in Western blot, where entire coronal sections at the nucleus accumbens level were used for analysis. The lower panels are the higher magnification of shell region of nucleus accumbens to show the NR1p-im neurons. AC: anterior commissure, Scale bars: a, b, and c=300μm; “a, ″b, and ”c=20μm.
Figure 8.
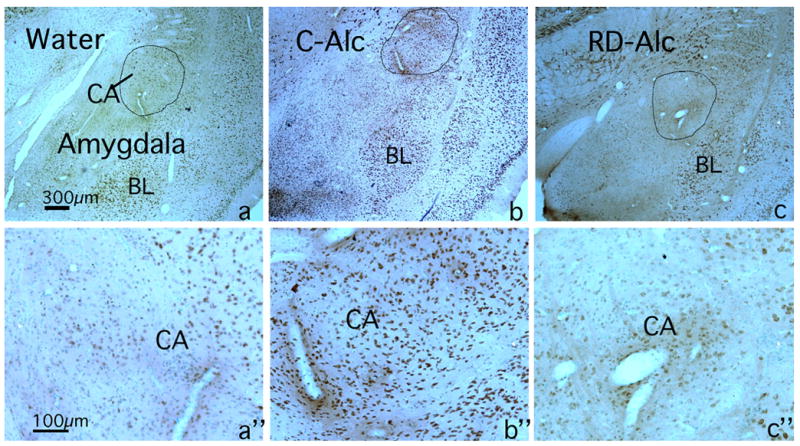
Chronic alcohol on immunostaining (im) of NMDA phosphorylated subunit NR1 (NR1p) in the amygdala region. The intensity of NR1p-im in amygdala is increased upon continuous chronic alcohol exposure (C-Alc; b and b”), but there was no change upon repeated deprivation (RD-Alc; c and c“) as compared with those of Water control (a and “a). The central amygdala (CA, circled) in d, e, and f panel are enlarged in “d, “e, and “f panels respectively to show the NR1p-im neurons. BL: basolateral amygdala. Scale bars: a, b, and c=300μm; a“, b″, and c”=100μm.
DISCUSSION
Reactive Dendrites
We are reporting here that dendrites are a prime structure sensitive to chronic alcohol exposure. The thickening, formation of beads, and alteration of the orientation of dendrites resemble reactive astrocytes responding to physical or chemical insult, hence the term “Reactive Dendrites”. The concept of reactive dendrites is employed to describe the dynamic quality of dendrites capable of reacting to an unusual or altered state. Part of reactive dendritic features, increase in dendrite diameter and formation of beaded dendrites, have also been observed in users of cocaine and amphetamine [25]. We report here that chronic alcohol use, in addition, causes dendritic disorientation. The alteration of dendritic orientation is an interesting feature, since the existing synaptic network (pre- and post-synaptic partners) would have to be moved in orchestration over a distance of tens to hundreds of microns or be unplugged and re-plugged again for new or renewed synaptic partnerships.
Dendritic architecture is critical for integrating synaptic responses from a variety of inputs. Dendritic Thickening is likely a modification of the cytoskeleton such as microtubule, tau and MAP2 protein, but may also reflect the content, which includes a greater number of rough endoplasmic reticulum and cytoplasmic polysomes. Dendritic Beading, from a physical structure point of view, can be large-scale compartmentalization of dendrites in segmentation, limiting the trafficking of functional molecules and electrical activities. Noticeably, these dendritic beads occurred resembling the enlargement of dendritic spines – with restriction (neck) and compartmentalization (head) (Figure 1a). An exhausting beading formation can also be a pathological sign leading towards degeneration [43]. We have previously demonstrated that upon a dose of 10–25mg/kg/day of methamphetamine, similar peculiar beads ranging from a few microns and up to 10μm in diameter (also called varicoses) occurred. Although the term “Reactive dendrites” is borrowed from “Reactive Astrocyte”, besides the morphological analogue, the “Reactive Dendrite” has greater structural and molecular complexity, and potential functional alterations than that of the astrocytes.
Alteration of Spines
We report here, for the first time, that 14 weeks of chronic alcohol exposure reduces spine density in the key brain region mediating reward. Meanwhile, the remaining spines are increasingly enlarged in size. Large spines imply greater synaptic contact area. It is likely that new trafficking and distribution of NMDA, AMPA, and the metabotropic GLU receptor with the alteration of scaffolding proteins such as PSD, homers and Shanks underlie the morphological changes. The increase in multi-headed or stack-headed spines occurred in a number of experience-related circumstances besides chronic alcohol drinking. Cocaine and methamphetamine use [25], short anoxic-hypoglycemic episodes and NMDA receptor activation in brain slices [15] were also reported to have such spine head re-conformation. These morphogenetic events were also reported after long-term potential (LTP)-inducing stimulation and a hippocampus-dependent form of associative learning of trace eyeblink conditioning [11]. The mechanism underlying the formation of multi-headed spines remains unknown, but has been hypothesized due to segmentation of post-synaptic density (PSD) and spine splitting [36,37]. Since the neck is a restriction to electrical propagation, it is likely that such compartmentalization of multiple heads with a single neck connection to the dendrite will process GLU and other transmissions in a significantly different manner than that of the normal single head-and-neck conformation.
Comparison to the other Substances of Abuse
Abuse substances, including cocaine, amphetamine [19,25,27–29] and nicotine [3], increase spine density in the NAc and the frontal and cingulate cortex, while, similar to chronic alcohol use, morphine decreases dendritic branches and spine density [26,29]. Thus, alteration in spine density is a complex phenomenon, which may be altered by severity, dose, pattern, and duration of exposure to such substances. It would be interesting to investigate whether there is a threshold where biphasic alterations occur. On the other hand, common morphological characteristics are found among substances of abuse. Similar to chronic alcohol exposure, cocaine and methamphetamine have also been reported to alter the morphology of spine heads including, an increase in the incidence of spines with multiple heads on MSNs, and large bulbous structures on dendritic terminal tips in the prefrontal cortex [25].
Alcohol Rendered Change in NMDA and Spine Conformation
We have demonstrated, through western blot analysis, that chronic alcohol exposure has great impact on the NR1 receptor protein subunit, and the changes are dependent on two aspects–– the drinking pattern and splice variants. First, overall continuous alcohol drinking greatly increases NR1 in both total protein and its phosphorylated version; it is plausible that chronic alcohol use, by long-term inhibition of NMDA function, triggers compensatory adaptations. Repeated deprivation at the drinking phase, cancel the upregulation of NR1, particularly the NR1-1 isoform. The cancellation may be a recovery phase of the upregulation or an incapability of upregulation — either scenario addresses the maladaptation. Since the RD-Alc animals were analyzed at the drinking phase, our data does not include the maladaptation of NMDA receptor during the midst of the withdrawal phase, which will be an interesting extension of our current study to gain insight on the time course of NMDA maladaptation along with the drinking score. Second, there is a differential alteration on splice variants of NR1. Although all NMDA NR1 isoforms were generally increased in the continuous alcohol drinking group, most of the upregulation occurred in NR1-2, and other Exon 21 / C1 cassette truncated isoforms. The NR1-2 with C1 truncation is a minor isoform in Water control, but is dramatically increased upon continuous chronic alcohol drinking. The C1 cassette of the NR1 subunit is essential for binding neurofilament-L (NF-L) — an important 68 kDa cytoskeletal filament, for anchoring NMDA receptors [7], and for binding yotiao –– a scaffold protein that physically attaches type 1 phosphate kinase with protein kinase A to NMDA receptor to regulate channel activity [40]. The C1 cassette of NR1 also contains the high-affinity Ca++/ calmodulin-binding site that can modulate the Ca++-dependent desensitization of NMDA [23]. Thus, alcohol, known to acutely suppress the function of NMDA receptors, chronically increases the expression of the NMDA NR1 subunit. However, the most upregulated NR1 isoform lacks the major functional C1 domain, which may be an inefficient form for trafficking/anchoring of NMDA receptors to the appropriate functional PSD sites. These inefficient isoforms together with the failure of upregulation of NR1 in RD-Alc imply a maladaptation in upregulation of functional NMDA while attempting to resume GLU transmission. The maladaptation of NMDA receptors if along with other scaffolding proteins would likely contribute to spine conformational changes in the number and size of spines.
Drinking Pattern and Differential Plasticity
The repeat deprivation and continuous alcohol paradigms differ in the period of alcohol exposure and withdrawal, and transient alcohol deprivation effect after first deprivation. We have previously shown that the RD-Alc, but not the C-Alc animals increase D1 receptor binding density of the dorsal striatum and regions of amygdala [4]. The current study demonstrates that alcohol decreases spine density and increases spine head size in the shell of accumbens, and of extended amygdala, to a greater extent after repeated deprivation than after continuous alcohol. The repeated deprivation also causes dendritic thickening, which did not occur in the continuous alcohol paradigm. In contrast, the NMDA receptor upregulation is considerably notable in the continuous alcohol treatment, while either absent or subsided in the RD-Alc group. The lack of upregulation of NR1 NMDA would present greater maladaptation for its failure of compensatory measurements. The potential mechanism reaching toward the addictive drinking state is most likely different between the two drinking paradigms.
Summary of Neuroadaptation upon chronic alcohol at synaptic level in P rats
In summary we report here, for the first time, that 14 weeks of chronic alcohol drinking altered dendrites and their spines in the key brain region mediating reward. The dendrites of a subpopulation of medium spiny neurons become thicker, beaded, and mis-orientated in their projection. Such mis-orientation of dendrites is unique to chronic alcohol among substances of abuse. The chronic alcohol exposed dendrites have fewer spines and a larger spine head. The GLU’s NMDA receptor subunit NR1 increased expression largely with C1 cassette truncated isoforms. The adaptation or maladaptation of the GLU receptor protein and neuronal reception structure imply rewiring of microcircuitry in the key reward processing region of the brain in animals with a genetic propensity for high alcohol drinking. It is, however, not clear if similar observations occur in populations which do not have a genetic background for high alcohol drinking. Study is in progress to address such alternative populations.
Acknowledgments
This study is supported by NIH U01 AA014829 to F.C. Zhou and P50 AA07611 to D. Crabb. We thank Drs. Richard Bell and Robert Sahr for arranging the animals for our treatment in LARC, Mr. Fang Yuan and Ms. Emily Tung for technical support, Dr. Exing Wang and Mr. Jeffrey Clendenon for assisting in Two-photon laser microscopy analysis, and Mr. David Agler for editing the manuscript.
Footnotes
Publisher's Disclaimer: This is a PDF file of an unedited manuscript that has been accepted for publication. As a service to our customers we are providing this early version of the manuscript. The manuscript will undergo copyediting, typesetting, and review of the resulting proof before it is published in its final citable form. Please note that during the production process errors may be discovered which could affect the content, and all legal disclaimers that apply to the journal pertain.
REFERENCS
- 1.Anthony C, Zong Q, De Benedetti A. Overexpression of eIF4E in Saccharomyces cerevisiae causes slow growth and decreased alpha-factor response through alterations in CLN3 expression. J Biol Chem. 2001;276:39645–52. doi: 10.1074/jbc.M101564200. [DOI] [PubMed] [Google Scholar]
- 2.Bell RL, Rodd ZA, Hsu CC, Lumeng L, Li TK, Murphy JM, McBride WJ. Effects of concurrent access to a single concentration or multiple concentrations of ethanol on ethanol intake by periadolescent high-alcohol-drinking rats. Alcohol. 2004;33:107–15. doi: 10.1016/j.alcohol.2004.06.001. [DOI] [PubMed] [Google Scholar]
- 3.Brown RW, Kolb B. Nicotine sensitization increases dendritic length and spine density in the nucleus accumbens and cingulate cortex. Brain Res. 2001;899:94–100. doi: 10.1016/s0006-8993(01)02201-6. [DOI] [PubMed] [Google Scholar]
- 4.Chandler LJ, Carpenter-Hyland E, Hendricson AW, Maldve RE, Morrisett RA, Zhou FC, Sari Y, Bell R, Szumlinski KK. Structural and functional modifications in glutamateric synapses following prolonged ethanol exposure. Alcohol Clin Exp Res. 2006;30:368–76. doi: 10.1097/01.ALC.0000167959.84516.58. [DOI] [PMC free article] [PubMed] [Google Scholar]
- 5.Chandler LJ, Norwood D, Sutton G. Chronic ethanol upregulates NMDA and AMPA, but not kainate receptor subunit proteins in rat primary cortical cultures. Alcohol Clin Exp Res. 1999;23:363–70. [PubMed] [Google Scholar]
- 6.Chen X, Michaelis ML, Michaelis EK. Effects of chronic ethanol treatment on the expression of calcium transport carriers and NMDA/glutamate receptor proteins in brain synaptic membranes. J Neurochem. 1997;69:1559–69. doi: 10.1046/j.1471-4159.1997.69041559.x. [DOI] [PubMed] [Google Scholar]
- 7.Ehlers MD, Fung ET, O’Brien RJ, Huganir RL. Splice variant-specific interaction of the NMDA receptor subunit NR1 with neuronal intermediate filaments. J Neurosci. 1998;18:720–30. doi: 10.1523/JNEUROSCI.18-02-00720.1998. [DOI] [PMC free article] [PubMed] [Google Scholar]
- 8.Engberg G, Hajos M. Ethanol attenuates the response of locus coeruleus neurons to excitatory amino acid agonists in vivo. Naunyn Schmiedebergs Arch Pharmacol. 1992;345:222–6. doi: 10.1007/BF00165740. [DOI] [PubMed] [Google Scholar]
- 9.Engert F, Bonhoeffer T. Dendritic spine changes associated with hippocampal long-term synaptic plasticity. Nature. 1999;399:66–70. doi: 10.1038/19978. [DOI] [PubMed] [Google Scholar]
- 10.Follesa P, Ticku MK. Chronic ethanol-mediated up-regulation of the N-methyl-D-aspartate receptor polypeptide subunits in mouse cortical neurons in culture. J Biol Chem. 1996;271:13297–9. doi: 10.1074/jbc.271.23.13297. [DOI] [PubMed] [Google Scholar]
- 11.Geinisman Y, Berry RW, Disterhoft JF, Power JM, Van der Zee EA. Associative learning elicits the formation of multiple-synapse boutons. J Neurosci. 2001;21:5568–73. doi: 10.1523/JNEUROSCI.21-15-05568.2001. [DOI] [PMC free article] [PubMed] [Google Scholar]
- 12.Grant KA, Valverius P, Hudspith M, Tabakoff B. Ethanol withdrawal seizures and the NMDA receptor complex. Eur J Pharmacol. 1990;176:289–96. doi: 10.1016/0014-2999(90)90022-x. [DOI] [PubMed] [Google Scholar]
- 13.Hering H, Sheng M. Dendritic spines: structure, dynamics and regulation. Nat Rev Neurosci. 2001;2:880–8. doi: 10.1038/35104061. [DOI] [PubMed] [Google Scholar]
- 14.Hu XJ, Follesa P, Ticku MK. Chronic ethanol treatment produces a selective upregulation of the NMDA receptor subunit gene expression in mammalian cultured cortical neurons. Brain Res Mol Brain Res. 1996;36:211–8. doi: 10.1016/0169-328x(95)00223-f. [DOI] [PubMed] [Google Scholar]
- 15.Jourdain P, Nikonenko I, Alberi S, Muller D. Remodeling of hippocampal synaptic networks by a brief anoxia-hypoglycemia. J Neurosci. 2002;22:3108–16. doi: 10.1523/JNEUROSCI.22-08-03108.2002. [DOI] [PMC free article] [PubMed] [Google Scholar]
- 16.Kaech S, Brinkhaus H, Matus A. Volatile anesthetics block actin-based motility in dendritic spines. Proc Natl Acad Sci U S A. 1999;96:10433–7. doi: 10.1073/pnas.96.18.10433. [DOI] [PMC free article] [PubMed] [Google Scholar]
- 17.Koh IY, Lindquist WB, Zito K, Nimchinsky EA, Svoboda K. An image analysis algorithm for dendritic spines. Neural Comput. 2002;14:1283–310. doi: 10.1162/089976602753712945. [DOI] [PubMed] [Google Scholar]
- 18.Korkotian E, Segal M. Bidirectional regulation of dendritic spine dimensions by glutamate receptors. Neuroreport. 1999;10:2875–7. doi: 10.1097/00001756-199909090-00032. [DOI] [PubMed] [Google Scholar]
- 19.Li Y, Robinson TE. Cocaine - induced dendritic plasticity in the nucleus accumbens core ( but not shell ) is associated with the induction of psychomotor sensitization. Soc Neurosci Abstr. 2003;(4243) [Google Scholar]
- 20.Lovinger DM, White G, Weight FF. Ethanol inhibits NMDA-activated ion current in hippocampal neurons. Science. 1989;243:1721–4. doi: 10.1126/science.2467382. [DOI] [PubMed] [Google Scholar]
- 21.Lovinger DM, White G, Weight FF. NMDA receptor-mediated synaptic excitation selectively inhibited by ethanol in hippocampal slice from adult rat. J Neurosci. 1990;10:1372–9. doi: 10.1523/JNEUROSCI.10-04-01372.1990. [DOI] [PMC free article] [PubMed] [Google Scholar]
- 22.Maletic-Savatic M, Malinow R, Svoboda K. Rapid dendritic morphogenesis in CA1 hippocampal dendrites induced by synaptic activity. Science. 1999;283:1923–7. doi: 10.1126/science.283.5409.1923. [DOI] [PubMed] [Google Scholar]
- 23.O’Brien RJ, Lau LF, Huganir RL. Molecular mechanisms of glutamate receptor clustering at excitatory synapses. Curr Opin Neurobiol. 1998;8:364–9. doi: 10.1016/s0959-4388(98)80062-7. [DOI] [PubMed] [Google Scholar]
- 24.Peters A, Kaiserman-Abramof IR. The small pyramidal neuron of the rat cerebral cortex. The perikaryon, dendrites and spines. Am J Anat. 1970;127:321–55. doi: 10.1002/aja.1001270402. [DOI] [PubMed] [Google Scholar]
- 25.Robinson TE, Gorny G, Mitton E, Kolb B. Cocaine self-administration alters the morphology of dendrites and dendritic spines in the nucleus accumbens and neocortex. Synapse. 2001;39:257–66. doi: 10.1002/1098-2396(20010301)39:3<257::AID-SYN1007>3.0.CO;2-1. [DOI] [PubMed] [Google Scholar]
- 26.Robinson TE, Gorny G, Savage VR, Kolb B. Widespread but regionally specific effects of experimenter- versus self-administered morphine on dendritic spines in the nucleus accumbens, hippocampus, and neocortex of adult rats. Synapse. 2002;46:271–9. doi: 10.1002/syn.10146. [DOI] [PubMed] [Google Scholar]
- 27.Robinson TE, Kolb B. Persistent structural modifications in nucleus accumbens and prefrontal cortex neurons produced by previous experience with amphetamine. J Neurosci. 1997;17:8491–7. doi: 10.1523/JNEUROSCI.17-21-08491.1997. [DOI] [PMC free article] [PubMed] [Google Scholar]
- 28.Robinson TE, Kolb B. Alterations in the morphology of dendrites and dendritic spines in the nucleus accumbens and prefrontal cortex following repeated treatment with amphetamine or cocaine. Eur J Neurosci. 1999;11:1598–604. doi: 10.1046/j.1460-9568.1999.00576.x. [DOI] [PubMed] [Google Scholar]
- 29.Robinson TE, Kolb B. Morphine alters the structure of neurons in the nucleus accumbens and neocortex of rats. Synapse. 1999;33:160–2. doi: 10.1002/(SICI)1098-2396(199908)33:2<160::AID-SYN6>3.0.CO;2-S. [DOI] [PubMed] [Google Scholar]
- 30.Rodd-Henricks ZA, Bell RL, Kuc KA, Murphy JM, McBride WJ, Lumeng L, Li TK. Effects of concurrent access to multiple ethanol concentrations and repeated deprivations on alcohol intake of alcohol-preferring rats. Alcohol Clin Exp Res. 2001;25:1140–50. [PubMed] [Google Scholar]
- 31.Sanna E, Serra M, Cossu A, Colombo G, Follesa P, Cuccheddu T, Concas A, Biggio G. Chronic ethanol intoxication induces differential effects on GABAA and NMDA receptor function in the rat brain. Alcohol Clin Exp Res. 1993;17:115–23. doi: 10.1111/j.1530-0277.1993.tb00735.x. [DOI] [PubMed] [Google Scholar]
- 32.Scannevin RH, Huganir RL. Postsynaptic organization and regulation of excitatory synapses. Nat Rev Neurosci. 2000;1:133–41. doi: 10.1038/35039075. [DOI] [PubMed] [Google Scholar]
- 33.Siggins GR, Martin G, Roberto M, Nie Z, Madamba S, De Lecea L. Glutamatergic transmission in opiate and alcohol dependence. Ann N Y Acad Sci. 2003;1003:196–211. doi: 10.1196/annals.1300.012. [DOI] [PubMed] [Google Scholar]
- 34.Simson PE, Criswell HE, Breese GR. Inhibition of NMDA-evoked electrophysiological activity by ethanol in selected brain regions: evidence for ethanol-sensitive and ethanol-insensitive NMDA-evoked responses. Brain Res. 1993;607:9–16. doi: 10.1016/0006-8993(93)91483-9. [DOI] [PubMed] [Google Scholar]
- 35.Snell LD, Nunley KR, Lickteig RL, Browning MD, Tabakoff B, Hoffman PL. Regional and subunit specific changes in NMDA receptor mRNA and immunoreactivity in mouse brain following chronic ethanol ingestion. Brain Res Mol Brain Res. 1996;40:71–8. doi: 10.1016/0169-328x(96)00038-1. [DOI] [PubMed] [Google Scholar]
- 36.Toni N, Buchs PA, Nikonenko I, Bron CR, Muller D. LTP promotes formation of multiple spine synapses between a single axon terminal and a dendrite. Nature. 1999;402:421–5. doi: 10.1038/46574. [DOI] [PubMed] [Google Scholar]
- 37.Toni N, Buchs PA, Nikonenko I, Povilaitite P, Parisi L, Muller D. Remodeling of synaptic membranes after induction of long-term potentiation. J Neurosci. 2001;21:6245–51. doi: 10.1523/JNEUROSCI.21-16-06245.2001. [DOI] [PMC free article] [PubMed] [Google Scholar]
- 38.Trevisan L, Fitzgerald LW, Brose N, Gasic GP, Heinemann SF, Duman RS, Nestler EJ. Chronic ingestion of ethanol up-regulates NMDAR1 receptor subunit immunoreactivity in rat hippocampus. J Neurochem. 1994;62:1635–8. doi: 10.1046/j.1471-4159.1994.62041635.x. [DOI] [PubMed] [Google Scholar]
- 39.Uylings HB, Smit GJ, Veltman WA. Ordering methods in quantitative analysis of branching structures of dendritic trees. Adv Neurol. 1975;12:347–54. [PubMed] [Google Scholar]
- 40.Westphal RS, Tavalin SJ, Lin JW, Alto NM, Fraser ID, Langeberg LK, Sheng M, Scott JD. Regulation of NMDA receptors by an associated phosphatase-kinase signaling complex. Science. 1999;285:93–6. doi: 10.1126/science.285.5424.93. [DOI] [PubMed] [Google Scholar]
- 41.Wiens KM, Lin H, Liao D. Rac1 induces the clustering of AMPA receptors during spinogenesis. J Neurosci. 2005;25:10627–36. doi: 10.1523/JNEUROSCI.1947-05.2005. [DOI] [PMC free article] [PubMed] [Google Scholar]
- 42.Williams K, Pullan LM, Romano C, Powel RJ, Salama AI, Molinoff PB. An antagonist/partial agonist at the polyamine recognition site of the N-methyl-D-aspartate receptor that alters the properties of the glutamate recognition site. J Pharmacol Exp Ther. 1992;262:539–44. [PubMed] [Google Scholar]
- 43.Zhou FC, Bledsoe S. Methamphetamine causes rapid varicosis, perforation and definitive degeneration of serotonin fibers: an immunocytochemical study of serotonin transporter. Neuroscience-Net. 1996:10009. http://www.neuroscience.com/
- 44.Zhou FC, Patel TD, Swartz D, Xu Y, Kelley MR. Production and characterization of an anti-serotonin 1A receptor antibody which detects functional 5-HT1A binding sites. Brain Res Mol Brain Res. 1999;69:186–201. doi: 10.1016/s0169-328x(99)00101-1. [DOI] [PubMed] [Google Scholar]