Abstract
Objectives
To introduce a nomogram of the normal QT interval at various heart rates measured from 24 hour Holter ECG recordings in healthy subjects with respect to age and sex and to use the nomogram to characterise dynamic changes in QT interval in patients with idiopathic ventricular fibrillation (IVF) and the long QT syndrome (LQT).
Methods
The study group consisted of 422 subjects: 249 healthy men ranging in age from 21–88 years (mean (SD) 47 (20) years) and 173 healthy women ranging in age from 21–85 years (47 (19) years). In addition, seven men with IVF ranging in age from 33–53 years (43 (9) years) and five women with LQT ranging in age from 20–55 years (37 (14) years) were studied. For each subject, QT interval and heart rate were determined automatically from 24 hour Holter ECG digital data—namely, QT interval was measured from signal averaged ECG waves obtained by averaging consecutive sinus beats during each 15 second period over 24 hours. Data were grouped and averaged at an interval of 5 beats/min for heart rates ranging from 46–120 beats/min.
Results
In healthy subjects aged < 50 years and ⩾ 50 years QT intervals were longer in women than in men. QT intervals were longer in both men and women aged ⩾ 50 years than in ages < 50 years. From these findings a nomogram of QT interval at varying heart rates adjusted for age (younger group aged < 50 years or older group aged ⩾ 50 years) and sex was determined. In patients with IVF, QT intervals were significantly shorter at slower heart rates than normal values obtained from the nomogram. In patients with LQT, QT intervals were significantly longer at both faster and slower heart rates than normal values.
Conclusions
The nomogram of QT interval at varying heart rates adjusted for sex and age could be used to assess dynamic changes of QT interval of various pathological conditions. For example, patients with IVF had shorter QT interval at slower heart rates, a finding suggestive of arrhythmogenicity of this specific syndrome at night. Patients with LQT had prolonged QT interval at specific heart rate ranges depending on their genotype.
Keywords: nomogram, QT interval, heart rate, age, sex differences, ventricular fibrillation, long QT syndrome
In clinical practice, QT interval is often measured to determine mechanisms of ventricular arrhythmias related to either QT prolongation1,2 or shortening3,4 and to evaluate effects of class III antiarrhythmic drugs.5 Diagnosis of QT interval abnormalities is based on the ECG record for about 10 seconds or more. To compare QT intervals at different heart rates, various correction formulas have been proposed.6,7 Of these, Bazett's formula is used most often because of its simplicity. However, Bazett's equation has been criticised for inaccuracy at both higher and lower heart rates. Recently, computer based QT interval measurement became available for Holter ECG records.8,9 Hence, the objective of this study was to determine a nomogram of the normal QT interval at various heart rates based on automatic measurements of 24 hour Holter ECG recordings from healthy subjects. Evaluation of the QT interval without a correction formula may become possible by using the nomogram of normal QT intervals at various heart rates. To validate the clinical implication of our new nomogram, we studied heart rate dependent changes in the QT interval of patients with idiopathic ventricular fibrillation (IVF) and the long QT syndrome (LQT).
METHODS
Subjects
The study group to establish a nomogram of normal, heart rate dependent QT intervals comprised 422 healthy subjects (249 men, mean (SD) age 47 (20) years; 173 women, mean age 47 (19) years) (table 1). They were obtained from 5433 consecutive patients undergoing a 24 hour Holter ECG examination in our university hospital between 1999 and 2003. None of the 422 subjects had cardiac disease or other morbid conditions known to affect QT interval. No subject was being treated with any drugs affecting QT interval. Patients with IVF (seven men, mean age 43 years) and LQT (five women, mean age 37 years) constituted the validation group to determine the usefulness of our new nomogram. All patients with IVF (four with Brugada‐type ECG and three with J wave in the inferior leads) had syncope and documented episodes of ventricular fibrillation (VF) with ECG recordings not related to reversible factors. All patients with LQT also had a history of syncopal episodes.
Table 1 Age distribution of healthy subjects.
| Age (years) | Men | Women | Total |
|---|---|---|---|
| 20–29 | 77 | 56 | 133 |
| 30–39 | 30 | 15 | 45 |
| 40–49 | 20 | 11 | 31 |
| 50–59 | 43 | 37 | 80 |
| 60–69 | 43 | 30 | 73 |
| 70–79 | 24 | 19 | 43 |
| 80–89 | 12 | 5 | 17 |
| Total | 249 | 173 | 422 |
QT interval measurement from 24 hour Holter ECG
Holter ECGs were recorded with NASA and CM5 leads for 24 hours but only the CM5 lead was used for automatic QT measurements. A digital ECG recording device (FM‐100; Fukuda Denshi, Tokyo, Japan) with a sampling rate of 128 samples/s was used with an automatic measurement system (SCM‐6000, Fukuda Denshi) and QT analysing software (HPS‐QTM, Fukuda Denshi). Signal averaged QRST complexes from the CM5 lead were obtained by summation of consecutive sinus beats of every 15 second period over 24 hours. Therefore, in total 5760 data points were obtained for each subject.
The analysing system determined the top and the end of the T wave automatically, according to the following algorithm. The top of the T wave was determined as the point where the first derivative (dv/dt) of the T wave changed from positive to negative. The end point of the T wave was determined as the point where the first derivative of the T wave became undetectable after the top of the T wave. In each case, the detection level of the first derivative of the T wave was set as the average level of the ST segment.
All measured QT interval data were obtained as a text file from a Holter ECG analyser, which classified the heart rate in steps of 5 beats/min ranging from 41–120 beats/min (see below); it also calculated mean (SD) of the QT interval for each of the heart rate ranges.
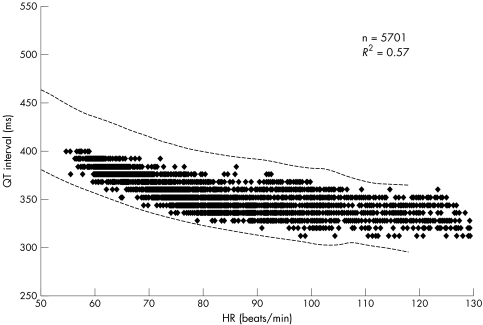
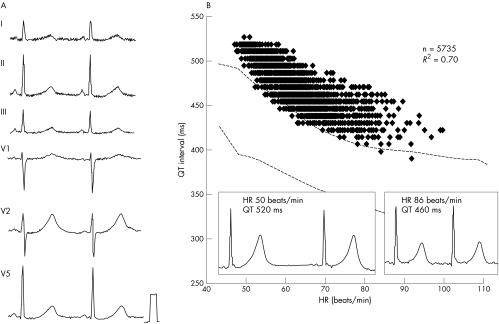
The reliability of QT interval measurements may depend on the shape of the T wave. In this study, we therefore selected subjects according to the following criteria: firstly, the availability of more than 4000 data points during 24 hours; and secondly, a correlation coefficient (r2) ⩾ 0.5 of the regression line between QT interval and heart rate, as fig 1 shows. During 24 hour Holter ECG recordings, inaccuracies of the automatic measurements due to changes in T wave morphology scattered the QT interval plots with heart rate and decreased the r2 value of the regression line.
Figure 1 Representative relation of QT interval to heart rate (HR) during 24 hour Holter ECG recordings from a 50 year old healthy man. Number of data points was 5701 and correlation coefficient (r2) was 0.57. The dotted lines indicate the upper and lower limits of the normal QT interval (mean (2SD)) obtained from the nomogram (table 2). Almost all data points fell into the normal range.
Nomogram of normal QT interval in healthy subjects classified by age and sex
The healthy subjects were divided by age into two groups to evaluate aging effect: a younger group (< 50 years) and an older group (⩾ 50 years). We selected 50 years of age as a dividing line because the median age of men was 49 years and that of women was 51 years. They were also grouped into heart rate categories in steps of 5 beats/min from 46 beats/min to 120 beats/min. We made a nomogram of QT intervals of healthy subjects with reference to age and sex. Circadian change (diurnal time versus nocturnal time) was compared for each heart rate range. Diurnal time was arbitrarily defined as from 6 am to 6 pm and nocturnal time, from 6 pm to 6 am.
QT dynamics in patients with IVF and LQT
For each patient, Holter ECGs were recorded without drug treatment. We compared QT intervals of patients with IVF and LQT with those obtained from the nomogram adjusted for age and sex and calculated the difference between them (QT deviation).
Statistical analysis
Continuous variables are presented as mean (SD). Comparison with mean values between two groups was analysed by an unpaired two tailed Student's t test. Significance was defined as p < 0.05.
RESULTS
QT interval in healthy subjects in relation to age, sex, and circadian rhythm
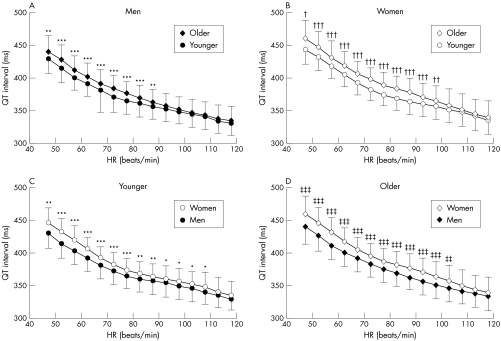
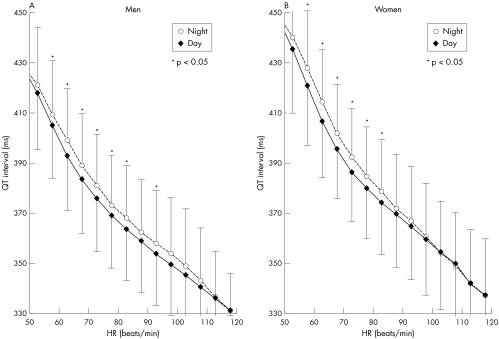
In men, the QT interval of the older group was significantly longer than that of the younger group at heart rates ranging from 46 to 90 beats/min (fig 2). In women, the QT interval was also significantly longer in the older group than in the younger group at heart rates from 46 to 100 beats/min. Women had longer QT intervals than men at heart rates under 110 beats/min in the younger group and under 105 beats/min in the older group. Nocturnal QT intervals had a tendency to be longer than diurnal QT intervals at heart rates under 80 beats/min in both men and women (fig 3).
Figure 2 Influence of age and sex on QT interval at various HRs. (A) In men, the QT interval was longer in the older group than in the younger group at HRs ranging from 46–90 beats/min. (B) In women, the QT interval was longer in the older group than in the younger group at heart rates from 46–100 beats/min. Women had longer QT intervals than men at HRs (C) under 110 beats/min in the younger group and (D) under 105 beats/min in the older group. *p < 0.05, **p < 0.01, ***p < 0.001 v men < 50 years old; †p < 0.05, ††p < 0.01, †††p < 0.001 v women < 50 years old; ‡p < 0.05, ‡‡p < 0.01, ‡‡‡p < 0.001 v men ⩾ 50 years old. Data are mean (SD).
Figure 3 Influence of circadian rhythm on QT interval at various HRs in (A) men and (B) women. Nocturnal QT intervals were longer than diurnal QT intervals at HRs under 80 beats/min in both men and women. *p < 0.05 v daytime. Data are mean (SD).
Nomogram of normal QT intervals adjusted for age and sex
From 422 healthy subjects, the mean (SD) of QT intervals for each heart rate range were determined with respect to sex and age.
Table 2 Nomogram of normal QT interval (ms) obtained from 422 healthy subjects by sex and age group.
| Heart rate (beats/min) | Men | Women | ||
|---|---|---|---|---|
| <50 years | ⩾50 years | <50 years | ⩾50 years | |
| 46–50 | 429 (22) | 440 (25)** | 445 (24)** | 461 (27)† ‡‡‡ |
| 51–55 | 414 (21) | 427 (23)*** | 432 (21)*** | 447 (24)††† ‡‡‡ |
| 56–60 | 402 (20) | 413 (22)*** | 420 (21)*** | 432 (24)††† ‡‡‡ |
| 61–65 | 391 (19) | 402 (21)*** | 405 (19)*** | 419 (21)††† ‡‡‡ |
| 66–70 | 380 (19) | 392 (20)*** | 392 (17)*** | 406 (19)††† ‡‡‡ |
| 71–75 | 372 (19) | 384 (19)*** | 382 (17)*** | 397 (18)††† ‡‡‡ |
| 76–80 | 365 (19) | 376 (19)*** | 374 (17)*** | 389 (18)††† ‡‡‡ |
| 81–85 | 360 (19) | 370 (19)*** | 368 (18)** | 383 (20)††† ‡‡‡ |
| 86–90 | 356 (20) | 363 (19)** | 364 (19)** | 378 (21)††† ‡‡‡ |
| 91–95 | 353 (20) | 357 (20) | 360 (19)* | 371 (21)††† ‡‡‡ |
| 96–100 | 349 (20) | 352 (20) | 356 (20)* | 365 (23)†† ‡‡‡ |
| 101–105 | 346 (21) | 346 (21) | 351 (20)* | 357 (25)‡‡ |
| 106–110 | 340 (20) | 343 (20) | 348 (22)* | 350 (24) |
| 111–115 | 335 (19) | 338 (20) | 341 (21) | 344 (23) |
| 116–120 | 330 (18) | 334 (22) | 334 (21) | 340 (24) |
Data are mean (SD).
*p<0.05, **p<0.01, ***p<0.001 v men <50 years old; †p<0.05, ††p<0.01, †††p<0.001 v women <50 years old; ‡p<0.05, ‡‡p<0.01, ‡‡‡p<0.001 v men ⩾50 years old.
QT intervals in IVF patients
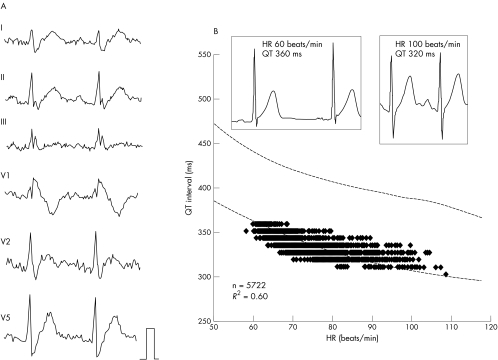
Figure 4 shows a representative QT–heart rate relation obtained from a 49 year old man with the Brugada syndrome. Measured QT intervals at slower heart rates were located around the lower range of normal QT intervals (mean − 2SD) for men aged < 50 years. In seven men with IVF, averaged QT intervals were significantly shorter at heart rates under 80 beats/min than in the nomogram, and the QT deviation ranged from −11 to −20 ms (table 3).
Figure 4 Representative surface ECG and the relation of QT interval to HR in a 49 year old man with idiopathic ventricular fibrillation. (A) The coved‐type ST segment elevation in lead V1 after an episode of ventricular fibrillation suggests that this patient had the Brugada syndrome. (B) In scatter plots of the relation between QT interval and HR, most of the data points fell around the lower limit of the normal QT interval (mean − 2SD).
Table 3 Averaged QT intervals (ms) in seven men with idiopathic ventricular fibrillation (IVF) and five women with the long QT syndrome.
| Heart rate (beats/min) | IVF | Long QT syndrome | ||
|---|---|---|---|---|
| Measured QT | QT deviation | Measured QT | QT deviation | |
| 46–50 | 413 (17) | −18 (17) | 510 (20)** | 60 (17) |
| 51–55 | 394 (16)* | −15 (16) | 496 (24)* | 64 (21) |
| 56–60 | 383 (13)* | −20 (13) | 479 (22)* | 58 (17) |
| 61–65 | 370 (13)* | −18 (13) | 466 (17)** | 59 (14) |
| 66–70 | 364 (13)* | −20 (13) | 457 (16)** | 63 (15) |
| 71–75 | 357 (12)* | −16 (12) | 451 (17)** | 68 (15) |
| 76–80 | 353 (11)* | −13 (11) | 448 (17)** | 72 (13) |
| 81–85 | 351 (12)* | −11 (12) | 444 (19)** | 76 (12) |
| 86–90 | 350 (11) | −8 (11) | 426 (9)* | 66 (9) |
| 91–95 | 347 (11) | −4 (11) | 420 (3)** | 64 (3) |
| 96–100 | 344 (11) | −3 (11) | ||
| 101–105 | 340 (11) | −1 (11) | ||
| 106–110 | 346 (12) | −2 (12) | ||
Data are mean (SD).
*p<0.01, **p<0.001 v normal group shown in table 2.
QT interval in LQT patients
Figure 5 shows a representative QT–heart rate relation obtained from a 37 year old woman with LQT. Measured QT intervals were located above the upper range of normal QT intervals (mean + 2SD) for women aged < 50 years at all heart rate ranges. All five patients with LQT had syncopal episodes during physical exercise and broad based T waves suggesting LQT1. Averaged QT intervals were significantly longer at all heart rate ranges than in the nomogram for healthy subjects, and QT deviation ranged from 58–76 ms (table 3).
Figure 5 Representative surface ECG and the relation of QT interval to HR in a 37 year old woman with the long QT syndrome. (A) The broad based T wave and syncope during physical exercise suggested that this patient had long QT1. (B) In scatter plots of the relation between QT interval and HR, most of the data points fell above the upper limit of the normal QT interval (mean + 2SD).
DISCUSSION
The major findings of the present study were as follows. Firstly, women had longer QT intervals than men for each corresponding heart rate. Secondly, older subjects, both men and women, had longer QT intervals than younger subjects. Thirdly, the nomogram of QT intervals for each heart rate category adjusted for sex and age could be used to determine deviation of the QT interval for patients with ventricular arrhythmias. For example, patients with IVF had a shorter QT interval and patients with LQT had a longer QT interval than healthy subject at particular heart rate ranges.
Nomogram of QT intervals for healthy subjects
Recently the method for QT interval evaluation was roughly divided into two kinds: one is by Bazett's formula and the other is by determining the formula for each subject's QT‐RR relation, such as the liner regression formula and the exponential formula. However, a single formula for the QT‐RR relation cannot be applied to every subject.10 Correction of the QT interval by any rate adjustment methods may have some limitations and the relation between the QT interval and heart rate may vary between subjects.11 In clinical practice, any formulas for heart rate correction can be used for only a narrow rage of heart rates—that is, between 50–70 beats/min.7
On the other hand, Viitasalo and Karjalainen12 reported evaluation of the QT interval without a correction formula. For every heart rate a nomogram provides the QT interval deviation from the QT interval at 60 beats/min.13 They constructed standard values for QT intervals for healthy young men; however, age and sex are well known to significantly affect the QT interval.14 Hence, in the present study, we measured QT interval not only in men but also in women of wider age ranges with an automatic QT measurement system for 24 hour Holter ECG. For this purpose, subjects who have not taken any medicine that would influence the QT interval and who did not have any structural heart disease were selected. Compared with the nomogram by Viitasalo and Karjalainen,12 in our table the mean QT interval in the young male group is slightly longer at heart rates over 80 beats/min (20 ms longer at 90 beats/min).
Effects of sex and age on QT interval
Previous studies showed that women had similar QT intervals to men, but women had faster mean heart rates than men.15 Consequently, the corrected QT intervals for heart rate for women became longer than that for men. Merri et al15 reported that normal QT intervals were 0.392 (0.027) seconds for men and 0.397 (0.030) seconds for women from 423 healthy subjects. These values are very similar to those of the specific age group and at the specific range of heart rate in the present study (table 1). Among subjects with the median age of 35 years Merri et al15 found that the RR interval was longer in men than in women; thus, QTc was significantly longer in women (0.421 (0.018) seconds) than in men (0.409 (0.014 seconds)). The mean differences of QT interval between men and women in various studies have been reported to be 2–6%15,16 and the present study showed mean differences of 4%. This sex based QT interval differences became more pronounced as cycle length increased because women had a greater increase in QT interval at slow heart rates.16 The autonomic nervous system also affects QT interval greatly, and QT–heart rate relations differ in daytime and night time as reported previously.17 Those findings clearly indicate that it would be impossible to determine a normal QT interval that would be applicable to all subject with different sexes, ages, and heart rates.
Sex related differences in QT interval seem to be related to different sex hormone blood concentrations, since the difference is not present at birth and appears only after puberty.18 Mangoni et al19 observed no difference in QT interval between older male and female subjects and supported the hormone mediated theory. In the present study both younger and older (postmenopausal) women had longer QT intervals than age adjusted male groups for every heart rate category, suggesting that not only gonadal hormones but also extragonadal factors may influence the sex differences in QT interval.
Irrespective of sex, QT interval was prolonged along with an increase in age, especially at ages ⩾ 50 years, in both women and men. Several studies have shown the relation between QT interval and age.14,19 Mangoni et al19 showed that aging and body mass index are related to prolongation of the QTc interval. The underlying mechanism of QT prolongation in older subjects is unknown but several factors including cardiac hypertrophy, increased vascular stiffness, and increased aortic impedance are proposed. Women are at risk of drug induced QT prolongation and especially older postmenopausal women are more at risk than younger women. These observations also support the importance of aging to QT prolongation and arrhythmogenicity.
QT interval in IVF
Recent studies suggested that the presence of a prominent transient outward current (Ito) in the right ventricular epicardial layer and genetic abnormalities of the sodium channel gene (SCN5A) may contribute to the characteristic ECG pattern in the Brugada syndrome.20,21,22 Experiments with the wedge preparation of canine heart showed that a downsloping ST segment elevation may be due to earlier repolarisation of the epicardial action potential due to a more intense Ito.23,24 Sodium channel blocking agents induced the coved type of ST elevation in the precordial leads because they accentuated the Ito mediated notch and failed to develop the action potential plateau (loss of dome). We hypothesised that these abnormalities of ionic currents may affect not only the configuration of the ST segment pattern but also ventricular repolarisation dynamics.
In patients with IVF who had a history of recent episodes of VF, QT intervals at slower heart rates were shorter than normal QT intervals at the corresponding heart rates. A shorter QT interval may represent shorter refractoriness of the ventricle suggesting enhanced vulnerability of the ventricle.3 Slower heart rates and increased vagal activity at night increase Ito and decrease the inward calcium current. These changes in ionic currents may reduce the prolongation of the QT interval at night, possibly resulting in the nocturnal occurrence of cardiac arrest in patients with IVF.4,25
Either a reduction of inward currents (sodium or calcium) or an increase in outward currents (delayed rectifier current (IK) or Ito) causes early repolarisation resulting in shortening of the QT interval. In patients with IVF, an increase in Ito may limit the prolongation of the action potential duration, especially at slower heart rates, and may produce a prominent J wave on the surface ECG. During sinus tachycardia, both faster heart rates and an increase in adrenergic tone may offset the excessive Ito and make the difference in QT interval insignificant compared with normal subjects.
A new genetic disease (gain of function of IK channels) characterised by a short QT interval, familial sudden death, and inducible VF has been described.3 Patients have a short QT interval (< 300 ms) with slight modification with heart rate changes. The tall symmetrical T wave may depend on increased phase 2 and 3 outward K currents linked to mutation in the KCNH2 gene.26 In our patients with IVF, the degree of QT shortening is smaller than in genetically identified short QT syndrome. However, we can easily identify short QT intervals in patients with IVF by using the nomogram obtained from the present study.
QT interval in LQT
In the present study, surface ECG patterns of five women with LQT had broad based T wave and showed episodes of syncope during physical stress suggesting LQT1 genotype. No patient had a bifid T wave morphology or episodes of syncope during bradycardia. In patients with LQT, the QT interval was prolonged from normal values at both slower and faster heart rates depending on the patient's genotype. Although the present study was limited by the absence of gene analysis of patients with LQT, the nomogram provides an accurate relation of the measured QT interval with heart rate adjusted normal QT interval.
Limitations
The present study is limited for several reasons. Firstly, artefacts can affect automatic analysis of the 24 hour Holter ECG. A beat to beat noise effect may be cancelled by signal averaged ECG measurements over 15 seconds. However, QT interval changes during respiratory sinus arrhythmia may possibly disappear during averaging. Secondly, we did not find apparent changes in the T wave configuration in healthy subjects, but the morphology and polarity of the T wave may change in patients with structural heart diseases or who are receiving cardiovascular drugs. The QT interval cannot be automatically measured in some patients with heart diseases. Thirdly, the CM5 lead resembling the V5 lead was used in the present study because of the stability and accuracy of automatic measurement. Therefore, the present nomogram may not be applicable to QT intervals measured in other leads—for example, the right precordial leads. Although our study is limited for these reasons, we believe it provides an alternative method for evaluation of the QT interval without correction of heart rate in clinical practice.
ACKNOWLEDGEMENTS
We gratefully acknowledge the technical assistance of Dr Shiro Hayashi in The Central Laboratory, Toyama Medical and Pharmaceutical University.
Abbreviations
IK - delayed rectifier current
Ito - transient outward current
IVF - idiopathic ventricular fibrillation
LQT - long QT syndrome
VF - ventricular fibrillation
References
- 1.Khan I A. Long QT syndrome: diagnosis and management. Am Heart J 20021437–14. [DOI] [PubMed] [Google Scholar]
- 2.Roden D M. Drug‐induced prolongation of the QT interval. N Engl J Med 20043501013–1022. [DOI] [PubMed] [Google Scholar]
- 3.Gaita F, Giustetto C, Bianchi F.et al Short QT syndrome: a familial cause of sudden death. Circulation 2003108965–970. [DOI] [PubMed] [Google Scholar]
- 4.Fujiki A, Sugao M, Nishida K.et al Repolarization abnormality in idiopathic ventricular fibrillation: assessment using 24‐hour QT‐RR and QaT‐RR relationships. J Cardiovasc Electrophysiol 20041559–63. [DOI] [PubMed] [Google Scholar]
- 5.Sadanaga T, Ogawa S, Okada Y.et al Clinical evaluation of the use‐dependent QRS prolongation and the reverse use‐dependent QT prolongation of the class I and III antiarrhythmic agents and their value in predicting efficacy. Am Heart J 1993126114–121. [DOI] [PubMed] [Google Scholar]
- 6.Bazett H C. An analysis of time relations of electrocardiograms. Heart 19207353–370. [Google Scholar]
- 7.Funck‐Brentano C, Jaillon P. Rate‐corrected QT interval: techniques and limitations. Am J Cardiol 19937217B–22B. [DOI] [PubMed] [Google Scholar]
- 8.Merri M, Moss A J, Benhorin J.et al Relation between ventricular repolarization duration and cardiac cycle length during 24‐Holter recordings: findings in normal patients and with long QT syndrome. Circulation 1992851816–1821. [DOI] [PubMed] [Google Scholar]
- 9.Emori T, Ohe T, Aihara N.et al Dynamic relationship between the QaT interval and heart rate in patients with long QT syndrome during 24‐hour Holter ECG monitoring. Pacing Clin Electrophysiol 1995181909–1918. [DOI] [PubMed] [Google Scholar]
- 10.Toivonen L. More light on QT interval measurement. Heart 200287193–194. [DOI] [PMC free article] [PubMed] [Google Scholar]
- 11.Malik M, Färbom P, Batchvarov V.et al Relation between QT and RR intervals is highly individual among healthy subjects: implications for heart rate correction of the QT interval. Heart 200287220–228. [DOI] [PMC free article] [PubMed] [Google Scholar]
- 12.Viitasalo M, Karjalainen J. QT intervals at heart rate from 50 to 120 beats per minute during 24‐hour electrocardiographic recordings in 100 healthy men: effects of atenolol. Circulation 1992861439–1442. [DOI] [PubMed] [Google Scholar]
- 13.Karjalainen J, Viitasalo M, Manttari M.et al Relation between QT intervals and heart rates from 40 to 120 beats/min in rest electrocardiograms of men and a simple methods to adjust QT interval values. J Am Coll Cardiol 1994231547–1553. [DOI] [PubMed] [Google Scholar]
- 14.Reardon M, Malik M. QT interval change with age in an overtly healthy older population. Clin Cardiol 199619949–952. [DOI] [PubMed] [Google Scholar]
- 15.Merri M, Benhorin J, Alberti M.et al Electrocardiographic quantitation of ventricular repolarization. Circulation 1989801301–1308. [DOI] [PubMed] [Google Scholar]
- 16.Kligfield P, Lax K G, Okin P M. QT interval‐heart rate relation during exercise in normal men and women: definition by linear regression analysis. J Am Coll Cardiol 1996281547–1555. [DOI] [PubMed] [Google Scholar]
- 17.Browne K F, Prystowsky E, Heger J J.et al Modulation of the QT interval by autonomic nerves system. Pacing Clin Electrophysiol 198361050–1055. [DOI] [PubMed] [Google Scholar]
- 18.Stramba‐Badiale M, Spagnolo D, Bosi G.et al Are gender differences in QTc present at birth? MISNES investigators. Multicenter Italian study on neonatal electrocardiography and sudden infant death syndrome. Am J Cardiol 1995751277–1278. [PubMed] [Google Scholar]
- 19.Mangoni A A, Kinirons M T, Swift C G.et al Impact of age on QT interval and QT dispersion in healthy subjects: a regression analysis. Age Ageing 200332326–331. [DOI] [PubMed] [Google Scholar]
- 20.Chen Q, Kirsch G E, Zhang D.et al Genetic basis and molecular mechanism for idiopathic ventricular fibrillation. Nature 1998392293–296. [DOI] [PubMed] [Google Scholar]
- 21.Gussak I, Antzelevitch C, Bjerregaard P.et al The Brugada syndrome: clinical, electrophysiologic and genetic aspects. J Am Coll Cardiol 1999335–15. [DOI] [PubMed] [Google Scholar]
- 22.Smits J P P, Eckardt L, Probst V.et al Genotype‐phenotype relationship in Brugada syndrome: electrocardiographic features differentiate SCN5A‐related patients from non‐SCN5A‐related patients. J Am Coll Cardiol 200240350–356. [DOI] [PubMed] [Google Scholar]
- 23.Di Diego J M, Sun Z Q, Antzelevitch C. Ito and action potential notch are smaller in left vs. right canine ventricular epicardium. Am J Physiol 1996271H548–H561. [DOI] [PubMed] [Google Scholar]
- 24.Yan G X, Antzelevitch C. Cellular basis for the Brugada syndrome and other mechanisms of arrhythmogenesis associated with ST‐segment elevation. Circulation 19991001660–1666. [DOI] [PubMed] [Google Scholar]
- 25.Viskin S, Zeltser D, Ish‐Shalom M.et al Is idiopathic ventricular fibrillation a short QT syndrome? Comparison of QT intervals of patients with idiopathic ventricular fibrillation and healthy controls. Heart Rhythm 20041587–591. [DOI] [PubMed] [Google Scholar]
- 26.Brugada R, Hong K, Dumaine R.et al Sudden death associated with short QT syndrome linked to mutations in HERG. Circulation 200410930–35. [DOI] [PubMed] [Google Scholar]


