Abstract
Nonalcoholic steatohepatitis (NASH) is a progressive fibrotic disease, the pathogenesis of which has not been fully elucidated. Here, we report a molecular aspect of this disease elucidated using rabbits fed a cholesterol-rich high-fat diet and exhibiting insulin resistance. The liver in this model showed steatohepatitis with fibrosis and high mRNA expression for some cytokines, heme oxygenase-1, transforming growth factor-β1, and collagen α1(I). Erythrocytes isolated from the model showed marked fragility and the externalization of phosphatidylserine (PS) on the outer leaflet of the membrane and were frequently engulfed by Kupffer cells/macrophages in the hepatic sinusoids. Expression of milk fat globule-epidermal growth factor (EGF)-factor 8, a PS-binding protein, was augmented in the liver. In culture, RAW 264.7 cells engulfed erythrocytes oxidized by tert-butyl hydroperoxide, a process that was inhibited by anti-milk fat globule-EGF-factor 8 antibody. In addition, PS-positive erythrocytes appeared entrapped in the model liver in ex vivo perfusion experiments. Finally, in specimens from NASH patients, the aggregation of erythrocytes in inflammatory hepatic sinusoids was notable. These results indicate that the engulfment of PS-externalized, apoptotic signal-positive, erythrocytes by hepatic macrophages may lead to the deposition of iron derived from hemoglobin in the liver and be involved in the pathogenesis of steatohepatitis.
Obesity and lifestyle-related diseases have become a concern worldwide. In the United States, ∼47 million individuals are estimated to have metabolic syndrome characterized by obesity, hyperlipidemia, hyperglucosemia, and hypertension.1 Nonalcoholic fatty liver disease (NAFLD) is closely related to this syndrome and has become an urgent clinical issue in the field of hepatology. Approximately 12 to 15% of the population is estimated to have NAFLD, and 3 to 4% is considered to suffer from nonalcoholic steatohepatitis (NASH). NASH is also caused by the use of some drugs, parenteral nutrition, hypothyroidism, and gastric bypass surgery.2,3,4,5,6,7,8,9 NASH is a progressive form of NAFLD, is distinguishable from simple steatosis, and is characterized by necroinflammation of the liver with fatty degeneration of hepatocytes. NASH progresses to liver fibrosis and cirrhosis that lead to life-threatening liver failure and the development of hepatocellular carcinoma.2,9,10,11 The histological features of NASH such as macrovesicular steatosis, nuclear glycogenation, lobular and portal inflammation, and iron deposition resemble those of alcoholic liver damage.2,3,4,9,10,12,13 Peroxidation of accumulated lipids may play an important role in the pathogenesis of NASH because it is considered to trigger hepatocellular injury, hepatic fibrogenesis, and the carcinogenesis of hepatocytes.14,15,16
Most studies of NASH that use animals use rodents with genetic alterations (eg, ob/ob mice, fa/fa rats, or phosphatase and tensin homologue deleted on chromosome 10 knockout mice) or those fed a methionine- and choline-deficient diet.17,18,19,20,21 However, these models do not always reflect the clinical and histological features of human NASH. There have been no reports on genetic alterations among patients with NASH, and NASH is closely related to overnutrition and obesity but not to a deficiency of amino acids such as methionine and choline. Therefore, a proper animal model is urgently needed to clarify the molecular pathogenesis of this disease.
In 1983, Buja et al22 established an animal model of human familial hypercholesterolemia with developing atherosclerosis using Watanabe heritable hyperlipidemic rabbits that were fed rabbit chow supplemented with 2% cholesterol and 10% corn oil for 2 weeks. They also reported that New Zealand White rabbits fed a diet high in cholesterol and fat for 2 weeks showed early intimal lipid accumulation in the aorta and prominent lipid accumulation in hepatocytes and macrophages of the liver.22 These animal models have since been used for the study of hypertension, hyperlipidemia, arteriosclerosis, and hyperglucosemia, that is, metabolic syndrome. In the course of re-exploring the models, we discovered that these rabbits exhibit steatohepatitis with fibrosis and thus could be a new model of NASH. Here, the mechanism by which iron accumulates in the liver and its role in the pathogenesis of NASH will be discussed.
Materials and Methods
Materials
Monoclonal antibody against smooth muscle α-actin (SM α-actin), Dulbecco’s modified Eagle’s medium, and fetal bovine serum were obtained from Sigma Chemical Co. (St. Louis, MO). Hamster antibodies against milk fat globule-EGF-factor 8 (MFG-E8) were purchased from Medical & Biological Laboratories (Nagoya, Japan). Monoclonal antibody against glycophorin-A and peroxidase-conjugated secondary antibodies against mouse and rabbit immunoglobulins were from DAKO (Glostrup, Denmark). Alexa Fluor 488 goat anti-mouse IgG2a antibodies and Alexa Fluor 488 goat anti-rabbit IgG antibodies (Molecular Probes, Eugene, OR) were also used as secondary antibodies. Armenian hamster IgG was purchased from BioLegend (San Diego, CA). Enhanced chemiluminescence detection reagent was obtained from Amersham Pharmacia Biotech (Buckinghamshire, UK). Immobilon P membranes were from Millipore Corp. (Bedford, MA). Cell culture inserts were from Falcon (Beckon Dickinson, Franklin Lakes, NJ). Na251CrO4 in sterile saline (37 MBq/ml) was obtained from Daiichi Radioisotope Laboratories Ltd. (Tokyo, Japan). All other reagents were purchased from Sigma Chemical Co. or Wako Pure Chemical Co.
Animals and Induction of Liver Steatosis
Pathogen-free male Japanese White rabbits weighing 3.0 to 3.5 kg were obtained from SLC (Shizuoka, Japan). The rabbits were housed at a constant temperature and supplied with a high-fat diet (HFD) consisting of a standard diet (SD), CR3 (CLEA Japan Inc., Tokyo, Japan), supplemented with 20% corn oil and 1.25% (w/w) cholesterol, ad libitum for 8 weeks. Control rabbits were fed SD. The amount of iron, carbohydrate, amino acids, and other minerals was equivalent between the diets. In some rabbits, a phlebotomy of 35 to 40 ml was performed from the auricular artery weekly during the period. After 8 weeks, the rabbits were anesthetized with an intramuscular injection of ketamine/xylazine (40/5 mg/kg; Sankyo Yell Yakuhin Co. Ltd., Tokyo, Japan/Bayer Corp., Shawnee Mission, KS) and intravenous administration of 1 to 1.5 ml of sodium pentobarbital (20 to 25 mg/kg; Abbott Laboratories, Abbott Park, IL) and then laparotomized. The experiments were humanely conducted in accordance with the recommendations of the Guide for the Care and Use of Laboratory Animals of Osaka City University School of Medicine.
Laboratory Data for Blood Samples
Aspartate aminotransferase (AST), alanine aminotransaminase (ALT), total amount of cholesterol (T-cho), triglyceride (TG), lipid peroxide (LPO), complete blood count (CBC), and hydroxyproline (HP) in the serum were measured at Special Reference Laboratories (Osaka, Japan). The blood sugar (BS) concentration was determined by an enzymatic method using glucose oxidase and peroxidase (Sanwa Kagaku Kenkyusho Co. Ltd., Nagoya, Japan).
Determination of the Serum Insulin Level
The immunoreactive insulin (IRI) level in serum was assayed using a rat insulin enzyme-linked immunosorbent assay kit (Shibayagi Co. Ltd., Gunma, Japan) and rabbit insulin standard solution (Shibayagi Co. Ltd.).
Assay of Hydroxyproline and LPO Levels in the Liver
Wet liver samples (100 mg) were subjected to acid hydrolysis to determine the amount of hydroxyproline as previously described.23 The hepatic level of LPO was determined using a Bioxytech LPO-586 assay kit (Oxis Health Products Inc., Portland, OR) according to the manufacturer’s directions. The data were expressed as the amount of hydroxyproline (mg) or LPO (μmol)/wet liver weight (g).
Terminal dUTP Nick-End Labeling (TUNEL) Staining
For the detection of apoptosis, paraffin-embedded sections were stained with the TUNEL technique using an In Situ Apoptosis Detection kit (Takara Shuzo Co. Ltd., Ohtsu, Japan) according to the manufacturer’s directions. For the semiquantitative analysis, the number of TUNEL-positive cells was counted in five randomly selected fields from each slide at a magnification of ×400.
Histochemical and Immunohistochemical Analyses of Rabbit Liver
Immunohistochemistry was performed according to methods described elsewhere.22,23 Rabbits were anesthetized, and the portal vein was cannulated with an 18-gauge Teflon catheter. The liver of each animal was perfused with 100 ml of phosphate-buffered saline (PBS) to remove the blood and then fixed with 4% paraformaldehyde or Bouin’s fluid. Each sample was embedded in paraffin or frozen according to methods described elsewhere.24,25 Paraformaldehyde-fixed specimens were cut into 5-μm-thick sections and stained for 1 hour with 0.1% (w/v) Sirius Red (Direct Red 80; Aldrich, Milwaukee, WI), hematoxylin and eosin (H&E), and Azan-Mallory.26 Berlin blue, Nile blue, Sudan black, and silver stainings were performed at Kyodo Byori Inc. (Kobe, Japan). Immunostaining of 4-hydroxy-2-nonenal (4-HNE) was performed at Biopathology Institute Co. Ltd. (Oita, Japan). The specimens were subjected to a morphometric analysis of fibrotic areas or fat accumulation using Mac SCOPE version 2.5 (Mitani Corp., Shizuoka, Japan). Immunostaining for SM α-actin and hemoglobin-α was performed using frozen specimens by methods described previously.27 After being treated with 5% bovine serum albumin/PBS, the specimens were incubated overnight with primary antibodies in 5% bovine serum albumin/PBS. They were then incubated with both 20 μg/ml Alexa Fluor 488 goat anti-mouse IgG2a antibodies and 20 μg/ml Alexa Fluor 594 goat anti-mouse IgG1 antibodies for 2 hours. Specimens were counterstained for 4,6-diaminodino-2-phenylindole (DAPI) in the nucleus. The sections were observed under an LSM510 confocal laser-scanning microscope (Carl Zeiss, Jena, Germany).
Electron Microscopy
Electron microscopy was performed on sections of rabbit liver according to methods described elsewhere.27 The liver was perfusion-fixed with 1.5% glutaraldehyde in 0.0062 mol/L cacodylate buffer, pH 7.4, plus 1% sucrose. The fixed livers were cut into small pieces. They were postfixed in 1% OsO4 in 0.1 mol/L phosphate buffer, pH 7.4, dehydrated, and embedded in Polybed. Semithin sections were stained with toluidine blue. Thin sections were stained with saturated uranyl acetate and lead citrate and observed under a light microscope and a JEM-1200EX electron microscope (JEOL, Tokyo, Japan) at 100 kV.
Preparation of Nuclear Extracts
For the separation of cytoplasmic and nuclear extracts, NE-PER nuclear and cytoplasmic extraction reagents (Pierce Biotechnology Inc., Rockford, IL) were used according to the manufacturer’s directions.
Immunoblotting
Protein samples (10 μg) were subjected to sodium dodecyl sulfate-polyacrylamide gel electrophoresis and then transferred onto Immobilon P membranes. After blocking, the membranes were treated with primary antibodies and then with peroxidase-conjugated secondary antibodies. Immunoreactive bands were visualized using the enhanced chemiluminescence system and documented with a LAS 1000 (Fuji Photo Film, Kanagawa, Japan). The density of bands was analyzed using a Bio-Rad GS-700 densitometer (Bio-Rad, Hercules, CA).
Quantitative Real-Time Polymerase Chain Reaction
Total RNA was extracted from liver tissues using Isogen (Nippon Gene Co. Ltd., Tokyo, Japan).28 The expression of mRNA was measured using TaqMan One-Step RT-PCR Master Mix Reagents (Applied Biosystems, Foster City, CA), One-Step SYBR RT-PCR Kit (Perfect Real Time; Takara Bio Inc., Ohtsu, Japan), and Applied Biosystems Prism 7700 (Applied Biosystems) according to a previously reported procedure.29 Primers and oligonucleotide probes were designed by using Primer Express (Applied Biosystems) and are listed in Table 1. The primers for interleukin (IL)-8 were generated according to a previous report.30 The primers and dual-labeled probe of MFG-E8 were designed according to the cloned rabbit MFG-E8 cDNA sequence (Supplementary Figure 1 at http://ajp.amjpathol.org). Individual gene expression was normalized to glyceraldehyde-3-phosphate dehydrogenase (GAPDH). As a standard reaction, cDNA corresponding to 1.6, 8, 40, and 200 ng of total RNA was examined and used as a reference value. The conditions for the TaqMan One-Step RT-PCR Master Mix reagents were as follows: 30 minutes at 48°C (stage 1, reverse transcription), 10 minutes at 95°C (stage 2, reverse transcription inactivation and Ampli Taq Gold activation), and then 40 cycles of amplification for 15 seconds at 95°C and 1 minute at 60°C (stage 3, PCR). The conditions for the One-Step SYBR RT-PCR kit (Perfect Real Time) were as follows: an initial step of 15 minutes at 42°C, 2 minutes at 95°C, and then 40 amplification cycles of denaturation at 94°C for 15 seconds, and annealing and extension at 60°C for 1 minute.
Table 1.
Primer Pairs and Probes Used for RT-PCR
| Primer name | Sequence | Reference | Note |
|---|---|---|---|
| Collagen α1(I) | AY633663 | TaqMan | |
| Forward | 5′-ACTGGATTGACCCCAACCAA-3′ | ||
| Reverse | 5′-TTGCCCCAGTGTCCATGTC-3′ | ||
| Probe | 5′-CTGCAACCTGGATGCCATCAAGGTC-3′ | ||
| GAPDH | AB231852 | TaqMan | |
| Forward | 5′-GCCAAAAGGGTCATCATCTCA-3′ | ||
| Reverse | 5′-GTGGTTCACGCCCATCACA-3′ | ||
| Probe | 5′-CCTCCGCCGATGCCCCCA-3′ | ||
| Heme oxygenase-1 | AY421756 | TaqMan | |
| Forward | 5′-GGAGAACGCCGAGTTCATGA-3′ | ||
| Reverse | 5′-GGCCATCACCAGCTTAAAACC-3′ | ||
| Probe | 5′-AACTTTCAGAAGGGCCAGGTGACTGCC-3′ | ||
| IL-1β | M26295 | TaqMan | |
| Forward | 5′-TCCAGACGAGGGCATCCA-3′ | ||
| Reverse | 5′-CTGCCGGAAGCTCTTGTTG-3′ | ||
| Probe | 5′-CTGCGCATCTCCTGCCAACCCT-3′ | ||
| IL-8 | Ref. 30 | SYBR Green | |
| Forward | 5′-AACCTTCCTGCTGTCTCTGA-3′ | ||
| Reverse | 5′-TCTGCACCCACTTTTTCCTTG-3′ | ||
| MCP-1 | M57440 | TaqMan | |
| Forward | 5′-CTCTCACCCTCCAGCATGAAG-3′ | ||
| Reverse | 5′-AGCTGAAGGCGACTGCTATGA-3′ | ||
| Probe | 5′-TCTCTGCAACGCTTCTGTGCCTGC-3′ | ||
| MMP9 | D26514 | TaqMan | |
| Forward | 5′-GCTCCGGTGGATCAGATGTT-3′ | ||
| Reverse | 5′-AAGCGGTCCTGGCAGAAGT-3′ | ||
| Probe | 5′-CACACGACGTCTTCCAGTACCGAGAG-3′ | ||
| TGF-β1 | AF000133 | TaqMan | |
| Forward | 5′-AAGGGCTACCACGCCAACTT-3′ | ||
| Reverse | 5′-CGGGTTGTGCTGGTTGTACA-3′ | ||
| Probe | 5′-TGCCTGGGACCCTGCCCCTAC-3′ | ||
| TIMP2 | AF069713 | TaqMan | |
| Forward | 5′-TCACGCTCTGTGACTTCATCGT-3′ | ||
| Reverse | 5′-TGTGGTTCAGGCTCTTCTTCTG-3′ | ||
| Probe | 5′-CCCTGGGACTCCCTGAGCAGCA-3′ | ||
| TNF-α | M12845 | SYBR Green | |
| Forward | 5′-TGAAGCTCACGGACAACCA-3′ | ||
| Reverse | 5′-TGTGAGTGAGGAGCACGTAGGA-3′ | ||
| NF-κB | AY753407 | TaqMan | |
| Forward | 5′-CACAGCGCTTCTCAGGAGTTC-3′ | ||
| Reverse | 5′-CCGCCGGGCCACAT-3′ | ||
| Probe | 5′-AGCTATGATGGAAGGTTCGTGGC-3′ | ||
| MFG-E8 | TaqMan | ||
| Forward | 5′-TGGGCGCAAGTTCCAGTT-3′ | ||
| Reverse | 5′-GTTACCGGCAAACACCTTGTC-3′ | ||
| Probe | 5′-ATCCAGGAAGCGGACGGGTCTGG-3′ |
MMP, matrix metalloproteinase.
Subcloning of MFG-E8 cDNA
Rabbit MFG-E8 cDNA was cloned by homologous PCR using a primer pair, 5′-TGGATCCAGGTGAACCT-3′ (forward) and 5′-TAACAGCCCAGCAGCTC-3′ (reverse), designed from two common nucleotide sequences of human and mouse MFG-E8, which have already been cloned and registered in the NCBI database (accession no. NM005928 and NM008594, respectively). The 880-bp PCR product was purified and ligated into pGEM-T Easy (Promega, Madison, WI). Automatic DNA sequencing was performed to confirm the proper sequence of the inserted DNA using ABI Prism 310 (Supplementary Figure 1 at http://ajp.amjpathol.org).
Osmotic Fragility Test for Erythrocytes
Osmotic fragility was assessed in freshly isolated erythrocytes collected from the auricular vein. Blood was washed three times with PBS to remove serum. Packed erythrocytes (0.1 ml) were incubated in 1 ml of 7 g/L NaCl for 15 minutes and then centrifuged at 1000 × g for 5 minutes. Absorption of the supernatant was read at 540 nm. Data are presented as adjusted percentages of the maximum optical density obtained. The value for hemolysis was calculated, assuming a linear response between the minimum and maximum optical density readings.
Flow Cytometric Binding Assay of Fluorescent Phospholipid Vesicles
The externalization of phosphatidylserine (PS) on the outer leaflet of the erythrocyte membrane was detected by flow cytometry using an Annexin V-Biotin apoptosis detection kit (Medical & Biological Laboratories Co. Ltd.). Erythrocytes were separated from the serum, and then incubated with serum from the same rabbit for 24 hours. They were washed, mixed with Annexin V-Biotin reagent in a binding buffer containing Ca2+, and incubated with streptavidin-phycoerythrin (PE) as described previously.31 Flow cytometry was performed with FACS Calibur (BD Biosciences, San Jose, CA) as reported.32,33 Samples were analyzed on a flow cytometer with forward and side scatter gates set to include cells but exclude cellular debris and phospholipid vesicles. Fluoresceins were excited at 488 nm and detected at 575 ± 13 nm for PE. The amount of fluorescent vesicles bound per cell was then calculated from the mean fluorescence intensity of the gated cell population. Specific binding was calculated by subtracting nonspecific binding from total binding.
Assay of Phagocytosis
In Vitro Study
Blood from C57BL/6 mice (12 weeks old, male) was collected and washed three times with PBS. Erythrocytes were incubated with saline containing Na251CrO4 (0.1 mCi/ml packed cells) for 30 minutes at 37°C.34 The 51Cr-labeled erythrocytes were washed, resuspended (hematocrit, 5%), and incubated with 3 mmol/L tert-butyl hydroperoxide (t-BHP; Sigma-Aldrich Co., St. Louis, MO) in PBS at 37°C.35 The cells were washed and used for in vitro phagocytosis assay conducted with a mouse macrophage cell line, RAW 264.7, expressing integrin αvβ3.36 The t-BHP-treated erythrocytes (1 × 10⁶) were added to RAW 264.7 cells (1 × 10⁵) on glass microscope slides (Nalge Nunc International, Naperville, IL) in the presence or absence of anti-MFG-E8 antibodies. Phagocytosis was allowed to proceed for 3 hours in Dulbecco’s modified Eagle’s medium supplemented with 10% fetal bovine serum at 37°C in 5% CO2/95% air. Cultured cells on the slides were fixed with 3.7% formaldehyde for 30 minutes at room temperature. After five washes with PBS containing 0.1% Triton X-100, the cells were collected and the radioactivity was measured by a gamma-counter. In addition, the fixed cells were incubated with anti-hemoglobin-α antibodies for 1 hour at room temperature and then with fluorescein isothiocyanate-labeled goat anti-rabbit IgG for 1 hour at room temperature. The specimens were counterstained for DAPI. The sections were observed under an LSM510 confocal laser-scanning microscope (Carl Zeiss). The percentage of RAW 264.7 cells carrying fluorescein isothiocyanate-labeled erythrocytes was determined.
Ex Vivo Study
Rabbit liver was perfused with 200 ml of GBSS/B (8000 mg/L NaCl, 370 mg/L KCl, 210 mg/L MgCl2·6H2O, 70 mg/L MgSO4·7H2O, 30 mg/L KH2PO4, 150 mg/L Na2HPO4·12H2O, 1090 mg/L glucose·H2O, 227 mg/L NaHCO3, 225 mg/L CaCl2·2H2O, pH 7.3)37 via the portal vein to remove blood. Then, erythrocytes (1 × 10⁹ cells) treated with t-BHP for 1 hour and labeled with Na251CrO4 as described above were suspended in 300 ml of GBSS/B and were injected directly via the portal vein. The liver was then perfused with 200 ml of GBSS/B. Liver tissues (3 g wet weight) were removed, and the associated radioactivity was measured by a gamma counter. Furthermore, erythrocytes entrapped in hepatic sinusoids were detected by double-immunohistochemical staining of hemoglobin-α and RAM-11 on fixed liver sections.
Immunohistochemical Analysis of Human Liver Samples
A total of 22 patients with NASH (eight males and 14 females; median age, 65 years; range, 33 to 84 years) were enrolled in the study. In addition, three specimens obtained by resection during surgery from patients with normal liver function were used as controls (three males; median age, 67 years; range, 62 to 73 years). Informed written consent was obtained from all patients at the time of their liver biopsy, and the study was conducted in conformance with the Helsinki Declaration. Patients consuming alcohol, those with evidence of liver cirrhosis or hepatocellular carcinoma, and those ingesting drugs known to produce hepatic steatosis (corticosteroids, estrogens, methotrexate, tetracycline, calcium channel blockers, or amiodarone) in the previous 12 months were excluded from this study. The diagnosis of NASH was established on the basis of the clinical and histopathological features.1,2,3,4,9,10,11 Immunohistochemistry was performed according to the methods described above. The sections were reacted with mouse primary antibodies (1:20) for glycophorin-A and CD68 (DAKO) according to the manufacturer’s directions. They were then incubated with both goat anti-mouse IgG3 antibodies-fluorescein isothiocyanate (Santa Cruz Biotechnology Inc., Santa Cruz, CA) and goat anti-mouse IgG1 antibodies-TRITC (Southern Biotechnology Associates Inc., Birmingham, AL) for 2 hours. Specimens were counterstained for DAPI in the nucleus. The sections were observed under an LSM510 confocal laser-scanning microscope (Carl Zeiss).
Statistical Analysis
Data presented as bar graphs are the means ± SD of at least three independent experiments. The statistical analysis was performed with Student’s t-test (P < 0.05 was considered significant).
Results
Induction of Steatohepatitis in Rabbits
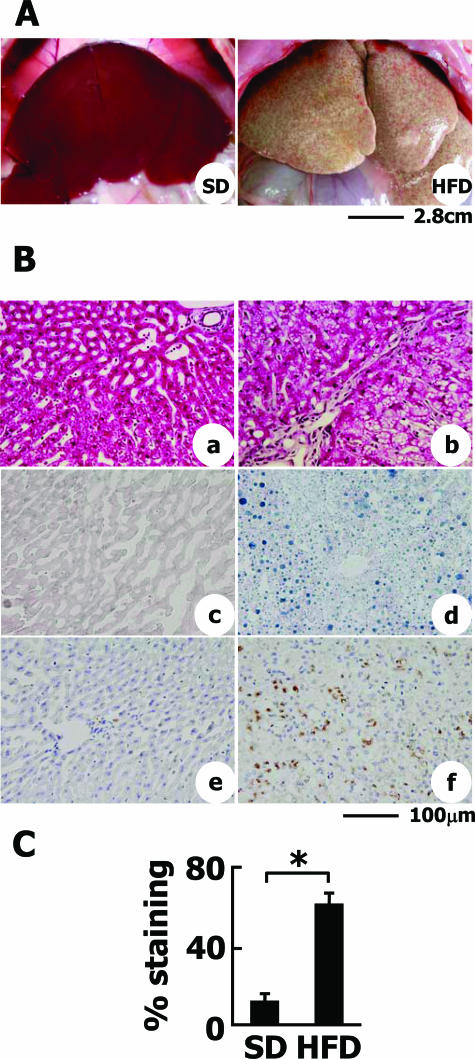
Rabbits were examined using computed tomography 8 weeks after they were initially fed the SD and HFD. The density of the liver and the kidney was measured at random. The liver/kidney ratio indicated the extent of fatty deposition in the liver of HFD-fed rabbits (data not shown). Furthermore, as depicted in Figure 1A, the livers of HFD-fed rabbits were apparently enlarged and whitish with slight irregularity of the surface compared with those of SD-fed rabbits. Although the mean body weight was not significantly different between HFD- and SD-fed rabbits (data not shown), the liver weight relative to body weight was greater in HFD-fed rabbits than in SD-fed rabbits (g liver weight/kg body weight: 29.4 ± 2.07 g/kg versus 18.4 ± 1.14 g/kg, P < 0.05).
Figure 1.
Liver steatosis and inflammatory reactions in HFD-fed rabbits. A: Macroscopic view of the livers of SD- or HFD-fed rabbits. Hepatomegaly, whitish coloring, and surface irregularity were observed in HFD-fed rabbits (right). B: Histological analyses of liver sections. a, c, e: SD-fed group. b, d, f: HFD-fed group. a and b: H&E staining. c and d: Sudan Black staining. Note that fat accumulation was evident in the liver of HFD-fed rabbits. e and f: RAM-11 immunohistochemistry. In the liver of SD-fed rabbits, RAM-11-positive cells were faintly observed in sinusoidal Kupffer cells. Note that RAM-11 expression and the number of cells positive for RAM-11 was greatly augmented in the liver of HFD-fed rabbits. C: The degree of fat deposition in the liver was quantified by measuring the Sudan Black-stained area by Mac SCOPE version 2.5. Data are from eight individual rabbits in each group and represented as the mean ± SD. *P < 0.01. Scale bars: 2.8 cm (A); 100 μm (B).
Histologically, the livers of HFD-fed rabbits exhibited prominent fatty change as indicated by H&E staining (Figure 1B, a and b) and Sudan Black staining (Figure 1B, c and d). An analysis of Sudan Black-stained liver sections demonstrated a significant increase in the amount of fat accumulated in the HFD-fed animals compared with SD-fed controls (Figure 1C). Many mononuclear cells infiltrated into the lobules of the HFD-fed rabbits. These cells were identified as activated macrophages by anti-RAM-11 staining (Figure 1B, e and f).38 Macrophages were evenly distributed among the liver parenchyma.
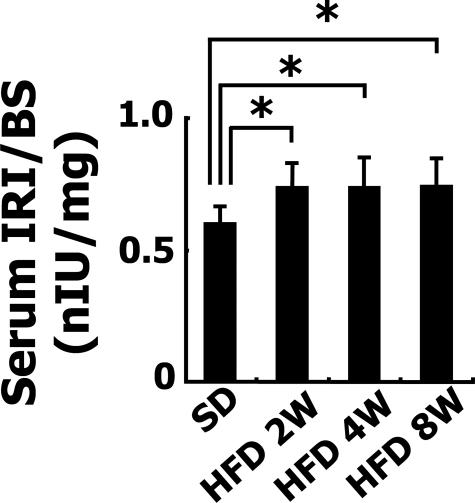
Blood was collected 8 weeks after the animals were first fed the HFD. AST and ALT did not differ between the SD (n = 5)- and HFD (n = 5)-fed groups (AST, 19.6 ± 5.7 U/ml versus 19 ± 4.6 U/ml; ALT, 33.3 ± 8.1 U/ml versus 34 ± 7.8 U/ml). The levels of total cholesterol and triglyceride were significantly higher in the HFD-fed group than SD-fed group (total cholesterol, 21.7 ± 4.9 mg/dl versus 2660 ± 447 mg/dl, P < 0.05; triglyceride, 25.7 ± 8.2 mg/dl versus 57 ± 5.6 mg/dl, P < 0.05). BS levels after 24 hours fasting did not differ between the SD-fed group and the 8-week HFD-fed group (BS, 108.8 ± 33.1 mg/dl versus 116.4 ± 23.3 mg/dl, P = 0.273, n = each 5). In contrast, the ratios of serum levels of IRI to BS in HFD-fed rabbits were significantly higher than those in the SD-fed rabbits at 2, 4, and 8 weeks (Figure 2). These results indicate the insulin resistance of HFD-fed rabbits.
Figure 2.
Insulin resistance in HFD-fed rabbits. Serum IRI and BS concentrations in 2-, 4-, and 8-week HFD-fed rabbits and SD-fed rabbits after fasting were determined by enzyme-linked immunosorbent assay. Ratios of IRI to BS were shown. Data are from five individual rabbits in each group and represented as the mean ± SD. *P < 0.05.
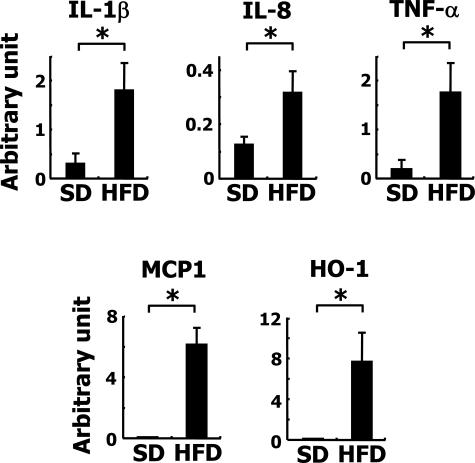
As stated above, the infiltration by macrophage of the liver parenchyma of the HFD-fed animals was notable. In fact, the levels of mRNA for IL-1β, IL-8, monocyte chemoattractant protein-1, and tumor necrosis factor (TNF)-α were all significantly increased as revealed by quantitative RT-PCR (Figure 3).
Figure 3.
Inflammatory gene expression in HFD-fed rabbits. Expression of IL-1β, IL-8, TNF-α, monocyte chemoattractant protein-1 (MCP1), and heme oxygenase-1 (HO-1) mRNAs in rabbit livers. Note that the expression of all of these mRNAs was augmented in the HFD-fed group. *P < 0.01.
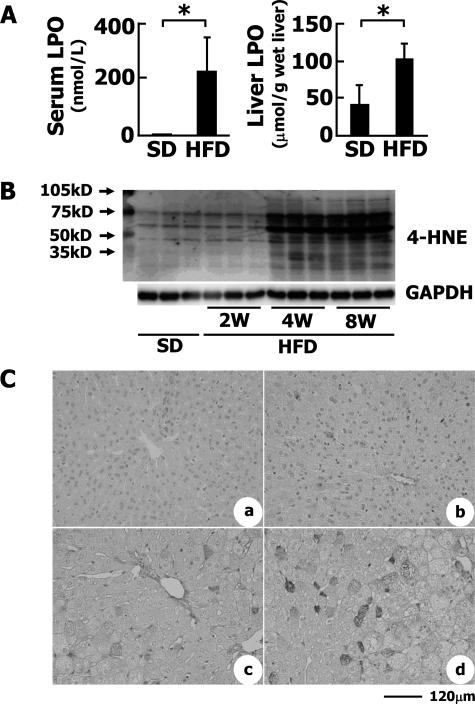
LPO levels, an indicator of the oxidative stress in serum, were greatly elevated in the HFD-fed group compared with the control group (Figure 4A). HFD also induced the accumulation of LPO in the liver (113 ± 14 versus 42 ± 13.4 μmol/g wet liver, P < 0.05; Figure 4A). The expression of heme oxygenase-1 mRNA, which is a good indicator of oxidative stress, also increased in the livers of the HFD-fed rabbits (Figure 3). On the other hand, 4-HNE is considered to be one of the most reliable markers of lipid peroxidation.39 Western blot analysis revealed that proteins modified by 4-HNE were accumulated in a time-dependent manner in livers of HFD-fed animals compared with those of SD-fed animals (Figure 4B). Immunohistochemistry showed that 4-HNE diffusely appeared in hepatocytes of HFD-fed rabbits, but not in the control liver (Figure 4C).
Figure 4.
Oxidative stress in HFD-fed rabbits. A: Serum and liver LPO levels. To estimate the levels of LPOs in serum and liver, LPO was measured as described in Materials and Methods. The number of animals was five each. *P < 0.01. B: Expression of 4-HNE adducts in rabbit liver tissues. Proteins modified by 4-HNE adducts were identified by Western blotting. C: Immunohistochemical detection of 4-HNE adducts in the liver. a: SD; b: 2-week HFD; c: 4-week HFD; d: 8-week HFD. Scale bar = 120 μm.
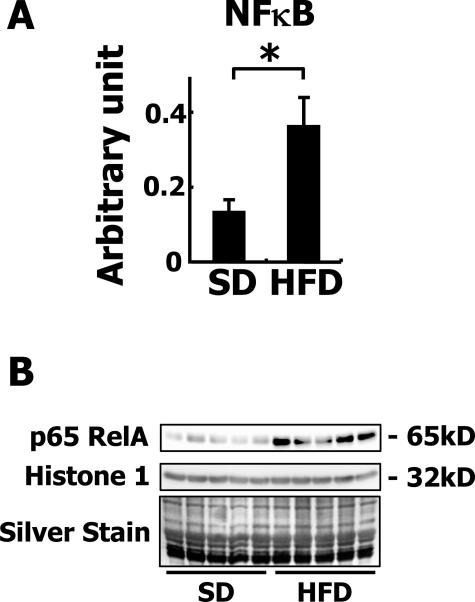
Inflammation and oxidative stress are closely related to nuclear factor-κB (NF-κB) signaling and thus it can be assumed that NF-κB is activated in the livers of HFD-fed rabbits. In fact, the expression of NF-κB mRNA was dramatically increased in the liver of HFD-fed rabbits as revealed by quantitative RT-PCR (Figure 5A). In addition, increased translocation of p65 RelA into the nuclear fraction was confirmed by Western blotting (Figure 5B), indicating the actual activation of NF-κB signaling in the liver. TUNEL-positive apoptotic cells were rarely seen in the livers of control rabbits, whereas 40 to 50 TUNEL-positive cells were seen in each field in the livers of HFD-fed rabbits (data not shown). The apoptotic cells were identified as hepatocytes by TUNEL and H&E staining. The distribution of apoptotic cells did not coincide with the inflammatory areas.
Figure 5.
Activation of NF-κB in HFD-fed rabbits. A: Expression of NF-κB mRNA. Note that the mRNA expression of NF-κB was augmented in the HFD-fed group. *P < 0.01. B: Localization of p65 RelA in nuclear extracts of rabbit liver tissues. The nuclear proteins on the electrophoresed gel were detected by silver staining.
Induction of Liver Fibrosis in Rabbits
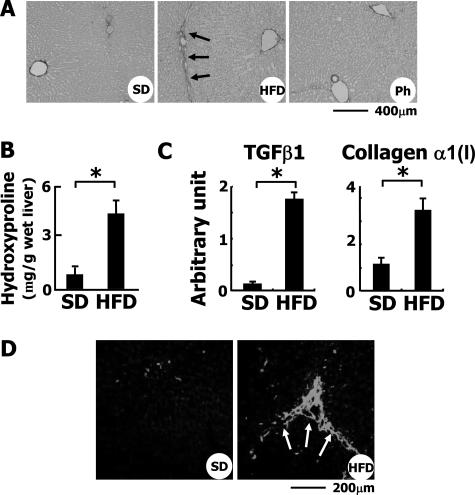
Perpetuation of inflammation and the apoptosis of hepatocytes lead to fibrosis of the liver. In fact, the administration of HFD for 8 weeks induced liver fibrosis with P-P bridges as indicated by Azan Mallory staining (data not shown) and Sirius Red staining (Figure 6A, arrows). HFD considerably enhanced hepatic fibrosis as confirmed by the morphometric analysis of Azan Mallory-stained liver sections (data not shown) and by the estimation of hydroxyproline content in the liver (Figure 6B). The expression of transforming growth factor (TGF)-β1 and collagen α1(I) mRNAs was induced as revealed by quantitative RT-PCR (Figure 6C). The hepatic expression of the mRNA for matrix metalloproteinase-9 and tissue inhibitor of metalloproteinase 2 (TIMP-2) was also increased in HFD-fed rabbits compared with the controls (data not shown). Immunohistochemistry revealed that the expression of SM α-actin, an indicator of hepatic myofibroblasts, was significantly increased along the fibrotic septum of the liver of HFD-fed animals (Figure 6D, arrows), indicating that in this model the hepatic fibrotic process may be highly dependent on myofibroblasts.
Figure 6.
Induction of liver fibrosis in HFD-fed rabbits. A: Sirius Red staining of liver sections. Note that collagen fibers extended from the portal vein area in HFD-fed rabbits. Ph, HFD-fed rabbits treated with phlebotomy. B: Hydroxyproline content of the liver. To estimate the total amount of collagen in the liver, the level of hydroxyproline was measured as described in Materials and Methods. *P < 0.01. C: Hepatic expression of TGF-β1 and collagen α1(I) mRNAs was determined by quantitative RT-PCR. D: Detection of SM α-actin by immunohistochemistry. In the liver of SD-fed rabbits, SM α-actin was faintly detected along the sinusoids and around portal areas. In the HFD-fed group, its expression was greatly augmented along the fibrotic septum extending from the portal area. Scale bars: 400 μm (A); 200 μm (D).
Iron Deposition in the Liver
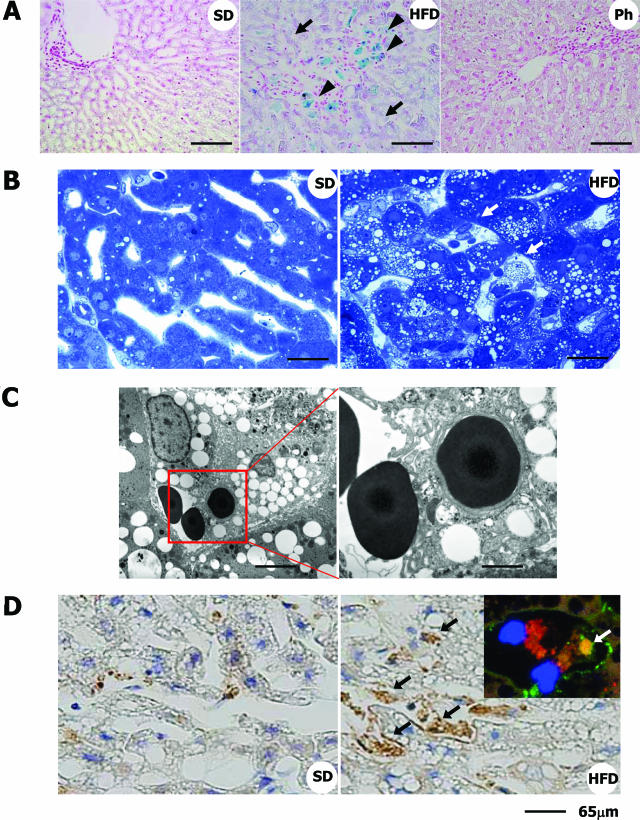
The deposition of iron in the liver accompanied by an increase in the serum ferritin level is one of the clinical features of NASH,40 indicating a pathological role of iron in this disease. Here, we investigated the amount of iron deposited in the livers of HFD-fed rabbits. Prominent deposits of iron were observed by Berlin Blue-staining in the HFD-fed group compared with the SD-fed group (Figure 7A, arrowheads). We identified the cells containing iron as hepatic macrophages by using mirror image staining. The specimen was sectioned transversally across the marked area. As shown in Supplementary Figure 2 at http://ajp.amjpathol.org, Berlin Blue-positive cells corresponded well to macrophages positive for anti-RAM-11 antibodies. Iron was also found to be deposited in hepatocytes (Figure 7A, arrows).
Figure 7.
Iron deposition and increased erythrophagocytosis in the liver of HFD-fed rabbits. A: Berlin Blue staining. Note that iron is accumulated predominantly in macrophages (blue coloration, arrowheads) and in hepatocytes (purple coloration, arrows). Ph, HFD-fed rabbits treated with phlebotomy. (B) Toluidine blue staining of the liver. Note that macrophages in the sinusoids show foamy degeneration and are attached by erythrocytes (arrows). C: Electron microscopy. An erythrocyte is attached to a foamy macrophage, and another is in the phagosome of the macrophage. D: Detection of hemoglobin-α by immunohistochemistry. In normal liver, a faint scattering of hemoglobin-α was seen. In the liver of HFD-fed rabbits, its expression was greatly augmented in the Kupffer cells (black arrows). Inset shows the localization of hemoglobin-α (green, white arrow) in RAM-11-positive macrophages (red) in HFD-fed rabbit liver sections determined using fluorescence microscopy. Blue color indicates nucleus (DAPI staining). Scale bars: 100 μm (A); 40 μm (B); 10 μm (C, left); 3.5 μm (C, right); 65 μm (D).
To elucidate the mechanisms of increased iron accumulation in the liver, we carefully observed the toluidine blue-stained sections. Many erythrocytes in the sinusoids were attached to foamy macrophages that contained lipid droplets (Figure 7B, arrows) and some of them were phagocytosed by the macrophages in the livers of the HFD-fed rabbits (Figure 7C), a sight rarely seen in the SD-fed animals. In addition, erythrocytes that were identified by the immunostaining of hemoglobin-α were frequently trapped in the sinusoids of the HFD-fed group (Figure 7D, arrows). When the number of erythrocytes trapped in sinusoids was counted under the microscope at ×400 magnification, it was found to be significantly greater in the HFD-fed group (5.2 ± 0.83 cells/0.12 mm2) than in the SD-fed group. Thus, we speculated that hemoglobin from erythrocytes is a source of the iron that accumulated in the liver.
Mechanism of Phagocytosis of Erythrocytes by Macrophages
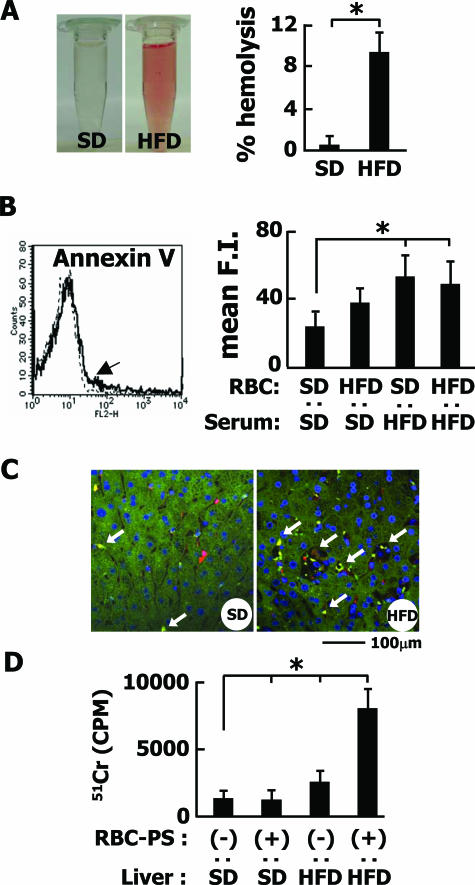
First, we found that erythrocytes from HFD-fed rabbits showed a significant increase of fragility in the hemolytic assay compared with those from the control rabbits (Figure 8A), indicating a modification of the erythrocyte membrane by HFD. To assess the change to the membrane, blood was first separated into serum and erythrocytes, and then the cells were incubated with individual serum samples from each group for 24 hours and monitored for PS externalization using the PS-staining dye Annexin V-PE. As shown in Figure 8B, the erythrocytes treated with serum from HFD-fed rabbits more frequently expressed PS on the surface than the control cells.
Figure 8.
PS-dependent phagocytosis of erythrocytes. A: Osmotic fragility of erythrocytes isolated from SD- or HFD-fed rabbits. A macroscopic view reveals the fragility of erythrocytes from HFD-fed rabbits. Bar graphs represent percent hemolysis with the maximal optical density obtained at 100% hemolysis. B: Externalization of PS in erythrocytes. Erythrocytes from SD- or HFD-fed rabbits were incubated with serum and stained with PE-conjugated annexin V. An arrow shows the fluorescence-activated cell sorting analysis of erythrocytes of HFD-fed rabbits treated with serum of HFD-fed rabbits. The experiment was performed using five independent samples, and the average values are plotted as bar graphs. Mean F.I., mean fluorescence intensity. C: Trapping of erythrocytes in hepatic sinusoids. After 51Cr-labeled erythrocytes were treated with t-BHP, they were injected into the portal vein. Note that the entrapment of erythrocytes was observed by fluorescence microscopy in the liver sections stained for both RAM-11 (red) and hemoglobin-α (green). D: The entrapment of erythrocytes was assayed by measuring the 51Cr-derived radioactivity from 3 g of wet liver. Note that PS-positive erythrocytes were significantly retained in the liver of HFD-fed rabbits.*P < 0.01. Each, n = 5. Scale bar = 100 μm.
PS-positive erythrocytes were generated artificially using 3 mmol/L t-BHP, a well-known oxidant.35 They were injected into the portal vein of HFD- or SD-fed rabbits. As shown in Figure 8, C and D, more PS-positive erythrocytes were trapped in the liver of HFD-fed rabbits than SD-fed rabbits. The results indicated that the externalization of PS is not the sole mechanism for the engulfment of erythrocytes by macrophages.
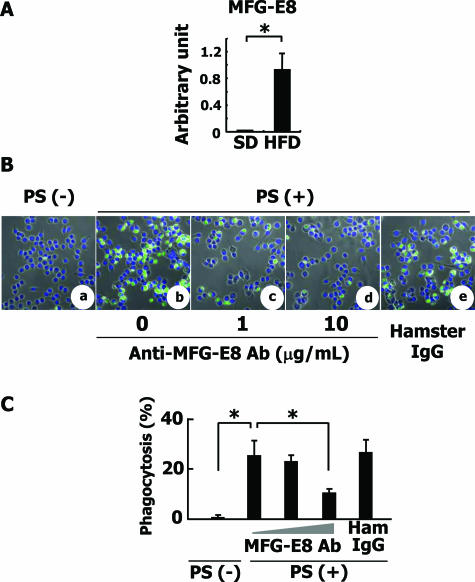
Next, we focused on MFG-E8, which is secreted from activated macrophages, binds to apoptotic cells, and brings them to phagocytes for engulfment.41 The expression of MFG-E8 mRNA was apparently induced in the liver tissue of HFD-fed rabbits as revealed by quantitative RT-PCR analysis (Figure 9A).
Figure 9.
Analysis of MFG-E8 gene expression and MFG-E8-dependent phagocytosis of erythrocytes. A: MFG-E8 mRNA expression in rabbit livers. Expression level of MFG-E8 mRNA was measured by quantitative RT-PCR. *P < 0.01. B: Engulfment of erythrocytes by RAW 264.7 cells. a–e: Erythrocytes from C57BL/6 mice were treated with 3 mmol/L t-BHP for 30 minutes. RAW 264.7 cells that are demonstrated to express αvβ3 integrin and to secrete MFG-E8 were co-cultured with the treated erythrocytes in the absence or presence of anti-MFG-E8 antibody or 10 μg/ml normal hamster IgG and were observed by LSM510 confocal laser-scanning microscope. a: PS-negative erythrocytes, anti-MFG-E8 antibody (−). b: PS-positive erythrocytes, anti-MFG-E8 antibody (−). c: PS-positive erythrocytes, 1 μg/ml anti-MFG-E8 antibody. d: PS-positive erythrocytes, 10 μg/ml anti-MFG-E8 antibody. e: PS-positive erythrocytes, 10 μg/ml normal hamster IgG antibody. C: The percentage of the cells that engulfed more than four erythrocytes was determined by phase-contrast microscopy. The ratio of engulfed erythrocytes was calculated. The experiments were repeated at least five times, and the mean ± SD is shown. *P < 0.01. Original magnifications, ×400.
In culture, PS-negative erythrocytes were rarely attached to RAW 264.7 cells (Figure 9B, a). As shown in Figure 9Bb, PS-positive erythrocytes were engulfed by RAW 264.7 cells, in a manner clearly inhibited by adding anti-MFG-E8 antibodies to the culture medium [Figure 9, B (c and d) and C]. Microscopic observations also indicated that the number of engulfed oxidized erythrocytes per macrophage decreased from 25.3 to 10.2 in the presence of 10 μg/ml anti-MFG-E8 antibody (Figure 9C). These results indicated that the externalization of PS in damaged erythrocytes and secretion of MFG-E8 from macrophages may take part in the engulfment of damaged erythrocytes by liver macrophages, leading to the accumulation of hemoglobin and iron in macrophages.
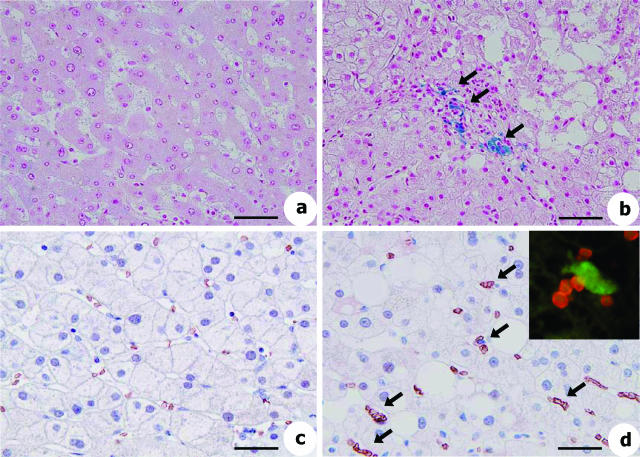
These observations were confirmed in liver tissue from patients clinically diagnosed with NASH. As shown by Berlin Blue staining, deposits of iron were observed around portal areas in the NASH patients (Figure 10b), but not in the controls (Figure 10a). In addition, immunohistochemistry revealed that the expression of glycophorin-A, which is the primary structural protein of the erythrocyte membrane, was increased in the NASH specimens (Figure 10d) but not in the controls (Figure 10c). Double immunostaining27 of glycophorin-A and CD68 confirmed the association of erythrocytes with liver macrophages (Figure 10d).
Figure 10.
Iron deposition and erythrophagocytosis in liver of NASH patients. Histological analyses of liver sections from normal patients (a and c) and NASH patients (b and d). a and b: Berlin Blue staining. c and d: Glycophorin-A staining by immunohistochemistry. c: Glycophorin-A-positive erythrocytes are evenly distributed in sinusoids of intact human liver, indicating physiological sinusoidal circulation. d: Glycophorin-A-positive erythrocytes are frequently aggregated around Kupffer cells that show erythrophagocytosis (arrows). Inset shows the close association of glycophorin-A (red) with CD68-positive macrophages (green) in human NASH liver sections revealed by fluorescence microscopy. Scale bars: 100 μm (a, b); 65 μm (c, d).
Effect of Phlebotomy on HFD-Induced Liver Fibrosis
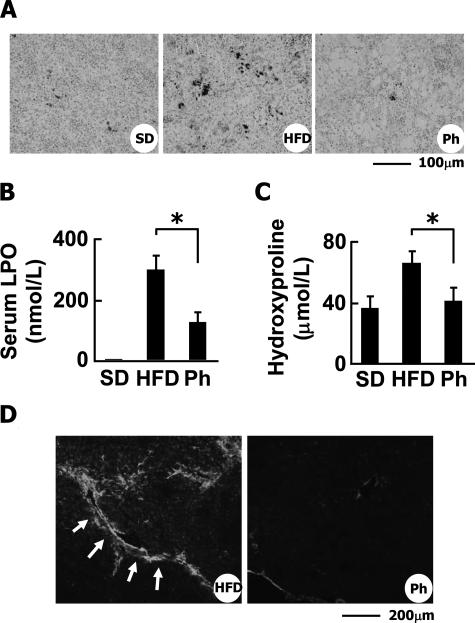
We considered that an increase of erythrophagocytosis leads to the excess storage of iron in liver macrophages, triggering hepatic inflammation, apoptosis of hepatocytes, and liver fibrosis. Therefore, removal of the damaged erythrocytes and deposited iron would be an effective therapy for NASH. To test this hypothesis, we performed phlebotomy in the HFD-fed rabbits. The amount of iron deposited in the liver (Figure 7A) as well as the spleen (Figure 11A) was greatly decreased by the phlebotomy. The serum levels of LPO were significantly reduced (297.7 ± 48.3 nmol/ml in HFD-fed group versus 124.5 ± 27.0 nmol/ml in phlebotomy group, P < 0.05) (Figure 11B). The serum levels of hydroxyproline were also reduced (82.3 ± 9.1 μmol/L in HFD-fed group versus 51.0 ± 9.5 μmol/L in phlebotomy group, P < 0.05) (Figure 11C). Furthermore, few TUNEL-positive cells were detected in the livers of the phlebotomy group (data not shown). Phlebotomy significantly reduced the amount of deposited collagen (Figure 6A) and the level of SM α-actin (Figure 11D).
Figure 11.
Effect of phlebotomy on HFD-induced liver fibrosis in rabbits. A: Berlin Blue staining of the spleen. Ph, HFD-fed rabbits treated with phlebotomy. Note that phlebotomy dramatically reduced iron deposition in the spleen of HFD-fed rabbits. B: Effect of phlebotomy on LPO levels in serum. C: Effect of phlebotomy on hydroxyproline levels in serum. *P < 0.01. D: Detection of SM α-actin by immunohistochemistry. Note that phlebotomy reduced SM α-actin expression in the liver of HFD-fed rabbits. Scale bars: 100 μm (A); 200 μm (D).
Discussion
One major finding of this study is that, although originally used as a model for atherosclerosis,22 HFD-fed rabbits exhibit pathological changes very similar to those of human NASH. We additionally confirmed that fasting IRI was significantly increased in the HFD-fed rabbits (Figure 2), indicating that insulin resistance plays a role in the progression of steatohepatitis in this model. Hyperinsulinemia and insulin resistance based on the increased expression of TNF-α generally stimulate sterol regulatory element-binding protein-1c, a transcription factor that activates fatty acid synthesis. Because the expression of TNF-α mRNA in the liver was increased in this model (Figure 3), sterol regulatory element-binding protein-1c signal transduction would be activated, resulting in the prominent accumulation of fat.42 In addition, although it has yet to be studied, the contribution of leptin, adiponectin, and adipsin, which are adipocytokines associated with lipid metabolism, to the pathogenesis of steatohepatitis in this model, should also be taken into account.
The excessive intrahepatic accumulation of lipids is hypothesized to trigger local inflammatory reactions.14 It has been reported that free fatty acids promote lysosomal destabilization, resulting in NF-κB-dependent TNF-α expression that augments inflammatory reactions and insulin resistance.43 In fact, activation of NF-κB was seen in this model (Figure 5B). Inflammation is accompanied by the production of free radicals that are involved in damaging the cellular membrane and the degeneration of DNA and proteins.44,45 In particular, lipid peroxidation leads to the oxidative destruction of the polyunsaturated fatty acids that constitute the cell membrane.39,46 Taken together, these molecular events are estimated to lead to the apoptosis of hepatocytes and the activation of myofibroblasts (Figure 6D), triggering fibrosis of the liver.47,48,49,50
Some clinical studies have suggested that the hepatic accumulation of excess iron is a factor promoting chronic liver diseases such as chronic hepatitis C, hemochromatosis, and NASH.51,52,53,54 However, it has not been clarified how iron is stored in the liver. On the other hand, Bugianesi et al55 reported that the presence of severe fibrosis in NAFLD patients was independently associated with the serum ferritin level and increased ferritin levels are markers of severe histological damage, but not of iron overload. Thus, the role of excessive hepatic iron remains controversial regarding the pathogenesis of NAFLD.
Interestingly, in this study we often observed an excess of iron and the engulfment of erythrocytes by Kupffer cells in the liver in HFD-fed rabbits (Figure 7, B–D). In contrast, the fragility of erythrocytes and the externalization of PS on the outer leaflet of the erythrocyte membrane were not seen in thioacetamide-induced acute hepatitis (Supplementary Figure 3, A and B, at http://ajp.amjpathol.org). Thus, we hypothesized that erythrophagocytosis by Kupffer cells/liver macrophages may be closely related to the storage of iron derived from hemoglobin in cases of NASH. In fact, immunohistochemical analysis of liver specimens from NASH patients revealed that the level of glycophorin-A, which is the primary structural protein of the erythrocyte membrane, was apparently increased in Kupffer cells as it was in the rabbits (Figure 10d). This finding suggests that the pathogenesis of this animal model and human NASH is very similar with regard to the deposition of iron. Facchini et al56 performed a phlebotomy to deplete hepatic iron in 17 patients with NAFLD; the phlebotomy improved the concentration of insulin and ALT in serum. Considering these findings and the current report, erythrocyte-derived iron may be a cue for the progression of NASH.
Macrophages secrete the glycoprotein MFG-E8, which binds apoptotic cells by recognizing aminophospholipids such as PS.41 The EGF domain of MFG-E8 contains an RGD motif that could be recognized by members of the integrin family.57 MFG-E8 thus works as a molecular bridge between apoptotic cells expressing aminophospholipids and phagocytes expressing integrins.41 In fact, we found that the expression of MFG-E8 was increased in the liver and the externalization of PS on erythrocytes was augmented in the HFD-fed group (Figure 8, B and C; Figure 9A). In addition, in culture, the engulfment of PS-positive erythrocytes by RAW 264.7 cells was attenuated by the addition of anti-MFG-E8 antibody (Figure 9, B and C). Thus, macrophage-derived MFG-E8 may be a molecular bridge between “apoptotic” erythrocytes and Kupffer cells that should recognize PS as an “eat me” signal.
How erythrocytes in patients with hypercholesterolemia and hyperlipidemia become easy to be captured by resident organ macrophages is not fully understood.58,59 As detailed here, one possible mechanism by which Kupffer cells engulf erythrocytes is through the externalization of PS. However, at least two other factors can be considered for the augmented deposition of erythrocytes or their cellular fragments in organs. First, in regard to the activation of liver macrophages, oxidatively modified low-density lipoprotein (oxLDL) might play a role. OxLDL is thought to be an atherogenic factor because of its distribution in macrophage-derived foam cells in human atherosclerotic lesions. The cellular uptake of oxLDL is mediated by the binding of oxidized phosphatidylcholine (oxPC), the principal oxidized phospholipids present in oxLDL, to scavenger receptors. In fact, oxPC was observed in the livers of patients with NASH but not in intact human liver.60 Second, regarding erythrocytes, anion channel protein band 3, a major protein in erythrocytes, is broken down in response to oxidative stress, resulting in the modulation of the flux of anions across the erythrocyte membrane. As a result, oxidized erythrocytes undergo a change in morphology, becoming easier to be recognized by phagocytes. In addition, some of the erythrocytes with a damaged membrane might be torn off to form vesicles of cellular components containing hemoglobin. The vesicles could also be pinocytosed by hepatocytes and Kupffer cells.61
In conclusion, a new molecular pathogenesis based on erythrophagocytosis was elucidated in the present study using an animal model of NASH. Phlebotomy attenuated the accumulation of iron in the liver and the development of liver fibrosis and hampered the fibrogenesis, particularly by disturbing the supply of iron. Elucidation of the involvement of erythrocytes in the pathogenesis of NASH will improve our understanding of, and facilitate the establishment of a novel therapy for, human NAFLD/NASH.
Supplementary Material
Acknowledgments
We thank Prof. Hiroko Tsutsui (Department of Immunology and Medical Zoology, Hyogo College of Medicine, Hyogo, Japan) for providing RAW 264.7 cells and Ms. Hiroko Matsui and Ms. Masami Nakazawa for technical support.
Footnotes
Address reprint requests to Norifumi Kawada, M.D., Ph.D., Department of Hepatology, Graduate School of Medicine, Osaka City University, 1-4-3, Asahimachi, Abeno, Osaka 545-8585, Japan. E-mail: kawadanori@med.osaka-cu.ac.jp.
Supported by the Japan Society for the Promotion of Science (grant-in-aid for science research no. 16590618 to N.K.); and the Ministry of Education, Science, Sports, and Culture of Japan (grant no. C16590150 to K.I.).
Supplementary material for this article can be found on http://ajp.amjpathol.org.
References
- Ford ES, Giles WH, Dietz WH. Prevalence of the metabolic syndrome among US adults: findings from the Third National Health and Nutrition Examination Survey. JAMA. 2002;287:356–359. doi: 10.1001/jama.287.3.356. [DOI] [PubMed] [Google Scholar]
- Bacon BR, Farahvash MJ, Janney CG, Neuschwander-Tetri BA. Nonalcoholic steatohepatitis: an expanded clinical entity. Gastroenterology. 1994;107:1103–1109. doi: 10.1016/0016-5085(94)90235-6. [DOI] [PubMed] [Google Scholar]
- Pinto HC, Baptista A, Camilo ME, Valente A, Saragoca A, de Moura MC. Nonalcoholic steatohepatitis. Clinicopathological comparison with alcoholic hepatitis in ambulatory and hospitalized patients. Dig Dis Sci. 1996;41:172–179. doi: 10.1007/BF02208601. [DOI] [PubMed] [Google Scholar]
- Lee RG. Nonalcoholic steatohepatitis: tightening the morphological screws on a hepatic rambler. Hepatology. 1995;21:1742–1743. doi: 10.1002/hep.1840210636. [DOI] [PubMed] [Google Scholar]
- Teli MR, James OF, Burt AD, Bennett MK, Day CP. The natural history of nonalcoholic fatty liver: a follow-up study. Hepatology. 1995;22:1714–1719. [PubMed] [Google Scholar]
- Silverman JF, O’Brien KF, Long S, Leggett N, Khazanie PG, Pories WJ, Norris HT, Caro JF. Liver pathology in morbidly obese patients with and without diabetes. Am J Gastroenterol. 1990;85:1349–1355. [PubMed] [Google Scholar]
- Falchuk KR, Fiske SC, Haggitt RC, Federman M, Trey C. Pericentral hepatic fibrosis and intracellular hyalin in diabetes mellitus. Gastroenterology. 1980;78:535–541. [PubMed] [Google Scholar]
- Itoh S, Yougel T, Kawagoe K. Comparison between non alcoholic steatohepatitis and alcoholic hepatitis. Am J Gastroenterol. 1987;82:650–654. [PubMed] [Google Scholar]
- Ludwig J, Viggiano TR, McGill DB, Oh BJ. Nonalcoholic steatohepatitis: Mayo Clinic experiences with a hitherto unnamed disease. Mayo Clin Proc. 1980;55:434–438. [PubMed] [Google Scholar]
- Haque M, Sanyal AJ. The metabolic abnormalities associated with non-alcoholic fatty liver disease. Best Pract Res Clin Gastroenterol. 2002;16:709–731. doi: 10.1053/bega.2002.0325. [DOI] [PubMed] [Google Scholar]
- Matteoni CA, Younossi ZM, Gramlich T, Boparai N, Liu YC, McCullough AJ. Nonalcoholic fatty liver disease: a spectrum of clinical and pathological severity. Gastroenterology. 1999;116:1413–1419. doi: 10.1016/s0016-5085(99)70506-8. [DOI] [PubMed] [Google Scholar]
- Neuschwander-Tetri BA, Bacon BR. Nonalcoholic steatohepatitis. Med Clin North Am. 1996;80:1147–1166. doi: 10.1016/s0025-7125(05)70483-1. [DOI] [PubMed] [Google Scholar]
- Brunt EM, Janney CG, Di Bisceglie AM, Neuschwander-Tetri BA, Bacon BR. Nonalcoholic steatohepatitis: a proposal for grading and staging the histological lesions. Am J Gastroenterol. 1999;94:2467–2474. doi: 10.1111/j.1572-0241.1999.01377.x. [DOI] [PubMed] [Google Scholar]
- Sheth SG, Gordon FD, Chopra S. Non alcoholic steatohepatitis. Ann Intern Med. 1997;126:137–145. doi: 10.7326/0003-4819-126-2-199701150-00008. [DOI] [PubMed] [Google Scholar]
- Ludwig J, McGill DB, Lindor KD. Nonalcoholic steatohepatitis. J Gastroenterol Hepatol. 1997;12:398–403. doi: 10.1111/j.1440-1746.1997.tb00450.x. [DOI] [PubMed] [Google Scholar]
- Sanyal AJ, Campbell-Sargent C, Mirshahi F, Rizzo WB, Contos MJ, Sterling RK, Luketic VA, Shiffman ML, Clore JN. Nonalcoholic steatohepatitis: association of insulin resistance and mitochondrial abnormalities. Gastroenterology. 2001;120:1183–1192. doi: 10.1053/gast.2001.23256. [DOI] [PubMed] [Google Scholar]
- Kurlawalla-Martinez C, Stiles B, Wang Y, Devaskar SU, Kahn BB, Wu H. Insulin hypersensitivity and resistance to streptozotocin-induced diabetes in mice lacking PTEN in adipose tissue. Mol Cell Biol. 2005;25:2498–2510. doi: 10.1128/MCB.25.6.2498-2510.2005. [DOI] [PMC free article] [PubMed] [Google Scholar]
- Koteish A, Mae Diehl A. Animal models of steatohepatitis. Best Pract Res Clin Gastroenterol. 2002;16:679–690. doi: 10.1053/bega.2002.0332. [DOI] [PubMed] [Google Scholar]
- Nanji AA. Animal models of nonalcoholic fatty liver disease and steatohepatitis. Clin Liver Dis. 2004;8:559–574. doi: 10.1016/j.cld.2004.04.002. [DOI] [PubMed] [Google Scholar]
- Sahai A, Malladi P, Pan X, Paul R, Melin-Aldana H, Green RM, Whitington PF. Obese and diabetic db/db mice develop marked liver fibrosis in a model of nonalcoholic steatohepatitis: role of short-form leptin receptors and osteopontin. Am J Physiol. 2004;287:G1035–G1043. doi: 10.1152/ajpgi.00199.2004. [DOI] [PubMed] [Google Scholar]
- Carmiel-Haggai M, Cederbaum AI, Nieto N. A high-fat diet leads to the progression of non-alcoholic fatty liver disease in obese rats. FASEB J. 2005;19:136–138. doi: 10.1096/fj.04-2291fje. [DOI] [PubMed] [Google Scholar]
- Buja LM, Kita T, Goldstein JL, Watanabe Y, Brown MS. Cellular pathology of progressive atherosclerosis in the WHHL rabbit. An animal model of familial hypercholesterolemia. Arteriosclerosis. 1983;3:87–101. doi: 10.1161/01.atv.3.1.87. [DOI] [PubMed] [Google Scholar]
- Okuno M, Akita K, Moriwaki H, Kawada N, Ikeda K, Kaneda K, Suzuki Y, Kojima S. Prevention of rat hepatic fibrosis by the protease inhibitor, camostat mesilate, via reduced generation of active TGF-beta. Gastroenterology. 2001;120:1784–1800. doi: 10.1053/gast.2001.24832. [DOI] [PubMed] [Google Scholar]
- Nishihara E, Nagayama Y, Inoue S, Hiroi H, Muramatsu M, Yamashita S, Koji T. Ontogenetic changes in the expression of estrogen receptor alpha and beta in rat pituitary gland detected by immunohistochemistry. Endocrinology. 2000;141:615–620. doi: 10.1210/endo.141.2.7330. [DOI] [PubMed] [Google Scholar]
- Nakatani K, Seki S, Kawada N, Kitada T, Yamada T, Sakaguchi H, Kadoya H, Ikeda K, Kaneda K. Expression of SPARC by activated hepatic stellate cells and its correlation with the stages of fibrogenesis in human chronic hepatitis. Virchows Arch. 2002;441:466–474. doi: 10.1007/s00428-002-0631-z. [DOI] [PubMed] [Google Scholar]
- Armendáriz-Borunda J, Rojkind M. A simple quantitative method for collagen typing in tissue samples: its application to human liver with schistosomiasis. Coll Relat Res. 1984;4:35–47. doi: 10.1016/s0174-173x(84)80027-8. [DOI] [PubMed] [Google Scholar]
- Kobayashi S, Seki S, Kawada N, Morikawa H, Nakatani K, Uyama N, Ikeda K, Nakajima Y, Arakawa T, Kaneda K. Apoptosis of T cells in the hepatic fibrotic tissue of the rat: a possible inducing role of hepatic myofibroblast-like cells. Cell Tissue Res. 2003;311:353–364. doi: 10.1007/s00441-002-0670-4. [DOI] [PubMed] [Google Scholar]
- Kristensen DB, Kawada N, Imamura K, Miyamoto Y, Tateno C, Seki S, Kuroki T, Yoshizato K. Proteome analysis of rat hepatic stellate cells. Hepatology. 2000;32:268–277. doi: 10.1053/jhep.2000.9322. [DOI] [PubMed] [Google Scholar]
- Uyama N, Shimahara Y, Okuyama H, Kawada N, Kamo S, Ikeda K, Yamaoka Y. Carbenoxolone inhibits DNA synthesis and collagen gene expression in rat hepatic stellate cells in culture. J Hepatol. 2003;39:749–755. doi: 10.1016/s0168-8278(03)00375-1. [DOI] [PubMed] [Google Scholar]
- Palacios I, Lopez-Armada MJ, Hernandez P, Sanchez-Pernaute O, Gutierrez S, Miguelez R, Martinez J, Egido J, Herrero-Beaumont G. Tenidap decreases IL-8 and monocyte chemotactic peptide-1 (MCP-1) mRNA expression in the synovial tissue of rabbits with antigen arthritis and in cultured synovial cells. Clin Exp Immunol. 1998;111:588–596. doi: 10.1046/j.1365-2249.1998.00530.x. [DOI] [PMC free article] [PubMed] [Google Scholar]
- Martin SJ, Reutelingsperger CP, McGahon AJ, Rader JA, van Schie RC, LaFace DM, Green DR. Early redistribution of plasma membrane phosphatidylserine is a general feature of apoptosis regardless of the initiating stimulus: inhibition by overexpression of Bcl-2 and Abl. J Exp Med. 1995;182:1545–1556. doi: 10.1084/jem.182.5.1545. [DOI] [PMC free article] [PubMed] [Google Scholar]
- Lanier LL, Le AM, Phillips JH, Warner NL, Babcock GF. Subpopulations of human natural killer cells defined by expression of the Leu-7 (HNK-1) and Leu-11 (NK-15) antigens. J Immunol. 1983;131:1789–1796. [PubMed] [Google Scholar]
- Reichert RA, Weissman IL, Butchr EC. Phenotypic analysis of thymocytes that express homing receptors for peripheral lymph nodes. J Immunol. 1986;136:3521–3528. [PubMed] [Google Scholar]
- Harrison JH, Jr, Jollow DJ. Role of aniline metabolites in aniline-induced hemolytic anemia. J Pharmacol Exp Ther. 1986;238:1045–1054. [PubMed] [Google Scholar]
- Mandal D, Moitra PK, Saha S, Basu J. Caspase 3 regulates phosphatidylserine externalization and phagocytosis of oxidatively stressed erythrocytes. FEBS Lett. 2002;513:184–188. doi: 10.1016/s0014-5793(02)02294-9. [DOI] [PubMed] [Google Scholar]
- Gao C, Guo H, Wei J, Kuo PC. Osteopontin inhibits expression of cytochrome c oxidase in RAW 264.7 murine macrophages. Biochem Biophys Res Commun. 2003;309:120–125. doi: 10.1016/s0006-291x(03)01534-1. [DOI] [PubMed] [Google Scholar]
- Kawada N, Seki S, Inoue M, Kuroki T. Effect of antioxidants, resveratrol, quercetin, and N-acetylcysteine, on the functions of cultured rat hepatic stellate cells and Kupffer cells. Hepatology. 1998;27:1265–1274. doi: 10.1002/hep.510270512. [DOI] [PubMed] [Google Scholar]
- Rosenfeld ME, Khoo JC, Miller E, Parthasarathy S, Palinski W, Witztum JL. Macrophage-derived foam cells freshly isolated from rabbit atherosclerotic lesions degrade modified lipoproteins, promote oxidation of low-density lipoproteins, and contain oxidation-specific lipid-protein adducts. J Clin Invest. 1991;87:90–99. doi: 10.1172/JCI115006. [DOI] [PMC free article] [PubMed] [Google Scholar]
- Esterbauer H, Schaur RJ, Zollner H. Chemistry and biochemistry of 4-hydroxynonenal, malondialdehyde and related aldehydes. Free Radic Biol Med. 1991;11:81–128. doi: 10.1016/0891-5849(91)90192-6. [DOI] [PubMed] [Google Scholar]
- George DK, Goldwurm S, MacDonald GA, Cowley LL, Walker NI, Ward PJ, Jazwinska EC, Powell LW. Increased hepatic iron concentration in non-alcoholic steato-hepatitis is associated with increased fibrosis. Gastroenterology. 1998;114:311–317. doi: 10.1016/s0016-5085(98)70482-2. [DOI] [PubMed] [Google Scholar]
- Hanayama R, Tanaka M, Miwa K, Shinohara A, Iwamatsu A, Nagata S. Identification of a factor that links apoptotic cells to phagocytes. Nature. 2002;417:182–187. doi: 10.1038/417182a. [DOI] [PubMed] [Google Scholar]
- Shimomura I, Matsuda M, Hammer RE, Bashmakov Y, Brown MS, Goldstein JL. Decreased IRS-2 and increased SREBP-1c lead to mixed insulin resistance and sensitivity in livers of lipodystrophic and ob/ob mice. Mol Cell. 2000;6:77–86. [PubMed] [Google Scholar]
- Feldstein AE, Werneburg NW, Canbay A, Guicciardi ME, Bronk SF, Rydzewski R, Burgart LJ, Gores GJ. Free fatty acids promote hepatic lipotoxicity by stimulating TNF-alpha expression via a lysosomal pathway. Hepatology. 2004;40:185–194. doi: 10.1002/hep.20283. [DOI] [PubMed] [Google Scholar]
- Slater TF. Free-radical mechanisms in tissue injury. Biochem J. 1984;222:1–15. doi: 10.1042/bj2220001. [DOI] [PMC free article] [PubMed] [Google Scholar]
- Cheeseman KH. Mechanism and effects of lipid peroxidation. Mol Aspects Med. 1993;14:191–197. doi: 10.1016/0098-2997(93)90005-x. [DOI] [PubMed] [Google Scholar]
- Poli G, Albano E, Dianzani MU. The role of lipid peroxidation in liver damage. Chem Phys Lipids. 1987;45:117–142. doi: 10.1016/0009-3084(87)90063-6. [DOI] [PubMed] [Google Scholar]
- Parola M, Pinzani M, Casini A, Albano E, Poli G, Gentilini A, Gentilini P, Dianzani MU. Stimulation of lipid peroxidation or 4-hydroxynonenal treatment increases procollagen expression in human fat-storing cells. Biochem Biophys Res Commum. 1993;194:1044–1050. doi: 10.1006/bbrc.1993.1927. [DOI] [PubMed] [Google Scholar]
- Kamimura S, Gaal K, Britton RS, Bacon BR, Triadafilopoulos G, Tsukamoto H. Increased 4-hydroxynonenal levels in experimental alcoholic liver disease: association of lipid peroxidation with liver fibrogenesis. Hepatology. 1992;16:448–453. doi: 10.1002/hep.1840160225. [DOI] [PubMed] [Google Scholar]
- Bedossa P, Houglum K, Trautwein C, Holstege A, Chojkier M. Stimulation of collagen α1(I) gene expression is associated with lipid peroxidation in hepatocellular injury: a link to tissue fibrosis? Hepatology. 1994;19:1262–1271. [PubMed] [Google Scholar]
- Ikura Y, Morimoto H, Jomura H, Fukui M, Sakurai M. Relationship between hepatic iron deposits and response to interferon in chronic hepatitis C. Am J Gastroenterol. 1996;91:1367–1373. [PubMed] [Google Scholar]
- Di Bisceglie AM, Axiotis C, Hoofnagle JH, Bacon BR. Measurement of iron status in patients with chronic hepatitis. Gastroenterology. 1992;102:2108–2113. doi: 10.1016/0016-5085(92)90339-z. [DOI] [PubMed] [Google Scholar]
- Lustbader ED, Hann HW, Blumberg BS. Serum ferritin as a predictor of host response to hepatitis B virus infection. Science. 1983;220:423–425. doi: 10.1126/science.6301008. [DOI] [PubMed] [Google Scholar]
- Bassett ML, Halliday JW, Powell LW. Value of hepatic iron measurement in early hemochromatosis and determination of the critical iron level associated with fibrosis. Hepatology. 1986;6:24–29. doi: 10.1002/hep.1840060106. [DOI] [PubMed] [Google Scholar]
- Hayashi H, Takikawa T, Nishimura N, Yano M, Isomura T, Sakamoto N. Improvement of serum aminotransferase levels after phlebotomy in patients with chronic active hepatitis C and excess hepatic iron. Am J Gastroenterol. 1994;89:986–988. [PubMed] [Google Scholar]
- Bugianesi E, Manzini P, D’Antico S, Vanni E, Longo F, Leone N, Massarenti P, Piga A, Marchesini G, Rizzetto M. Relative contribution of iron burden, HFE mutations, and insulin resistance to fibrosis in nonalcoholic fatty liver. Hepatology. 2004;39:179–187. doi: 10.1002/hep.20023. [DOI] [PubMed] [Google Scholar]
- Facchini FS, Hua NW, Stoohs RA. Effect of iron depletion in carbohydrate-intolerant patients with clinical evidence of nonalcoholic fatty liver disease. Gastroenterology. 2002;122:931–939. doi: 10.1053/gast.2002.32403. [DOI] [PubMed] [Google Scholar]
- Hynes RO. Integrins: versatility, modulation, and signalling in cell adhesion. Cell. 1992;69:11–25. doi: 10.1016/0092-8674(92)90115-s. [DOI] [PubMed] [Google Scholar]
- López-Revuelta A, Sanchez-Gallego JI, Hernandez-Hernandez A, Sanchez-Yagqe J, Llanillo M. Increase in vulnerability to oxidative damage in cholesterol-modified erythrocytes exposed to t-BuOOH. Biochim Biophys Acta. 2005;1734:74–85. doi: 10.1016/j.bbalip.2005.02.004. [DOI] [PubMed] [Google Scholar]
- Matteucci E, Giampietro O. Oxidative stress in families of type 1 diabetic patients. Diabetes Care. 2000;23:1182–1186. doi: 10.2337/diacare.23.8.1182. [DOI] [PubMed] [Google Scholar]
- Ikura Y, Ohsawa M, Suekane T, Fukushima H, Itabe H, Jomura H, Nishiguchi S, Inoue T, Naruko T, Ehara S, Kawada N, Arakawa T, Ueda M. Localization of oxidized phosphatidylcholine in nonalcoholic fatty liver disease: impact on disease progression. Hepatology. 2006;43:506–514. doi: 10.1002/hep.21070. [DOI] [PubMed] [Google Scholar]
- Lang KS, Lang PA, Bauer C, Duranton C, Wieder T, Huber SM, Lang F. Mechanisms of suicidal erythrocyte death. Cell Physiol Biochem. 2005;15:195–202. doi: 10.1159/000086406. [DOI] [PubMed] [Google Scholar]
Associated Data
This section collects any data citations, data availability statements, or supplementary materials included in this article.


