

Abstract
Numerous genomic and proteomic datasets are permitting the elucidation of transcriptional regulatory networks in the yeast Saccharomyces cerevisiae. However, predicting the condition dependence of regulatory network interactions has been challenging, because most protein–DNA interactions identified in vivo are from assays performed in one or a few cellular states. Here, we present a novel method to predict the condition-specific functions of S. cerevisiae transcription factors (TFs) by integrating 1327 microarray gene expression data sets and either comprehensive TF binding site data from protein binding microarrays (PBMs) or in silico motif data. Importantly, our method does not impose arbitrary thresholds for calling target regions ‘bound' or genes ‘differentially expressed', but rather allows all the information derived from a TF binding or gene expression experiment to be considered. We show that this method can identify environmental, physical, and genetic interactions, as well as distinct sets of genes that might be activated or repressed by a single TF under particular conditions. This approach can be used to suggest conditions for directed in vivo experimentation and to predict TF function.
Keywords: DNA binding specificity, condition dependence, function prediction, gene expression, transcription factors
Introduction
The coordinated regulation of gene expression in response to changing environmental or cellular states (‘conditions') is essential to organism survival. A central mode of gene regulation in Saccharomyces cerevisiae is accomplished through binding of regulatory transcription factors (TFs) to intergenic regions (IGRs) of the genome in a condition-specific manner. In vivo approaches such as genome-wide location analysis (‘ChIP–chip') (Reid et al, 2000; Ren et al, 2000; Iyer et al, 2001; Lieb et al, 2001) have generated binding site data for many S. cerevisiae TFs (Lee et al, 2002; Harbison et al, 2004). However, because ChIP–chip identifies binding sites in the particular in vivo context in which the crosslinking was performed, yeast would need to be cultured in an indeterminate number of different conditions to determine all the biologically relevant DNA binding sites of a given TF. In contrast, in vitro protein binding microarray (PBM) technology (Bulyk et al, 2001) can be used to identify all potential binding sites of a particular TF (Berger et al, 2006) in the yeast genome (Mukherjee et al, 2004), yet such in vitro techniques cannot determine if or when the identified binding sites are utilized in vivo.
Recent studies on transcriptional regulation in yeast have attempted to address the limitations of individual data types by combining information from multiple experimental sources. The idea that genes coregulated by a given TF are expected to be coexpressed, notwithstanding coregulation by additional TFs, has been implemented previously in algorithms that combine gene expression and TF binding site data (Hartemink et al, 2001, 2002; Bar-Joseph et al, 2003; Gao et al, 2004; Marion et al, 2004; Cole et al, 2005; Holloway et al, 2005; Kim et al, 2006). However, most of those studies employed a threshold parameter to define a set of TF target genes, and none considered a comprehensive, condition-independent in vitro TF binding site data type.
In this study, we have developed a novel algorithm, called ‘CRACR' (Combination Rank-order Analysis of Condition-specific Regulation; pronounced ‘cracker'), which derives information about condition-specific gene regulation and TF activity by combining comprehensive, condition-independent PBM data for a given TF with gene expression microarray data under a variety of biological conditions (see Supplementary Figure 1 for schema). Specifically, CRACR searches for conditions in which genes downstream of IGRs exhibiting significant TF binding in PBMs are enriched among differentially expressed genes. In contrast to earlier studies, CRACR integrates PBM-derived experimental TF binding site data with gene expression data without imposing arbitrary cutoffs that define which IGRs are ‘bound' or which genes are ‘differentially expressed'. Indeed, experimental evidence suggests that both low-affinity TF–DNA interactions (Berger et al, 2006; Tanay, 2006) and modest gene expression changes (Hughes et al, 2000b) may be important in gene regulation, and such interactions likely would be missed by the use of arbitrary cutoffs. In addition, our use of rank order statistics in CRACR facilitates comparison of gene expression data from different microarray platforms.
CRACR does not require that the TF itself be coexpressed with its target genes, thus extending the applicability of this analysis to TFs such as Mig1, which are primarily regulated by changes in subcellular localization rather than overall abundance (De Vit et al, 1997), or Tec1, whose abundance is controlled more by protein degradation than by changes in gene expression (Bao et al, 2004). Our approach can generate new hypotheses about the condition-specific activity of TFs, which can be validated by directed in vivo experimentation. The conditions in which a particular TF is predicted to be active can also be used to infer its function without any prior knowledge about either the TF itself or its putative targets.
Results and discussion
Prediction of the condition-specific function(s) of yeast TFs
We considered 1327 publicly available gene expression microarray data sets obtained for S. cerevisiae in various cellular or environmental states (we shall refer to each of these individual microarray data sets as an ‘expression condition'). For each condition, we first order the genes from induced to repressed by expression fold-change. Next, we assign ranks to the genes according to the PBM P-values of TF binding to their upstream IGRs. We then use a rank-based, mean-centered area under the receiver operating characteristic curve (AUC) statistical test (see Materials and methods section) to compare the PBM-defined ranks of similarly expressed genes within a sliding foreground window to the ranks of a length-matched background set of genes outside this window. The result of this statistical test yields a value which we refer to as the ‘enrichment score' or ‘area statistic' and represents the degree to which PBM-derived target genes of a given TF are significantly enriched within each window of similarly expressed genes. We determine the statistical significance of the maximum enrichment in a condition by permutation testing (see the Materials and methods section).
The expression conditions in which predicted TF target genes are significantly differentially expressed can lead to hypotheses about the function(s) of the TF. Indeed, the results of such analysis for characterized TFs examined in this study agree with their annotated functions. For example, CRACR results show that the genes repressed when glucose is added to the cell culture medium are significantly enriched for genes immediately downstream of IGRs with highly significant Mig1 PBM P-values (Figure 1). The converse is seen for expression in diauxic shift (Figure 1); there, PBM-derived Mig1 target genes are enriched among the most induced (derepressed) genes. These results are consistent with the known role of Mig1 in glucose repression (Lutfiyya et al, 1998).
Figure 1.

Results of CRACR analysis for various expression conditions. Area statistic for PBM target gene enrichment (see the Materials and methods section) is plotted (y axis) for each window of expression-ordered genes (x axis), using a window size of 200 genes. Mig1 target genes are significantly enriched (A) among repressed genes in glucose addition and (B) among derepressed genes in diauxic shift (21 h time point is shown). Deletion of either (C) Tup1 or (D) Cyc8 results in derepression of Mig1 targets. (E) Induction of Rap1 target genes in genetic interactor Sin3 deletion. (F) Induction of Mig1 targets in the Aep2 deletion.(G) Negative control: no enrichment for Cbf1 targets among differentially expressed genes in glucose addition. The dotted line in each panel indicates the P<0.001 significance threshold. The background color indicates gene expression fold change as depicted in the colorbar.
Although such analysis of individual expression conditions can be highly informative, we sought to develop an automated approach that would identify the types of conditions in which any given TF is likely to be exerting its regulatory role. Therefore, we first annotated each gene expression data set with ‘condition annotation terms' describing the general class of perturbation applied (i.e. amino acid starvation, α factor treatment, etc.) and the biological processes (i.e. RNA processing, pheromone response, sporulation, etc.) that are affected in the given experimental condition, following an initial set of annotation terms described previously (Marion et al, 2004). For each TF, we performed CRACR analysis on the 1327 expression conditions, and then examined all statistically significant conditions for over-representation of these condition annotation terms. For Mig1, we found that the set of significant conditions is enriched for annotations such as carbohydrate metabolism and response to glucose starvation, consistent with Mig1's role in glucose repression (Lutfiyya et al, 1998). Some stress response annotations are also significant for Mig1, potentially reflecting the similarity between the Mig1 binding site (TGTGGGG) and the canonical stress response motif (AGGGG) (Conlon et al, 2003; Mukherjee et al, 2004) and indicating the effect of non-nutrient stresses such as heat shock on metabolic processes such as carbohydrate metabolism (Gasch et al, 2000). Condition annotation terms over-represented among expression conditions significant for Rap1 (protein biosynthesis, response to stress, and others), Cbf1 (amino acid metabolism, nitrogen utilization), and Abf1 (silencing, processes affecting general transcriptional regulation such as histone depletion) are also supported by the annotations of these TFs in the Saccharomyces Genome Database (http://www.yeastgenome.org/) (Cherry et al, 1998). The expression conditions found to be significant for each TF and the biological significance of these conditions are qualitatively very similar for foreground window sizes of 200 or 300 genes. The full set of significant conditions for various window sizes and significance thresholds for each TF, along with the corresponding significant condition annotation terms, are provided in the Supplementary information (Supplementary Data 1). The success of CRACR with characterized TFs suggests its potential for future use in predicting the functions of uncharacterized TFs.
Identification of genetic and physical interactions
As the interactions between a TF and other proteins in the cell play a key role in TF function, we investigated whether CRACR could identify potential genetic and physical interaction partners of a given TF. If a certain gene mutation has an effect on the expression of a certain TF's target genes, then that gene may be a genetic or physical interaction partner of the TF of interest. We searched for and identified examples of such interactions using CRACR and the 677 expression data sets for various yeast mutants. For example, when either Tup1 or Cyc8 (Ssn6), known members of a corepressor complex with Mig1, is deleted, the PBM-derived target genes of Mig1 are derepressed (Figure 1C and D). Similarly, Rap1 targets are upregulated when Sin3, which exhibits a synthetic rescue interaction with Rap1, is deleted (Figure 1E), suggesting a regulatory relationship between Sin3 and Rapl that may mediate their genetic interaction. The ability of CRACR to recover further genetic and physical interactions was evaluated using a reduced interaction network, containing only those proteins known to interact with Abf1, Rap1, Mig1, and Cbf1, and for which expression data on mutant strains were available. With this analysis of PBM and mutant expression data, at an expression condition significance threshold of P<0.001 we were able to identify 30% of validated protein–protein interactions and 40% of synthetic lethal interactions for these TFs (we identify 30 and 50% respectively at P<0.01; Figure 2). In addition to recovering previously discovered physical and genetic interactions, CRACR can also predict novel biological interactions. For example, when the mitochondrial TF Aep2 is deleted, PBM-derived Mig1 target genes are enriched among the induced genes (Figure 1F), perhaps reflecting the effects of crosstalk between mitochondrial and nuclear energy regulation networks (Poyton and McEwen, 1996).
Figure 2.

Physical and genetic interactions recovered by CRACR analysis for the four TFs with PBM data (yellow nodes). A reduced interaction network, containing only those interactions between the query TF and proteins with expression data for a mutant strain (light blue nodes), is shown. Edge thickness corresponds to the enrichment, measured by the maximum area statistic for a window size of 200 genes of TF targets among genes differentially expressed when the interactor is mutated. Solid edges indicate CRACR enrichment significant to P<0.001. Edge color indicates interaction type: genetic (green) or physical (navy).
Predicting condition-specific gene regulation and TF binding site usage
After using the cutoff-free CRACR algorithm to select significant expression conditions, we examined the particular genes most likely to be targeted by the TF in each significant condition (genes within the significant foreground windows with Bonferroni-corrected PBM P-values <0.001; Supplementary Data 2). With this approach, CRACR analysis of Cbf1 PBM data predicted that an expanded set of target genes are regulated by Cbf1 under amino acid deprivation conditions as compared to growth in rich medium. This CRACR prediction is supported by the ‘condition-expanded' binding of Cbf1 observed in ChIP–chip experiments (Harbison et al, 2004). Of this expanded set of target genes predicted by CRACR, 80% are bound in vivo in the amino acid deprivation ChIP–chip experiment (Harbison et al, 2004). Thus, CRACR can predict the condition-specific binding observed in in vivo experiments and identify biologically relevant condition-specific functional modules of TF targets from in vitro PBM data.
As demonstrated with the above example of Cbf1, TFs often bind different target genes under different conditions. Thus, although IGRs bound in PBMs but not in a ChIP–chip data set for a single condition might be false positives in a biological sense, they might also represent real TF targets that are missed by ChIP–chip either because the TF was not bound to these targets in the examined cellular state or because of epitope inaccessibility (Mukherjee et al, 2004) (Supplementary Figure 2). CRACR analysis of these IGRs bound strongly in PBMs but not in ChIP–chip can determine if and in what conditions the predicted TF binding sites serve a regulatory role. To identify conditions in which up- or downregulated genes are enriched for PBM-predicted target genes not occupied in a given ChIP–chip experiment, we ranked IGRs according to log(PBM rank/ChIP–chip rank). We then used CRACR to search for enrichment of these ‘PBM NOT ChIP–chip' genes among differentially expressed genes in various biological conditions.
To observe the subtle effect of subsets of genes bound in PBM but not ChIP–chip experiments, and to generate biological hypotheses for future experimentation to elucidate the regulation of these genes, we considered CRACR results at a less stringent significance threshold (CRACR P<0.05). Using Rap1 as an example, the resulting significant conditions, which include changes in nutrient sources, heat shock or oxidative stress, are good candidates for conditions in which these PBM-derived target genes may actually be regulated by Rap1. Among the hypotheses generated by the above approach, CRACR predicts that the Rap1 targets bound more significantly in PBMs than in a rich medium ChIP–chip experiment will be induced after diamide treatment (Figure 3). Interestingly, these additional Rap1 targets are bound less strongly (less significant PBM P-values) than those predicted to be repressed in this oxidative stress condition (Figure 3D). This novel CRACR prediction that a distinct set of lower affinity binding sites are occupied and upregulated by Rap1 under certain conditions is supported by recent experimental data, which showed that chromatin conformational changes expose a similar set of lower affinity sites for Rap1 binding in low glucose conditions (Buck and Lieb, 2006). As in those experiments, many of the genes predicted to be upregulated in diamide treatment encode glycolytic enzymes. This biological prediction again demonstrates the importance of the cutoff-free CRACR approach, as the biological relevance of these lower affinity Rap1 binding sites would have been missed with the use of a stringent binding P-value cutoff.
Figure 3.

Condition-specific regulation of PBM-only Rap1 target genes. (A) When ChIP–chip P-values for Rap1 for yeast grown in rich medium (Harbison et al, 2004) are used to rank genes in CRACR analysis, ChIP–chip-derived target genes are shown to be repressed after diamide treatment (P<0.001). (B) PBM P-values identify some target genes that are induced (P<0.05) and others that are repressed (P<0.001) in this same diamide treatment condition. (C) The genes induced by diamide treatment are enriched for targets identified by PBM but not ChIP–chip (P<0.05). Genes are ranked by log (PBM rank/ChIP–chip rank). (D) When the IGRs are ordered along the x axis by the significance of their Rap1 PBM P-values and the area statistic measures enrichment of downstream genes that are highly induced (positive signal) or highly repressed (negative signal) in diamide-treated cells, it is evident that the strongest Rap1 binding sites tend to be upstream of genes that are repressed, whereas intermediate affinity binding sites tend to regulate genes that are induced in this diamide condition.
Using ChIP–chip or in silico TF binding site motifs
In the absence of PBM data, our approach can be applied to other experimental or in silico data types that can be used to score IGRs according to TF binding site data. As an example, we considered Rap1 motifs derived either purely computationally from a group of annotated ribosomal protein genes (Hughes et al, 2000a) or from a Rap1 ChIP–chip experiment performed in a single environmental condition (Harbison et al, 2004), and then scored IGRs according to the strength of their matches to these motifs (see the Materials and methods section). We ranked the IGRs according to this score, and then used CRACR to predict the condition-specific usage of the predicted binding sites. CRACR results are similar for these independently derived motifs (Supplementary Figure 3), demonstrating the broad applicability of the CRACR algorithm to TF binding site data from various data types. The results with these motifs suggest the presence of upregulated Rap1 targets in this diamide treatment condition, as was predicted by CRACR analysis with the PBM data. However, ranking the IGRs by the strength of their matches to a motif never recovers the predicted role of these genes as strongly as ranking by PBM P-values. This is expected from previous indications that Rap1 upregulates this group of genes through a lower affinity Rap1 motif likely missed by motif searches with a Rap1 consensus sequence (Buck and Lieb, 2006). Nonetheless, the general similarities between the results obtained with motifs and PBM data indicate that motif data could also be used with CRACR to predict additional conditions for in vivo TF binding.
Conclusions
CRACR not only provides information about the general biological processes in which a given TF is involved and in what cellular or environmental conditions that regulation occurs, but also suggests new regulatory interactions. Therefore, CRACR results could be used to direct experimentation to investigate environmental, physical or genetic interactions. A major strength of CRACR lies in its ability to integrate different types of existing high-throughput genomic data sets to map condition specificity onto the activity of TFs whose DNA binding sites were identified either through rapid, condition-independent in vitro PBM experiments or other techniques. This provides an approach to understanding the condition-specific regulation of genes in a way that is more feasible than performing in vivo binding site location analysis experiments, such as ChIP–chip, in all possible cellular states. These results also suggest that the CRACR approach may be useful in determining the functions and condition-specific utilization of uncharacterized yeast TFs.
Materials and methods
Large-scale data sets used in this study
The PBM data for Rap1, Abf1, and Mig1 were published previously (Mukherjee et al, 2004). As part of this study, we generated Cbf1 PBM data (Supplementary Data 3) as described previously (Mukherjee et al, 2004). The Rap1 and Cbf1 ChIP–chip data sets considered in this study were published previously (Harbison et al, 2004); we considered as ‘bound' those IGRs called bound in that study at P<0.001. The 1327 publicly available gene expression microarray datasets considered in this study were published previously and include 650 environmental stresses and perturbations, as well as 407 deletion, 215 titratable promoter, and 55 overexpressor strains (Ihmels et al, 2004; Mnaimneh et al, 2004; Chua et al, 2006); a list of these 1327 datasets and the full set of expression data are available upon request. Protein–protein interaction data and synthetic lethality data were obtained from published sources as compiled in MIPS (Mewes et al, 2002) and BioGRID (Stark et al, 2006).
Mapping TF binding sites to genes
IGRs were assigned to any downstream genes that they might potentially regulate, using the criteria that the regulated gene must either be the closest downstream gene or a secondary downstream gene with a transcription start site within 500 bp of the end of the IGR microarray probe (Lee et al, 2002; Harbison et al, 2004). This assignment method allows for the possibility that a single IGR may regulate different genes under different conditions.
Rank order statistics and the area statistic
The relevance of a certain TF to the regulation of gene expression in a particular condition was determined using rank order statistics and a mean-centered area under the ROC curve (AUC) statistical measure (Agarwal and Graepel, 2005). This test measures the area between the sensitivity and specificity curves for foreground and background gene sets, thereby quantifying the degree to which a set of similarly expressed foreground genes ranks higher than a set of background genes on the basis of the strength of TF binding (measured in this study by PBM P-value) in their regulatory regions. To choose the foreground and background sets, we first ordered all the genes in the yeast genome according to their expression fold-changes in the condition of interest; we shall now consider these genes as being placed along an ‘expression axis' according to this ordering. Alternative methods for quantifying gene expression changes, such as P-values of the observed fold-change (Hughes et al, 2000b; Allison et al, 2006), could be used to order the genes for CRACR analysis. We have chosen to consider gene expression fold-change in this study because of this metric's simplicity and frequency of use, and we note that using a different expression metric does not affect the most significant results from CRACR analysis (Supplementary Figure 4A and B), although less significant results may vary (Supplementary Figure 4C). A ‘foreground set' is thus a window of similarly expressed genes along this expression axis and a ‘background set' of genes is selected from the remaining genes outside this foreground window. Next, for the TF under consideration, we assigned a rank to each gene based on its associated PBM P-value (rank of 1 corresponds to the gene with the most significant PBM P-value). In cases of ties in PBM ranks, we assigned the mean rank of the tied genes.
To evaluate the enrichment of significant TF targets among similarly differentially expressed genes, relative to the rest of the genes in the genome, we calculated a mean-centered AUC as follows: 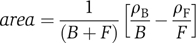 where B is the size of the background set of genes, F the foreground size (window size), ρB the sum of ranks in the background set and ρF the sum of ranks in the foreground set. This area statistic ranges between −0.5 and 0.5 and evaluates effect sizes while normalizing for differences in sample sizes (Philippakis et al, 2006). Positive values of the enrichment score indicate that the ranks in the foreground set are higher than ranks in the background, and thus the window of genes is enriched for probable TF targets. Negative area, conversely, indicates that genes within the window contain fewer likely TF targets than the entire set of genes in general. The initial window of foreground genes encompassed the most highly induced genes along the expression axis, and then we moved the window, one gene at a time, down to the most repressed genes along the expression axis. The area statistic calculated for each foreground window position was plotted along the expression axis at the center of the window of foreground genes.
Window size selection
When choosing a window size, we first noted that small window sizes (<150 genes) resulted in substantial ‘noise' in the area statistic and an increased likelihood that large area statistic results would be found among randomly ordered genes with no expected biologically significant clusterings (Supplementary Figure 5A). To minimize the effect of random co-occurrences of a few genes with highly significant PBM P-values while highlighting the persistent enrichment of TF targets among a larger set of similarly expressed genes, in this study, we used only window sizes of at least 100 genes. As the window size increases beyond ∼500 genes, the foreground set will begin to contain both genes that are differentially expressed and those whose expression is not significantly changed, and the biologically significant enrichment of TF targets among differentially regulated genes will be lost (Supplementary Figure 5B). Thus, to minimize the effect of random co-occurrences of a few genes with highly significant PBM P-values while highlighting the persistent enrichment of TF targets among a larger set of similarly expressed genes, in this study, we report CRACR results using window sizes of 100, 200 and 300 genes. Within this range, the significance of the biologically relevant results is maintained while background noise is minimized. All figures were generated using a window size of 200 genes as the results with each of these window sizes are qualitatively similar. Some differences in the relative significance of individual conditions may result from variations in the number of highly differentially regulated genes from one condition to another, and thus the full set of significant conditions are reported at a variety of window sizes so that any minor differences in the results for particular TFs and particular expression conditions for different window sizes can be observed.
Intergenic region length correction
We employed a length correction in our conditions analysis to correct for potential biases arising from the fact that longer IGRs have been found to be associated with more highly variable gene expression (Supplementary Figure 6A) (Bilu and Barkai, 2005) and that longer IGRs may tend to be more significantly bound in PBM experiments (Supplementary Figure 6B). For any given window of foreground genes, a length-matched background set of genes, containing six times as many genes as the foreground set, was selected such that the distributions of sequence lengths of the associated IGRs for the foreground and background sets were nearly identical. This was accomplished by first ordering all the IGRs by length, and then selecting the six background IGRs nearest in length to each foreground gene (Philippakis et al, 2006). A large background size minimizes noise, but length matching often begins to fail as more genes are added to the background set. The net effect of the length bias can be measured by ranking the genes by their IGR lengths rather than by a PBM P-value (as in Supplementary Figure 6C) and calculating the maximum area statistic obtained for any expression condition based on lengths alone. We chose the maximum background size for which this measured length bias contributes no more than 0.001 to the final area statistic such that the potential contribution of the length bias to a significant area statistic was less than 1%.
Evaluation of statistical significance of expression conditions
To calculate the significance of the enrichment determined by the area statistic, we employed a permutation test. Specifically, genes were assigned random ranks, and the enrichment was calculated using these random ranks. We performed this process 1000 times and then fit an extreme value distribution to the set of maximum area statistic values seen during each permutation. The extreme value distribution follows the form:
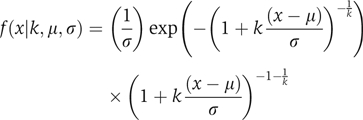 |
with location parameter μ, scale parameter σ and shape parameter k. The significance of the maximum area statistic observed with real PBM data was then calculated from this extreme value distribution, and we required a P-value of 0.001 to call an expression condition ‘significant'. As the variance of enrichment scores for random sets of genes decreases for increasing window sizes (Supplementary Figure 5A), different significance thresholds are required for analysis using different window sizes. The parameters of the generalized extreme value distribution and the corresponding threshold values of the area statistic required to achieve P<0.001 significance for the window sizes used in this study are listed in Supplementary Table I.
Expression condition annotation term enrichment
Gene expression conditions were annotated with terms describing the biological functions that are affected by the given experimental condition being examined (i.e., environmental context, such as heat-shock response, or cellular state, such as sporulation), following an initial set of annotation terms described by Marion and co-workers (Marion et al, 2004). A hypergeometric distribution (Tavazoie et al, 1999; Hughes et al, 2000a) was used in calculating whether the conditions in which a given TF was deemed active were significantly enriched for any of these annotation terms.
Use of in silico motifs with CRACR
We separately considered three independently published Rap1 motifs, derived either from AlignACE motif searching of the upstream regions of annotated ribosomal protein genes (Hughes et al, 2000a), from IGRs bound in PBMs (P<0.001) (Mukherjee et al, 2004), or from IGRs bound in YPD medium in ChIP–chip (P<0.001) (Harbison et al, 2004), in a ScanACE search (Hughes et al, 2000a) of all yeast IGRs. We retrieved the ScanACE scores of the best 10 000 matches to each of these three separate Rap1 motifs; the retrieved motif matches scored about 8–10 standard deviations below the motif means. Next, we assigned a rank to each IGR based on the sum of the motif scores of all binding site matches within each IGR. We intentionally used this permissive threshold so that we could obtain a continuous measure of the potential for TF binding in IGRs. We then used these IGR ranks in CRACR analysis.
Unless a specifically mentioned web-based tool was used, all of the computational analyses and algorithms described in this study were implemented in MATLAB and Perl.
Supplementary Material
Supplementary Figure 1
Supplementary Figure 2
Supplementary Figure 3
Supplementary Figure 4
Supplementary Figure 5
Supplementary Figure 6
Supplementary Table 1
Supplementary Data 1
Supplementary Data 2
Supplementary Data 3
Acknowledgments
We thank Savina Jaeger, Cong Zhu, Federico De Masi, and Trevor Siggers for helpful discussion. We thank Louis Becker for suggesting the name CRACR. This work was funded in part by grant R01 HG003420 from National Institutes of Health/National Human Genome Research Institute to MLB. RPM, MFB, and AAP were supported in part by National Science Foundation Graduate Research Fellowships. AAP was also supported in part by an Athinoula Martinos Fellowship.
References
- Agarwal P, Graepel T (2005) Generalization bounds for the area under the ROC curve. J Machine Learning 6: 393–425 [Google Scholar]
- Allison DB, Cui X, Page GP, Sabripour M (2006) Microarray data analysis: from disarray to consolidation and consensus. Nat Rev Genet 7: 55–65 [DOI] [PubMed] [Google Scholar]
- Bao MZ, Schwartz MA, Cantin GT, Yates JR III, Madhani HD (2004) Pheromone-dependent destruction of the Tec1 transcription factor is required for MAP kinase signaling specificity in yeast. Cell 119: 991–1000 [DOI] [PubMed] [Google Scholar]
- Bar-Joseph Z, Gerber GK, Lee TI, Rinaldi NJ, Yoo JY, Robert F, Gordon DB, Fraenkel E, Jaakkola TS, Young RA, Gifford DK (2003) Computational discovery of gene modules and regulatory networks. Nat Biotechnol 21: 1337–1342 [DOI] [PubMed] [Google Scholar]
- Berger MF, Philippakis AA, Qureshi AM, He FS, Estep PW III, Bulyk ML (2006) Compact, universal DNA microarrays to comprehensively determine transcription-factor binding site specificities. Nat Biotechnol 24: 1429–1435 [DOI] [PMC free article] [PubMed] [Google Scholar]
- Bilu Y, Barkai N (2005) The design of transcription-factor binding sites is affected by combinatorial regulation. Genome Biol 6: R103. [DOI] [PMC free article] [PubMed] [Google Scholar]
- Buck MJ, Lieb JD (2006) A chromatin-mediated mechanism for specification of conditional transcription factor targets. Nat Genet 38: 1446–1451 [DOI] [PMC free article] [PubMed] [Google Scholar]
- Bulyk ML, Huang X, Choo Y, Church GM (2001) Exploring the DNA binding specificities of zinc fingers with DNA microarrays. Proc Natl Acad Sci USA 98: 7158–7163 [DOI] [PMC free article] [PubMed] [Google Scholar]
- Cherry JM, Adler C, Ball C, Chervitz SA, Dwight SS, Hester ET, Jia Y, Juvik G, Roe T, Schroeder M, Weng S, Botstein D (1998) SGD: Saccharomyces Genome Database. Nucleic Acids Res 26: 73–79 [DOI] [PMC free article] [PubMed] [Google Scholar]
- Chua G, Morris QD, Sopko R, Robinson MD, Ryan O, Chan ET, Frey BJ, Andrews BJ, Boone C, Hughes TR (2006) Identifying transcription factor functions and targets by phenotypic activation. Proc Natl Acad Sci U S A 103: 12045–12050 [DOI] [PMC free article] [PubMed] [Google Scholar]
- Cole SW, Yan W, Galic Z, Arevalo J, Zack JA (2005) Expression-based monitoring of transcription factor activity: the TELiS database. Bioinformatics 21: 803–810 [DOI] [PubMed] [Google Scholar]
- Conlon EM, Liu XS, Lieb JD, Liu JS (2003) Integrating regulatory motif discovery and genome-wide expression analysis. Proc Natl Acad Sci USA 100: 3339–3344 [DOI] [PMC free article] [PubMed] [Google Scholar]
- De Vit MJ, Waddle JA, Johnston M (1997) Regulated nuclear translocation of the Mig1 glucose repressor. Mol Biol Cell 8: 1603–1618 [DOI] [PMC free article] [PubMed] [Google Scholar]
- Gao F, Foat BC, Bussemaker HJ (2004) Defining transcriptional networks through integrative modeling of mRNA expression and transcription factor binding data. BMC Bioinform 5: 31. [DOI] [PMC free article] [PubMed] [Google Scholar]
- Gasch AP, Spellman PT, Kao CM, Carmel-Harel O, Eisen MB, Storz G, Botstein D, Brown PO (2000) Genomic expression programs in the response of yeast cells to environmental changes. Mol Biol Cell 11: 4241–4257 [DOI] [PMC free article] [PubMed] [Google Scholar]
- Harbison CT, Gordon DB, Lee TI, Rinaldi NJ, Macisaac KD, Danford TW, Hannett NM, Tagne JB, Reynolds DB, Yoo J, Jennings EG, Zeitlinger J, Pokholok DK, Kellis M, Rolfe PA, Takusagawa KT, Lander ES, Gifford DK, Fraenkel E, Young RA (2004) Transcriptional regulatory code of a eukaryotic genome. Nature 431: 99–104 [DOI] [PMC free article] [PubMed] [Google Scholar]
- Hartemink A, Gifford D, Jaakkola T, Young R (2001) Using graphical models and genomic expression data to statistically validate models of genetic regulatory networks. Pac Symp Biocomput 422–433 [DOI] [PubMed] [Google Scholar]
- Hartemink A, Gifford D, Jaakkola T, Young R (2002) Combining location and expression data for principled discovery of genetic regulatory network models. Pac Symp Biocomput 437–449 [PubMed] [Google Scholar]
- Holloway DT, Kon M, DeLisi C (2005) Integrating genomic data to predict transcription factor binding. Genome Inform 16: 83–94 [PubMed] [Google Scholar]
- Hughes JD, Estep PW, Tavazoie S, Church GM (2000a) Computational identification of cis-regulatory elements associated with groups of functionally related genes in Saccharomyces cerevisiae. J Mol Biol 296: 1205–1214 [DOI] [PubMed] [Google Scholar]
- Hughes TR, Marton MJ, Jones AR, Roberts CJ, Stoughton R, Armour CD, Bennett HA, Coffey E, Dai H, He YD, Kidd MJ, King AM, Meyer MR, Slade D, Lum PY, Stepaniants SB, Shoemaker DD, Gachotte D, Chakraburtty K, Simon J, Bard J, Friend SH (2000b) Functional discovery via a compendium of expression profiles. Cell 102: 109–126 [DOI] [PubMed] [Google Scholar]
- Ihmels J, Bergmann S, Barkai N (2004) Defining transcription modules using large-scale gene expression data. Bioinformatics 20: 1993–2003 [DOI] [PubMed] [Google Scholar]
- Iyer VR, Horak CE, Scafe CS, Botstein D, Snyder M, Brown PO (2001) Genomic binding sites of the yeast cell-cycle transcription factors SBF and MBF. Nature 409: 533–538 [DOI] [PubMed] [Google Scholar]
- Kim H, Hu W, Kluger Y (2006) Unraveling condition specific gene transcriptional regulatory networks in Saccharomyces cerevisiae. BMC Bioinform 7: 165. [DOI] [PMC free article] [PubMed] [Google Scholar]
- Lee T, Rinaldi N, Robert R, Odom D, Bar-Joseph Z, Gerber G, Hannett N, Harbison C, Thompson C, Simon I, Zeitlinger J, Jennings E, Murray H, Gordon D, Ren B, Wyrick J, Tagne J, Volkert T, Fraenkel E, Gifford D, Young RA (2002) Transcriptional regulatory networks in Saccharomyces cerevisiae. Science 298: 799–804 [DOI] [PubMed] [Google Scholar]
- Lieb JD, Liu X, Botstein D, Brown PO (2001) Promoter-specific binding of Rap1 revealed by genome-wide maps of protein-DNA association. Nat Genet 28: 327–334 [DOI] [PubMed] [Google Scholar]
- Lutfiyya LL, Iyer VR, DeRisi J, DeVit MJ, Brown PO, Johnston M (1998) Characterization of three related glucose repressors and genes they regulate in Saccharomyces cerevisiae. Genetics 150: 1377–1391 [DOI] [PMC free article] [PubMed] [Google Scholar]
- Marion RM, Regev A, Segal E, Barash Y, Koller D, Friedman N, O'Shea EK (2004) Sfp1 is a stress- and nutrient-sensitive regulator of ribosomal protein gene expression. Proc Natl Acad Sci USA 101: 14315–14322 [DOI] [PMC free article] [PubMed] [Google Scholar]
- Mewes H, Frishman D, Guldener U, Mannhaupt G, Mayer K, Mokrejs M, Morgenstern B, Munsterkotter M, Rudd S, Weil B (2002) MIPS: a database for genomes and protein sequences. Nucleic Acids Res 30: 31–34 [DOI] [PMC free article] [PubMed] [Google Scholar]
- Mnaimneh S, Davierwala AP, Haynes J, Moffat J, Peng WT, Zhang W, Yang X, Pootoolal J, Chua G, Lopez A, Trochesset M, Morse D, Krogan NJ, Hiley SL, Li Z, Morris Q, Grigull J, Mitsakakis N, Roberts CJ, Greenblatt JF, Boone C, Kaiser CA, Andrews BJ, Hughes TR (2004) Exploration of essential gene functions via titratable promoter alleles. Cell 118: 31–44 [DOI] [PubMed] [Google Scholar]
- Mukherjee S, Berger MF, Jona G, Wang XS, Muzzey D, Snyder M, Young RA, Bulyk ML (2004) Rapid analysis of the DNA binding specificities of transcription factors with DNA microarrays. Nat Genet 36: 1331–1339 [DOI] [PMC free article] [PubMed] [Google Scholar]
- Philippakis A, Busser B, Gisselbrecht S, He F, Estrada B, Michelson A, Bulyk M (2006) Expression-guided in silico evaluation of candidate cis regulatory codes for the Drosophila muscle founder cell. PLoS Comput Biol 2: 439–453 [DOI] [PMC free article] [PubMed] [Google Scholar]
- Poyton RO, McEwen JE (1996) Crosstalk between nuclear and mitochondrial genomes. Annu Rev Biochem 65: 563–607 [DOI] [PubMed] [Google Scholar]
- Reid JL, Iyer VR, Brown PO, Struhl K (2000) Coordinate regulation of yeast ribosomal protein genes is associated with targeted recruitment of Esa1 histone acetylase. Mol Cell 6: 1297–1307 [DOI] [PubMed] [Google Scholar]
- Ren B, Robert F, Wyrick JJ, Aparicio O, Jennings EG, Simon I, Zeitlinger J, Schreiber J, Hannett N, Kanin E, Volkert TL, Wilson CJ, Bell SP, Young RA (2000) Genome-wide location and function of DNA binding proteins. Science 290: 2306–2309 [DOI] [PubMed] [Google Scholar]
- Stark C, Breitkreutz BJ, Reguly T, Boucher L, Breitkreutz A, Tyers M (2006) BioGRID: a general repository for interaction datasets. Nucleic Acids Res 34: D535–539 [DOI] [PMC free article] [PubMed] [Google Scholar]
- Tanay A (2006) Extensive low-affinity transcriptional interactions in the yeast genome. Genome Res 16: 962–972 [DOI] [PMC free article] [PubMed] [Google Scholar]
- Tavazoie S, Hughes J, Campbell M, Cho R, Church G (1999) Systematic determination of genetic network architecture. Nat Genet 22: 281–285 [DOI] [PubMed] [Google Scholar]
Associated Data
This section collects any data citations, data availability statements, or supplementary materials included in this article.
Supplementary Materials
Supplementary Figure 1
Supplementary Figure 2
Supplementary Figure 3
Supplementary Figure 4
Supplementary Figure 5
Supplementary Figure 6
Supplementary Table 1
Supplementary Data 1
Supplementary Data 2
Supplementary Data 3