

Abstract
The synthesis and characterization of four low-spin (carbonyl)iron(II) tetraphenylporphyrinates, [Fe(TPP)(CO)(L)], where L = 1-methylimidazole, 2-methylimidazole, 1,2-dimethylimidazole (unsolvated) and 1,2-dimethylimidazole (toluene solvate) are reported. The complexes show nearly the same value of νC–O in toluene solution (1969–72 cm−1) but a large range of CO stretching frequencies in the solid-state (1926–1968 cm−1). The large solid-state variation results from CO interactions in the solid-state as shown by an examination of the crystal structures of the four complexes. The high precision of the four structures obtained allows us to make a number of structural and spectroscopic correlations that describe the Fe–C–O and NIm–Fe–CO units. The values of νC–O and the Fe–C and C–O bond distances are strongly correlated and provide a structural as well as a spectroscopic correlation of the π back-bonding model. The interactions of CO described are closely related to the large range of CO stretching frequencies observed in heme proteins and specific interactions observed in carbonylmyoglobin (MbCO).
Introduction
Studies involving the carbonyl (CO)1 ligand have had a profound influence in both classical inorganic and organometallic chemistry, and bioinorganic chemistry systems, such as the iron porphyrinate (heme) carbonyls. The carbonyl ligand has been used to probe the nature of metal–ligand bonding and to provide information on the nature of the environment of prosthetic groups in proteins. For inorganic carbonyl derivatives, it has long been noted that there is a relationship between the strength of the metal–carbon bond and that of the carbon–oxygen bond.2 The overall bonding interaction is that any feature that leads to strengthening the C–O bond concomitantly leads to a weakening of the metal–carbon bond. This is the basis of the so-called π-back-bonding model that is widely applied as a general model for bonding in complexes with π-acceptor (π-acid) ligands. This correlation has been extensively studied by vibrational spectroscopy; the trends observed in isoelectronic series of carbonyl species are a well-known phenomenon.3 In heme carbonyl derivatives, trends in the Fe–C–O unit vibrations have long been established and are known as the “inverse correlation” of the iron–carbon stretching frequency (νFe–CO) and the carbon–oxygen stretching frequency (νC–O).4, 5 An increase in the Fe–C bond order is seen to lead to a decrease in the C–O bond order.
Vibrational spectroscopy has been used since the inception of bioinorganic chemistry to study protein active sites. Vibrational spectroscopic techniques such as infrared (IR),6 resonance Raman (rR),7 and nuclear resonance vibrational spectroscopy (NRVS),8 allow the use of diatomic probe ligands to study bonding and the environment near the binding site in metal containing proteins.
The diatomic ligands CO, CN–, NO, and O2 all display ligand stretches that can be observed with vibrational techniques and have been extensively employed in the study of hemes and heme proteins.7-13 The CO ligand has a high affinity for iron(II) hemes9,14-17 and νC–O is conveniently observed.13 Consequently, CO has been widely used as a probe ligand to detect vacant coordination sites in reduced heme proteins. Carbon monoxide is also an interesting biomolecule that is a product of heme catabolism. Accordingly, the background body burden of CO is relatively high.18 Since CO has a higher binding constant than that of dioxygen, this natural CO level is potentially toxic. Nature has solved the toxicity problem by designing factors into the heme proteins hemoglobin (Hb) and myoglobin (Mb) so that their CO affinity is reduced by approximately two orders of magnitude compared to that of analogous iron(II) porphyrinates.19, 20
The origin of the molecular basis of the differences (selectivity) in the O2 and CO affinities between the heme proteins and low-molecular-weight hemes has been an intensively studied problem in bioinorganic chemistry. An early prominent idea was that the environment of the protein ligand binding pocket somehow imposes constraints on the Fe–C–O unit, but not on the Fe–O–O unit. There has been much discussion about possible geometric constraints of the Fe–C–O unit in MbCO.10, 21-25 Although a number of protein crystal structures have supported a rather bent Fe–C–O unit26-29 more recent results do not.30, 31 Additionally, polarized IR photoselection measurements on Mb single crystals and in solution support an only slightly bent Fe–C–O unit.24,25 The original idea of geometric constraints imposed by the protein has largely shifted to investigations of the global (electrostatic) environment near the CO binding site.23 CO has been widely used to investigate the specific and global (electrostatic) environment.
The heme proteins myoglobin and hemoglobin have been amongst the most studied CO-ligated proteins. In the CO derivatives of native Mb and Hb, up to four distinct CO stretching frequencies can be observed.32, 33 These bands have been designated A0, A1, A2, and A3 in Mb. This range of frequencies have been attributed to varying conformational and subsequently, electrostatic environments in the heme pocket.34-36 A complete understanding of these bands is of interest since they provide information about the relationship of conformational substates with functional states of the protein.23-29, 69 A large number of mutation studies have been dedicated to understanding the multiple peak phenomenon, differing environments and substrate selectivity (CO vs O2) in myoglobin.14,37 These investigations have demonstrated that CO frequency changes can be the result of very specific interactions with ligand pocket residues or the general electrostatic environment of the pocket or both.
In this paper we present the synthesis, spectroscopic, and structural studies for four new carbonyl(iron(II)) tetraphenylporphyrinates, each with an imidazole as the sixth ligand. The complexes are of the form [Fe(TPP)(CO)(L)], where L is 2-methylimidazole, 1,2-dimethylimidazole (two crystalline forms), or 1-methylimidazole. The crystals of all four compounds are of extremely high quality and allowed the determination of the structural parameters at very high levels of accuracy. Although the species show nearly identical CO stretching frequencies in solution, the crystalline species show a wide range of νC–O values. The variation in the solid-state νC–O values have been examined in light of the differing crystalline environments. These provide information on the nature of some of the environmental effects that can lead to shifts in νC–O. These compounds also provide additional, quantitative data on classical carbonyl–metal π-bonding. There are differences in both the Fe–C and C–O bond lengths in the four compounds. Although the differences are relatively small, the structure determinations show that there is a strong correlation between the two distances that follows the indirect correlation, i.e., an increase in the Fe–C distance leads to a decrease in the C–O distance. The observed structural correlation appears to be consistent with other carbonyl species whose structural data was determined with lower accuracy and precision.
Experimental Section
General Information
All reactions were carried out under strictly anaerobic conditions using standard Schlenk techniques under an argon atmosphere. Ethanethiol and 1-methylimidazole were used as received (Acros). 2-Methylimidazole (Aldrich) was recrystallized from acetone prior to use. 1,2-Dimethylimidazole (Aldrich) was recrystallized from ethyl ether prior to use. Carbon monoxide gas was used as received (Mittler Specialty Gases). Benzene and toluene (Fisher) were purified by distillation in a nitrogen atmosphere over sodium/benzophenone ketyl. All solvents were freeze/pump/thaw degassed (thrice) prior to use. Free base [H2TPP] was prepared according to Adler et al.38 [Fe(TPP)(Cl)] was prepared according to the metallation procedure of Adler et al.39 [Fe(TPP)]2O was prepared by washing a solution of [Fe(TPP)Cl] in methylene chloride with 2 M aqueous sodium hydroxide solution (3×), drying the collected organic layers over magnesium sulfate followed by recrystallization from methylene chloride/hexanes.40 [Fe(TPP)] was prepared by stirring a solution of [Fe(TPP)]2O and excess ethanethiol in benzene for 2 d.41 After reduction, solvent and excess ethanethiol were removed under vacuum.
Infrared spectra were recorded on a Nicolet Nexus 870 FT-IR spectrometer. Solid state infrared samples were prepared by gently mulling a suitable crystal between two NaCl plates with a small amount of Nujol to allow dispersion. Solution infrared samples were prepared by bubbling CO into a solution of 4 mM Fe(TPP) and 1–2 M imidazole in toluene. Samples were prepared for Mössbauer spectroscopy by weighing approximately 40 mg of selected crystals, grinding them in a small volume of Apiezon M grease to form a mull and placing them into a Mössbauer cup. Measurements were performed on a constant acceleration spectrometer from 15 K to 300 K.
Synthesis of [Fe(TPP)(CO)(1,2-Me2Im)]·C7H8
A solution of 29 mg (0.30 mmol) 1,2-dimethylimidazole, in 6 mL of toluene, was introduced to dry [Fe(TPP)] (0.04 mmol) via cannula transfer and stirred for 1 h. The reaction solution was then purged with CO for 30 min and stirred overnight under a CO atmosphere. The solution was then cannula transferred into 7 mm glass tubes, carefully layered with hexanes and the tubes were flame sealed. X-ray quality crystals of [Fe(TPP)(CO)(1,2-Me2Im)]·C7H8 were isolated after 48 h at 4 °C. IR νCO in KBr: 1953 and 1948 cm−1.
Synthesis of [Fe(TPP)(CO)(2-MeHIm)]·C7H8
A solution of 35 mg (0.40 mmol) 2-methylimidazole, in 6 mL of toluene, was introduced to dry [Fe(TPP)] (0.05 mmol) via cannula transfer and stirred for 1 h. The reaction solution was then purged with CO for 30 min and stirred overnight under a CO atmosphere. The solution was then cannula transferred into 7 mm glass tubes, carefully layered with hexanes and the tubes were flame sealed. X-ray quality crystals of [Fe(TPP)(CO)(2-MeHIm)]·C7H8 were isolated after 48 h at 4 °C. IR νCO in KBr: 1926 cm−1.
Synthesis of [Fe(TPP)(CO)(1,2-Me2Im)]
A solution of 52 mg (0.53 mmol) 1,2-dimethylimidazole in 5 mL of toluene, was introduced to dry [Fe(TPP)] (0.13 mmol) via cannula transfer and stirred for 1 h. The reaction solution was then purged with CO for 30 min and stirred overnight under a CO atmosphere. The solution was then cannula transferred into 8 mm glass tubes, carefully layered with hexanes and the tubes were flame sealed. X-ray quality crystals of [Fe(TPP)(CO)(1,2-Me2Im)] were isolated after 25 d at 25°C. IR νCO in KBr: 1963 cm−1.
Synthesis of [Fe(TPP)(CO)(1-MeIm)]·C6H6
A solution of 0.08 mL (0.94 mmol) 1-methylimidazole, in 15 mL of benzene, was introduced to dry [Fe(TPP)] (0.26 mmol) via cannula transfer and stirred for 1 h. The reaction solution was then purged with CO for 30 min and stirred overnight under a CO atmosphere. The solution was then cannula transferred into 8 mm glass tubes, carefully layered with hexanes and the tubes were flame sealed. X-ray quality crystals of [Fe(TPP)(CO)(1-MeIm)]·C6H6 were isolated after 25 d at 25 °C. IRν CO in KBr: 1968 cm−1.
X-Ray Crystallographic Studies
All crystals were placed in inert oil, mounted on a glass pin, and transferred to the cold gas stream of the diffractometer. Crystal data were collected and integrated using a Bruker Apex system, with graphite monochromated Mo-Kα (λ= 0.71073 Å) radiation at 100 K (700 Series Oxford Cryostream) for all complexes. All data were collected to 2θmax ≥ 65° with the exception of [Fe(TPP)(CO)(1,2-Me2Im)] (2θmax = 56.5°). The program SADABS42 was applied for absorption corrections.
The structures of [Fe(TPP)(CO)(1-MeIm)]·C6H6 and [Fe(TPP)(CO)(1,2-Me2Im)] were solved by direct methods in SHELXS-97,43 while the structures of [Fe(TPP)(CO)(1,2-Me2Im)]·C7H8 and [Fe(TPP)(CO)(2-MeHIm)]·C7H8 were solved using the Patterson method in SHELXS-97.44 All structures were refined using SHELXL-97.45 All nonsolvent atoms were found after successive full-matrix least-squares refinement cycles on F2 and refined with anisotropic thermal parameters. Solvent molecule atoms were refined anisotropically when possible. Hydrogen atom positions were idealized with a riding model and fixed thermal parameters [Uij = 1.2Uij(eq) or 1.5Uij(eq)] for the atom to which they are bonded with the exception of N–H hydrogen in [Fe(TPP)(CO)(2-MeHIm)]·C7H8 and the hydrogens of the 2-methyl group in [Fe(TPP)(CO)(1,2-Me2Im)]·C7H8. These four hydrogen atoms were found in difference Fourier maps and their positions and temperature factors were refined in successive full-matrix least-squares refinements.
Complete crystallographic details are given in the Supporting Information and are summarized in Table S1. The required twofold symmetry imposed on [Fe(TPP)(CO)(1,2-Me2Im)] leads to a linear Fe–C–O bond angle and two separate orientations (equally occupied) of the 1,2-dimethylimidazole described with the Fe–NIm bond tilted off the twofold. A rigid group approximation was used to fully resolve the two distinct orientations of the ring. The rigid group orthogonal coordinates can be found in Table S26 in the Supporting Information. [Fe(TPP)(CO)(1,2-Me2Im)]·C7H8 also contains a disordered 1,2-dimethylimidazole over two positions. These were refined as two rigid imidazole rings, which were found to have relative occupancies of 62% for the major position and 38% for the minor position and unequal axial Fe–N distances.46
Results
The crystal and molecular structures of four six-coordinate CO iron(II) porphyrinates have been obtained. The structures of [Fe(TPP)(CO)(1,2-Me2Im)], [Fe(TPP)(CO)(1,2-Me2Im)]·C7H8, and [Fe(TPP)(CO)(2-MeHIm)]·C7H8, all with sterically hindered imidazoles, have not previously been reported. We also report the structure of a benzene solvated form of [Fe(TPP)(CO)(1-MeIm)] that has been previously isolated as a toluene solvate.47,48
Crystallographic details for all four structures are summarized in Table S1. ORTEP diagrams of [Fe(TPP)(CO)(1,2-Me2Im)]·C7H8 and [Fe(TPP)(CO)(2-MeHIm)]·C7H8 are illustrated in Figure 1. The side-on view of these porphyrinates give a distinct perspective of not only the porphyrin core conformation, but also the tilting of the Fe–NIm bond off the heme normal. The dihedral angles between the 24-atom porphyrin plane and the imidazole plane is 85° (for both orientations) and 82° respectively. The ORTEP diagram for [Fe(TPP)(CO)(1,2-Me2Im)] is shown in Figure 2. The side-on view illustrates the linear Fe–C–O group and symmetric disorder of the axial ligand that is required by crystallographically imposed twofold symmetry. The dihedral angle between the 24-atom plane of the porphyrin and the plane of the imidazole is 90° (symmetry imposed). The ORTEP diagram for [Fe(TPP)(CO)(1-MeIm)]·C7H8 is shown in Figure 3. This diagram illustrates the near linearity of the Fe–C–O and C–Fe–NIm angles. The dihedral angle between the 24-atom plane of the porphyrin and the plane of the imidazole is 83°.
Figure 1.
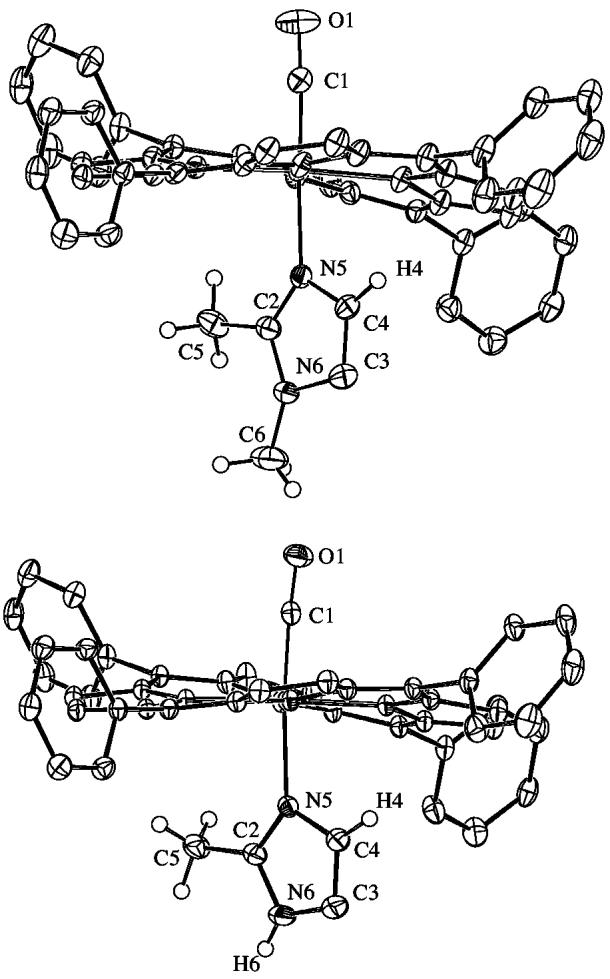
ORTEP diagrams (50% probability ellipsoids) of (top) [Fe(TPP)(CO)(1,2-Me2Im)]·C7H8 (only the major orientation of imidazole shown) and (bottom) [Fe(TPP)(CO)(2-MeHIm)]·C7H8. Significant hydrogen atoms are displayed; all other hydrogen atoms are omitted for clarity. Note the tilt of Fe–NIm off the heme normal and the near linearity of the Fe–C–O group.
Figure 2.
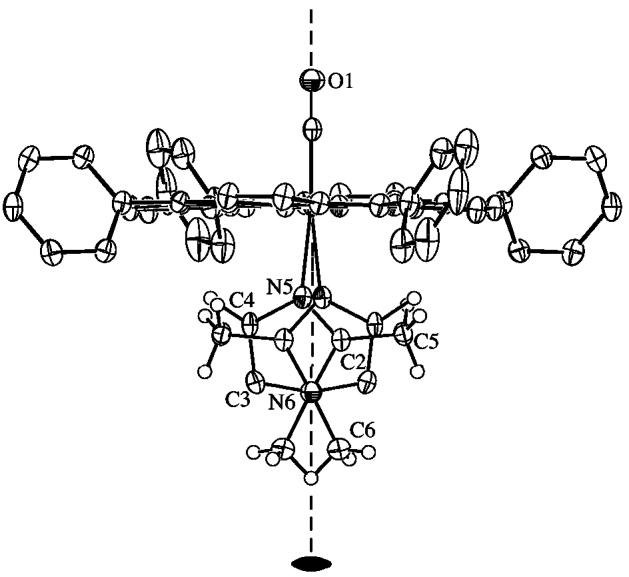
ORTEP diagram (50% probability ellipsoids) of [Fe(TPP)(CO)(1,2-Me2Im)]. Significant hydrogen atoms are displayed, all other hydrogen atoms are omitted for clarity. This diagram illustrates the linearity of the Fe–C–O group imposed by the twofold symmetry. The twofold disordered 1,2-Me2Im ligand is shown.
Figure 3.
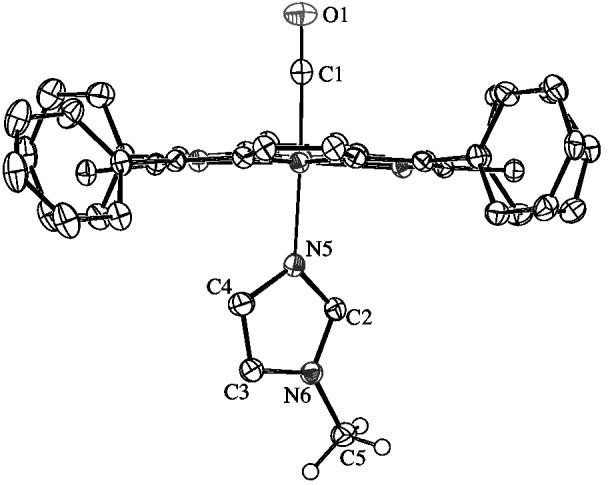
ORTEP diagram (50% probability ellipsoids) of [Fe(TPP)(CO)(1-MeIm)]·C6H6. Significant hydrogen atoms are displayed, all other hydrogen atoms are omitted for clarity.
Formal diagrams of atom displacements from the 24-atom mean planes of [Fe(TPP)(CO)(1,2-Me2Im)]·C7H8 and [Fe(TPP)(CO)(2-MeHIm)]·C7H8 are given in Figure S1. In these and subsequent formal diagrams, the position of the imidazole methyl group at the 2-carbon position is indicated by the small circle and the average Fe–Npyrrole distances are displayed. The relative orientation of the axial imidazole ligand is shown as a projection onto the core. Positive displacements are toward the CO. The angle between the imidazole plane and the nearest Np–Fe–Np for [Fe(TPP)(CO)(1,2-Me2Im)]·C7H8 and [Fe(TPP)(CO)(2-MeHIm)]·C7H8 is approximately 45°. The two imidazole orientations are also shown.
Formal diagrams of [Fe(TPP)(CO)(1-MeIm)]·C6H6 and [Fe(TPP)(CO)(1,2-Me2Im)] showing atom displacements from the 24-atom mean plane are illustrated in Figure S3 and Figure S2, respectively. The formal diagrams illustrate the angle between the imidazole plane and the nearest Np–Fe–Np for both of these structures is approximately 30°. The two equally occupied imidazole orientations can also be observed.
Carbonyl stretching frequencies and notable structural features for these and related structures have been investigated. The νC–O's reported for the four new structures vary from 1972 to 1926 cm−1. Mössbauer spectra were collected at 15–300 K in zero field for [Fe(TPP)(CO)(1,2-Me2Im)] and [Fe(TPP)(CO)(1-MeIm)].
Discussion
Synthetic Aspects
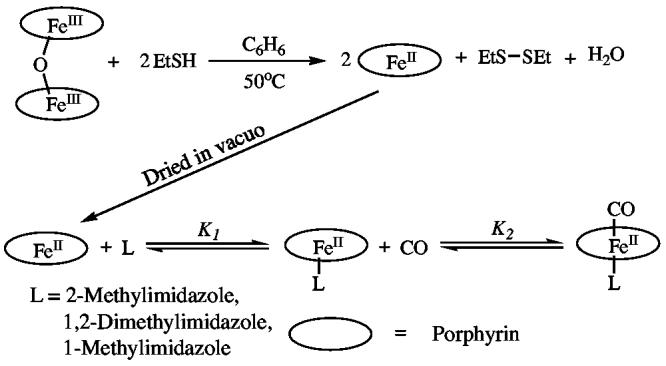
The synthetic steps in preparing six-coordinate carbonyl iron(II) porphyrins are illustrated in Scheme 1. All reactions must be carried out under strict anaerobic conditions. While the synthesis of carbonyl iron(II) porphyrin complexes with unhindered imidazoles is straightforward, the synthesis of iron(II) carbonyl porphyrinates with hindered imidazoles is surprisingly difficult due to their reduced affinity for CO. Although the values of K1, as illustrated in Scheme 1, for hindered and unhindered imidazoles are nearly equal, the CO binding constants (K2) are substantially different.16 Rougee and Brault report a 200-fold decrease in the CO binding constant when the trans ligand is a hindered imidazole compared to unhindered imidazole. This binding constant difference is such that rapid crystallization of carbonyl products yields a mixture. Thus, both the six-coordinate CO-ligated derivative and the five-coordinate imidazole-ligated species cocrystallize when the trans ligand is a hindered imidazole. This is not the case with unhindered imidazole derivatives. Thus, the isolation of the pure hindered imidazole derivatives, [Fe(TPP)(CO)(L)], is possible only by preparing and harvesting single crystals.
Scheme 1.
Molecular Structures
We report the molecular structures of four six-coordinate iron(II) carbonyl complexes determined at high resolution and high accuracy that allow us to make strong structural and spectroscopic correlations. These correlations will be given in subsequent sections.
Bond lengths and angles with uncertainties for the LIm–Fe–C–O coordination group for these four new structures and, for comparison, all known heme carbonyl structures are given in Table 1. The Fe–C–O angle in these new derivatives deviate only slightly from precise linearity. Values for [Fe(TPP)(CO)(1,2-Me2Im)]·C7H8, [Fe(TPP)(CO)(2-MeHIm)]·C7H8 and [Fe(TPP)(CO)(1-MeIm)]·C6H6 are 175.9°, 176.0°, and 177.0°, respectively, while that for [Fe(TPP)(1,2-Me2Im)] is 180° as required by the imposed twofold axis. The Fe–C–O tilt for [Fe(TPP)(1,2-Me2Im)], [Fe(TPP)(CO)(1,2-Me2Im)]·C7H8, [Fe(TPP)(CO)(2-MeHIm)]·C7H8 and [Fe(TPP)(CO)(1-MeIm)]·C6H6, defined as the angle between the Fe–C vector and the heme normal, are 0°, 4.2°, 1.1°, and 1.0°, respectively.
Table 1.
Carbonyl stretching frequencies and notable structural features for [Fe(TPP)(CO)(1,2-Me2Im)]·C7H8, [Fe(TPP)(CO)(2-MeHIm)]·C7H8, [Fe(TPP)(CO)(1,2-Me2Im)] and [Fe(TPP)(CO)(1-MeIm)]·C6H6 and related compounds.
| Fe–Ca | Fe–C–Ob | Fe–Laxa | C–Fe–Laxb | C–Oa | νC–Oc | νC–Oc | ref | |
|---|---|---|---|---|---|---|---|---|
| [Fe(TPP)(CO)(2-MeHIm)]·C7H8 | 1.7410(14) | 175.96(13) | 2.1018(12) | 175.42(5) | 1.1488(17) | 1926d | tw | |
| [Fe(TPP)(CO)(2-MeHIm)] | 1972e | tw | ||||||
| [Fe(TPP)(CO)(1,2-Me2Im)]·C7H8 | 1.7537(15) | 175.95(14) | 2.0779(11) | 176.77(6) | 1.1408(19) | 1948, 1953d | tw | |
| [Fe(TPP)(CO)(1,2-Me2Im)]·C7H8f | 2.1402(18) | 168.73(8) | 1948, 1953d | tw | ||||
| [Fe(TPP)(CO)(1,2-Me2Im)] | 1.764(2) | 180g | 2.133(2) | 173.85(9) | 1.138(3) | 1963d | tw | |
| [Fe(TPP)(CO)(1,2-Me2Im)] | 1972e | 54, tw | ||||||
| [Fe(TPP)(CO)(1-MeIm)]·C6H6 | 1.7600(17) | 177.03(15) | 2.0503(14) | 176.78(6) | 1.139(2) | 1968d | tw | |
| [Fe(TPP)(CO)(1-MeIm)]·C7H8 | 1.793(3) | 179.3(3) | 2.071(2) | 178.3(3) | 1.061(3) | 1969h | 47 | |
| [Fe(TPP)(CO)(1-MeIm)]·2.5C7H8 | 1.7636(13) | 178.76(13) | 2.0400(11) | 178.38(5) | 1.1437(17) | 1967d | 48 | |
| [Fe(TPP)(CO)(1-MeIm)] | 1969i | tw | ||||||
| [Fe(C2Cap)(CO)(1-MeIm)] | 1.742(7) | 172.9(6) | 2.043(6) | 174.7(3) | 1.161(8) | 2000d | 52 | |
| [Fe(C2Cap)(CO)(1-MeIm)] | 1.748(7) | 175.9(6) | 2.041(5) | 177.8(3) | 1.158(8) | 2000d | 52 | |
| [Fe(OC3OPor)(CO)(1-MeIm)]·1.5C7H8 | 1.748(7) | 173.9(7) | 2.027(5) | 174.5(3) | 1.171(8) | 1978d | 53 | |
| [Fe(OC3OPor)(CO)(1,2-Me2Im)]·2CHCl3 | 1.713(8) | 180g | 2.102(6) | 173.0(2) | 1.161(10) | 1974d | 53 | |
| [Fe(Tpiv2C12P)(CO)(1-MeIm)] | 1.728(6) | 180g | 2.062(5) | 180g | 1.149(6) | 1958i | 55 | |
| [Fe(TpivPP)(CO)(1-MeIm)] | 1965i | 56,19 | ||||||
| [Fe(OEP)(CO)(1-MeIm)] | 1.744(5) | 175.1(4) | 2.077(3) | 176.8(2) | 1.158(5) | 1965h | 57 | |
| [Fe(C3Cap)(CO)(1,2-Me2Im)] | 1.800(13) | 178.0(13) | 2.046(10) | 178.9(5) | 1.107(13) | 1984e | 58 | |
| [Fe(C3Cap)(CO)(1,2-Me2Im)] | 1984j | 54 | ||||||
| [Fe(C2Cap)(CO)(1,2-Me2Im)] | 1999j | 54 | ||||||
| [Fe(β-PocPivP)(CO)(1,2-Me2Im)] | 1.768(7) | 172.5(6) | 2.079(5) | 176.3(3) | 1.148(7) | 59 | ||
| [Fe(TPP)(CO)(Py)] | 1.77(2) | 179(2) | 2.10(1) | 177.5(8) | 1.12(2) | 1980k | 60 | |
| [Fe(OEP)(CO)(Py)] | 1967 | 61 | ||||||
| [Fe(Deut)(CO)(THF)] | 1.706(5) | 178.3(14) | 2.127(4) | 177.4(9) | 1.144(5) | 1955l | 62 | |
| [Fe(TPP)(CO)(THF)] | 1955k | 62 | ||||||
| [Fe(TpivPP)(CO)(THF)] | 1961k | 63 | ||||||
| [Fe(TPP)(CO)(SEt)] | 1.78(1) | 2.352(2) | 1.17(1) | 1920m | 64 | |||
| [Fe(TpivPP)(CO)(THT)] | 1970i | 63 | ||||||
| HbCO | 1951n | 13 | ||||||
| MbCO | 1933n | 34 | ||||||
| 1945n | 34 | |||||||
| 1967n | 34 |
Å
degrees.
cm−1.
Nujol mull.
toluene solution saturated with base.
second conformation of the 1,2-Me2Im is approximately 38% occupied.
symmetry imposed linearity.
CDCl2 solution.
benzene solution.
toluene solution.
Pyridine solution.
tetrahydrofuran solution.
chlorobenzene solution.
aqueous solution.
The presence of the hindering α-methyl group in the 2-methyl- or 1,2-dimethyl-substituted imidazoles leads to a modest off-axis tilt of the Fe–N bond from the heme plane normal. Values are 6.2° for [Fe(TPP)(1,2-Me2Im)], 7.5 and 7.6° for [Fe(TPP)(CO)(1,2-Me2Im)]·C7H8, 3.7° for [Fe(TPP)(CO)(2-MeHIm)]·C7H8, and 3.4° for [Fe(TPP)(CO)(1-MeIm)]·C6H6. A larger effect is the unequal Fe–N–C angles; the Fe–N–C angles for the carbon bearing the methyl group are ∼10.5 degrees larger than that of the unsubstituted carbon (132.3°; (average) compared to 121.8°). This pattern is common to all known iron derivatives coordinated to hindered imidazoles.65,66 Interestingly, the relative orientations of the two axial tilts are such that the axial NIm–Fe–C angles have values close to 180°. The hindered imidazole ligand also leads to some elongation of the Fe–NIm bond compared to analogous derivatives with unhindered imidazoles. There appears to be some variation in this axial bond length even with the same ligand, consequently we can only estimate the elongation effect as ≥ ∼0.04 Å.
However, the Fe–N bond distances trans to Fe–C(CO) are relatively long in all of the carbonyl complexes. The Fe–N(1-MeIm) distances are found to be ∼2.04 Å for the [Fe(Por)(CO)(1-MeIm)] complexes (Table 1) and the analogous distance for derivatives with hindered imidazoles longer still. Estimates of the magnitude of the increase in Fe–N(L) can be determined by comparison with a series of bis-ligated six-coordinate iron(II) porphyrinate complexes bonded to imidazole ligands.67 The bis-imidazole complexes67 display axial Fe–N(L) bonds ranging from 2.004(2) Å to 2.017(4) Å, a lengthening of ≥∼0.03 Å is thus inferred. The bond lengthening is somewhat smaller than that observed for the thiocarbonyliron(II) porphyrinates where a lengthening of about 0.10 Å was inferred68 or that in iron(II) nitrosyl porphyrinates where the Fe–N(L) distances of the ligand trans to nitrosyl is lengthened by > 0.2 Å.69-71 The carbonyl ligand thus has a significant structural trans effect, but one that is smaller than those seen in a number of other diatomic ligands coordinated to iron(II) porphyrinates.
The four molecules whose structures are reported here all have nonplanar porphyrin core conformations. Detailed formal diagrams of the displacements of each atom from the mean plane of the 24-atom core are displayed in Figures S1, S2, and S3 of the Supporting Information.
The toluene solvates of [Fe(TPP)(CO)(1,2-Me2Im)] and [Fe(TPP)(CO)(2-MeHIm)] have nearly identical (ruffled) core conformations as can be seen in Figure S1. Indeed, crystals of the two molecules are isomorphous and the molecular structures are nearly indistinguishable with the exception of small differences in the axial ligands. This is shown in the overlay diagram of Figure 4. The overlay diagram was constructed as described in the Figure caption. The largest difference is in the position of the CO oxygen atoms that are 0.384 Å apart.
Figure 4.
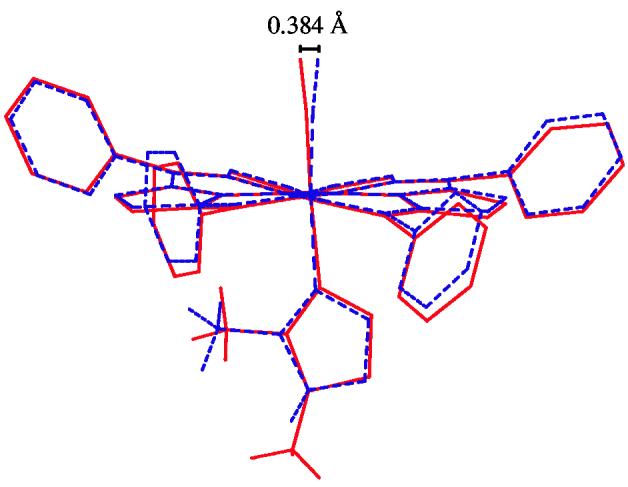
An overlay diagram showing the structures of [Fe(TPP)(CO)(1,2-Me2Im)]·C7H8(—) and [Fe(TPP)(CO)(2-MeHIm)]·C7H8(- - -). These structures were fit by superimposing the four pyrrole nitrogens and orientated so the mean plane of these nitrogens are perpendicular to the page. The molecules can be seen to have nearly identical core and phenyl ring conformations. The CO oxygens are separated by 0.384 Å.
The ruffled cores in [Fe(TPP)(CO)(1,2-Me2Im)]·C7H8 and [Fe(TPP)(CO)(2-MeHIm)]·C7H8 are the result of the imidazole orientation. The projection of the imidazole plane on the porphyrin core is approximately 45° from the nearest Fe–Np bond (Figure S1). This places the 2-methyl imidazole group near a methine carbon atom and the steric congestion leads to core ruffling. The effect of the two different hindered imidazoles on core conformations is nearly identical. Some time ago, Hoard72, 73 pointed out that such core ruffling leads to a shortening of the equatorial Fe–Np bonds. [Fe(TPP)(CO)(1,2-Me2Im)]·C7H8 and [Fe(TPP)(CO)(2-MeHIm)]·C7H8 have average Fe–Np bond lengths of 1.985(8) and 1.988(6) Å and the shortening observed for these two derivatives is in general agreement with expectations. Ruffled core conformations have been observed for a number of six-coordinate iron(II) porphyrinates with a single diatomic ligand. Ruffled cores (Fe–Np distances given in parentheses) have been observed in [Fe(Deut)(CO)(THF)] (1.981(3) Å),62 [Fe(TpivPP)(O2)(1-MeIm)] (1.979(13) Å),74 [Fe(TpivPP)(O2)(2-MeHIm)] (1.995(4) Å),75 [Fe(OEP)(CS)(CH3OH)] (1.993(1) Å),68 and [Fe(TpivPP)(CO)(NO2)]− (1.997(6) Å).76
The other two derivatives, [Fe(TPP)(CO)(1-MeIm)]·C6H6 and [Fe(TPP)(CO)(1,2-Me2Im)], have core conformations that are primarily saddled and are similar to each other. These two complexes contain imidazoles that are oriented approximately 30° from the nearest Fe–Np bond. (See Figures S2 and S3.) The average Fe–Np bond distance for [Fe(TPP)(CO)(1-MeIm)]·C6H6 and [Fe(TPP)(CO)(1,2-Me2Im)] are 2.005(6) and 2.004(1) Å respectively, somewhat longer than those observed for the ruffled derivatives.
Saddling is a commonly observed core conformation of six-coordinate iron(II) porphyrinates with a single diatomic ligand. Saddled cores (Fe–Np distances given in parentheses) have been observed in [Fe(OEP)(CO)(1-MeIm)] (2.000(3) Å),57 [Fe(TPP)(CO)(Py)] (2.02(3) Å),60 [Fe(TPP)(NO)(1-MeIm)] (2.009(13) Å),71 [Fe(TPP)(NO)(NMe2Py)] (2.006(11) Å),71 [Fe(TPP)(NO)(4-MePip)] (2.009(8) Å),71 [Fe(OEP)(CS)(1-MeIm)] (2.001(4) Å),68 and [Fe(OEP)(CS)Py)] (1.999(1) Å).68
The relationship between core conformation and the orientation of planar axial ligands is clearly shown in these newly reported species. [Fe(TPP)(CO)(1,2-Me2Im)]·C7H8 and [Fe(TPP)(CO)(1,2-Me2Im)] (with a twofold symmetry axis along the Fe–C–O) have identical ligands, yet their imidazole orientations are substantially different and subsequently so are their core conformations. Although the energies associated with the crystallization of the two crystalline forms is not well understood, it is interesting to note that the crystal system formed over the shorter time is the slightly more ordered. These two sets of molecular structures further illustrate that axial ligand orientations affect core conformations. Finally we note that there continues to be speculation that core perturbations may play a crucial role in the activity of heme centers in biology.77-79
Mössbauer
Variable temperature Mössbauer data for three new carbonyl derivatives, two of which have been structurally characterized, have been obtained. These new data are reported in Table 2 along with previously reported data from the literature. The data is consistent with other low-spin carbonyls. The new derivatives display very little temperature dependence on either the quadrupole splitting or the isomer shift value in the temperature range of 15 to 293 K. The quadrupole splitting value for [Fe(TPP)(CO)(1,2-Me2Im)]·C7H8 with its sterically hindered imidazole ligand has a higher value than that of any other derivative. This suggests that the magnitude of the quadrupole splitting could be sensitive to variation in the geometry around the iron atom. A systematic investigation of this issue is currently being planned.
Table 2.
Mössbauer data for [Fe(TPP)(CO)(L)] and related complexes.
| Complexa | Temp, K | Δ Eqb | δ b | ref |
|---|---|---|---|---|
| [Fe(Por)(CO)(L)] | ||||
| [Fe(TPP)(CO)(1,2-Me2Im)]C7H8 | 293 | 0.71 | 0.17 | tw |
| 200 | 0.65 | 0.23 | tw | |
| 100 | 0.66 | 0.29 | tw | |
| 15 | 0.64 | 0.25 | tw | |
| [Fe(TPP)(CO)(1-MeIm)]C6H6 | 293 | 0.35 | 0.16 | tw |
| 200 | 0.32 | 0.24 | tw | |
| 100 | 0.32 | 0.25 | tw | |
| 15 | 0.30 | 0.26 | tw | |
| [Fe(OEP)(CO)(1-MeIm)]C6H6 | 293 | 0.40 | 0.18 | tw |
| 200 | 0.37 | 0.25 | tw | |
| 100 | 0.37 | 0.23 | tw | |
| 15 | 0.34 | 0.24 | tw | |
| [Fe(TPP)(CO)(1-MeIm)] | 77 | 0.35 | 0.20 | 80 |
| [Fe(TPP)(CO)(Py)] | 77 | 0.57 | 0.28 | 80 |
| [Fe(TPP)(CO)(Pip)] | 295 | 0.53 | 0.18 | 81 |
| MbCO | 4.2 | +0.35 | 0.27 | 82 |
| HbCO | 4.2 | +0.36 | 0.26 | 83 |
| [Fe(Por)(CS)(L)] and [Fe(Por)(CS)] | ||||
| [Fe(OEP)(CS)(1-MeIm)] | 293 | 0.47 | 0.03 | 68 |
| 4.2 | 0.42 | 0.14 | 68 | |
| [Fe(OEP)(CS) | 293 | 1.95 | −0.03 | 68 |
| 4.2 | 1.93 | 0.08 | 68 | |
| [Fe(Por)(NO)(L)] and [Fe(Por)(NO)] | ||||
| [Fe(TPP)(NO)(1-MeIm)] | 293 | 0.80 | 0.24 | 71 |
| 4.2 | 0.73 | 0.35 | 71 | |
| [Fe(TPP)(NO)] | 4.2 | 1.24 | 0.35 | 84 |
| [Fe(OEP)(NO)] | 100 | 1.26 | 0.35 | 85 |
Abbreviations given in the References.
Value in mm/sec.
Environmental Effects on νC–O Values
In heme proteins, CO stretching frequencies have been found to vary from 1904 to 1984 cm−1.86 These differences in νC–O are believed to be the result of both the interactions with specific residues in the ligand binding pocket as well as generalized electrostatic effects. In early IR studies, the CO stretching frequencies of MbCO were found to vary between 1932 to 1965 cm−1. These were perhaps the first studies that demonstrated that the protein environment had a substantial effect on CO stretching frequencies.87 The multiple CO stretching frequencies are believed to reflect differences in ligand binding pocket conformational states.34-36 The relative intensities of these modes are affected by pH, temperature and pressure.88 Four distinct CO stretching frequencies are found in MbCO. These states and CO frequencies are: 1965 cm−1 (A0), 1947 cm−1 (A1), 1942 cm−1 (A2), and 1932 cm−1 (A3).35 Subsequently, CO has been utilized to examine the electrostatic properties near the diatomic binding pocket in Mb and Mb mutants. Phillips et al. have demonstrated that the stretching frequency of CO can act as a gauge of the electrostatic fields near the ligand binding site.14 Thus the vibrational properties of CO gives a useful experimental measure of environmental effects in heme proteins. Understanding such effects could assist in determining how discrimination in binding between NO, CO, and O2 in heme proteins arises.14,23 In an interesting theoretical study, Franzen suggests that specific orientations of the ligand binding pocket groups play an important role in the CO/O2 discrimination.89
The four iron(II) carbonyl derivatives reported here show a large range of CO stretching frequencies in the solid state. The CO absorbances, measured on carefully mulled single crystals, showed νC–O's from 1968 to 1926 cm−1. These values show a larger than expected range of frequencies, since the generally observed value for νC–O for “classical” [Fe(Por)(CO)(L)] derivatives is ∼1970 cm−1.61 Indeed, the CO stretching frequencies of these four complexes in toluene solution are all observed at 1968–1972 cm−1. We expect that the complexes have a common environment in the toluene solution. The solution IR measurement for [Fe(TPP)(CO)(1-MeIm)] is straightforward, but the solution equilibria with the hindered imidazoles/CO requires measurements with a CO-saturated solution and high concentrations of the imidazole. When both of these conditions are satisfied, a single C–O stretching frequency is observed for a toluene solution of [Fe(TPP)(CO)(1,2-Me2Im)]; similar results for [Fe(TPP)(CO)(2-MeHIm)] are observed with the band for the six-coordinate CO complexes clearly at 1972 cm−1. The small range of solution CO stretching frequencies clearly indicates that the effect of the trans imidazole ligand is minimal. Thus, the available data strongly suggest that the decreased solid–state CO frequencies in these four CO derivatives are the result of solid-state environmental effects. Accordingly, we have examined the crystal structures and the CO environment of the four complexes in detail.
We first discuss the crystal structures of [Fe(TPP)(CO)(2-MeHIm)]·C7H8 and [Fe(TPP)-(CO)(1,2-Me2Im)]·C7H8 where the largest solid-state influence on νC–O is displayed. In these two isomorphous crystal structures, the molecules pack in the herringbone-like pattern shown in Figure S4. There are a number of O⋯H contacts less than 3.5 Å in all four derivatives (tabulated in Table 3); the closest contacts in these two derivatives come from contact with atoms of the coordinated imidazole of an adjacent molecule. The herringbone packing in the crystal structure of [Fe(TPP)(CO)(2-MeHIm)]·C7H8 places the N–H hydrogen from the adjacent imidazole at the proper distance and orientation for a hydrogen bonding interaction. The O⋯H and O⋯N distances are 2.38 Å and 3.16 Å respectively. The Fe⋯O⋯H angle of [Fe(TPP)(CO)(2-MeHIm)]·C7H8 is 112.0° and the Fe⋯O⋯N angle is 114.7°. The canonical hydrogen bond contact distances for O⋯H and O⋯N are 2.0 Å and 2.9 Å.90 Although the observed O⋯H distance of 2.38 Å is not the shortest possible such distance, shorter O⋯H distances typically involve an oxygen with a negative charge. However, the distance is clearly consistent with a real hydrogen bonding interaction. This interaction of the neighboring imidazole N–H hydrogen with the carbonyl oxygen leads to a 46 cm−1 shift from the solution IR measurement to 1926 cm−1 in the solid state. This low frequency is reminiscent of the 1932 cm−1 frequency observed for the A3 conformer of sperm whale Mb,32, 35 that has been attributed to hydrogen bonding from the distal histidine (H64).30,32,34
Table 3.
Listing of the Closest Contacts to CO (All H⋯O ≤ 3.5 Å) and Related Geometrical Features.
| [Fe(TPP)(CO)(2-MeHIm)]·C7H8 | [Fe(TPP)(CO)(1,2-Me2Im)]·C7H8 (major)a | [Fe(TPP)(CO)(1,2-Me2Im)]·C7H8 (minor)a | [Fe(TPP)(CO)(1,2-Me2Im)] | [Fe(TPP)(CO)(1-MeIm)]·C6H6 | |
|---|---|---|---|---|---|
| νC–O, cm−1 | 1926 | 1953 | 1948 | 1963 | 1972 |
| O⋯H, (Type)b | 2.38 (N–Hc) | 2.53 (CH3d) | 2.86 (ImC–He) | 2.62 (βC–Hf) | 2.65 (ImC–H) |
| O⋯X, Fe⋯O⋯X | 3.16, 114.7 | 2.96, 117.5 | 3.66, 96.2 | 3.26, 126.6 | 3.08, 143.4 |
| X–H⋯O | 166.7 | 106.7 | 139.3 | 125.2 | 108.2 |
| O⋯H, (Type)b | 2.72 (Ph–Hg) | 2.71 (CH3) | 3.11 (CH3) | 2.62 (βC–H) | 2.71 (Ph–H) |
| O⋯X, Fe⋯O⋯X | 3.38, 124.7 | 2.96, 79.8 | 3.68, 105.4 | 3.26, 126.6 | 3.14, 129.1 |
| X–H⋯O | 127.3 | 91.9 | 136.8 | 125.2 | 108.3 |
| O⋯H, (Type)b | 3.11 (Ph–H) | 3.09 (CH3) | 2.60 (Ph–H) | 2.79 (Ph–H) | 2.84 (Ph–H) |
| O⋯X, Fe⋯O⋯X | 3.56, 101.9 | 2.96, 101.0 | 3.29, 155.0 | 3.17, 104.0 | 3.33, 118.0 |
| X–H⋯O | 112.6 | 73.2 | 129.7 | 105.3 | 112.8 |
| O⋯H, (Type)b | 3.09 (CH3) | 2.60 (Ph–H) | 3.24 (Ph–H) | 2.79 (Ph–H) | 2.95 (Ph–H) |
| O⋯X, Fe⋯O⋯X | 3.91, 99.7 | 3.29, 155.0 | 3.61, 111.7 | 3.17, 104.0 | 3.26, 105.1 |
| X–H⋯O | 142.2 | 129.7 | 105.2 | 105.3 | 100.5 |
| O⋯H, (Type)b | – | 3.24 (Ph–H) | – | 3.20 (Ph–H) | 2.98 (CH3) |
| O⋯X, Fe⋯O⋯X | – | 3.61, 111.7 | – | 3.40, 103.9 | 3.30, 112.2 |
| X–H⋯O | – | 105.2 | – | 93.7 | 100.2 |
| O⋯H, (Type)b | – | – | – | 3.20 (Ph–H) | 3.08 (CH3) |
| O⋯X, Fe⋯O⋯X | – | – | – | 3.40, 103.9 | 3.30, 112.2 |
| X–H⋯O | – | – | – | 93.7 | 94.5 |
Major orientation and minor orientation of the adjacent imidazole.
Each entry consists of three lines. Line 1 has the O⋯H distance in Å, followed by H-atom type. Line 2 has the O⋯X distance in Å, where X is the atom to which the H is bonded, followed by the Fe⋯O⋯X angle in degrees, followed by line 3 where the X–H⋯O angle in degrees is given.
Imidazole N–H.
Imidazole 2-methyl.
β-pyrrole H.
Imidazole 3-carbon H.
Phenyl H.
The [Fe(TPP)(CO)(1,2-Me2Im)]·C7H8 crystal lattice places methyl hydrogen atoms from the closest neighboring coordinated imidazole close to the carbonyl oxygen atom. The crystalline disorder described earlier leads to two distinct environments for the carbonyl oxygen atom from the two orientations of the coordinated imidazole as shown in Figure 5. For the major ligand orientation the O⋯H and O⋯C distances are 2.50 Å and 2.98 Å respectively. The major orientation also has a second hydrogen from the methyl group with an O⋯H distance of 2.69 Å. The Fe⋯O⋯H angle of [Fe(TPP)(CO)(1,2-Me2Im)]·C7H8 is 118.5° and the Fe⋯O⋯C angle is 101.0°. The minor orientation O⋯H and O⋯C distances from the imidazole methyl group are 3.11 Å and 3.68 Å, respectively. Indeed the closest contacts in the minor orientation are those in common with those of the major orientation (see Table 3). If the close methyl group environment is influencing νC–O, two CO bands would be expected in the solid state. Indeed, there are two bands; the split in the νC–O band shown in Figure 6. Consistent with the unequal occupation of the two imidazole sites, the intensities of the two bands are not equal. The major orientation, at 62% occupancy, likely accounts for the more intense absorbance at 1953 cm−1, while the minor orientation, at 38% occupancy, has νC–O at 1948 cm−1. Thus the two frequencies represent the difference in moving the methyl group about 0.7 Å closer to the carbonyl oxygen as seen in Figure 5. That there are two νC–O values clearly shows that a methyl group close to the CO oxygen has an effect; that the effect of a closer methyl group approach apparently leads to a higher value of the stretching frequency is perhaps unexpected. However, single site mutations in MbCO in which the distal histidine is changed to leucine, isoleucine or valine are all observed to have νC–O increased from the A1 and A2 values (native) of 1947 and 1942 cm−1.14
Figure 5.
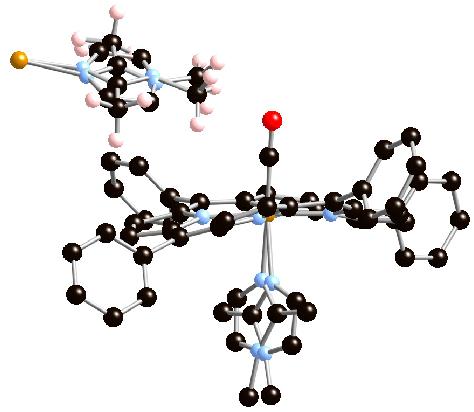
Diagram illustrating the approach of methyl group hydrogens from the two distinct ligand orientations to the C–O of an adjacent molecule in [Fe(TPP)(CO)(1,2-Me2Im)]·C7H8. The major 1,2-dimethylimidazole orientation has H⋯OC distances of 2.50 Å and 2.69 Å, and the C⋯OC distance is 2.96 Å. In the minor orientation, the C⋯OC distance has increased to 3.68Å.
Figure 6.
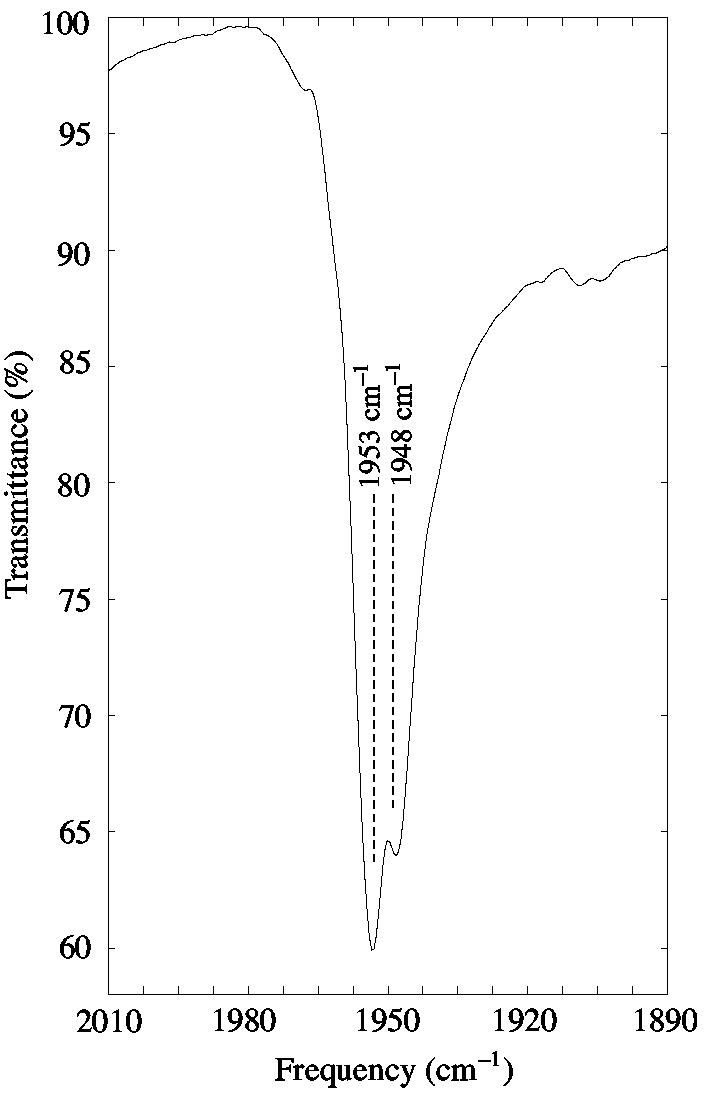
IR spectrum of a single crystal of [Fe(TPP)(CO)(1,2-Me2Im)]·C7H8 mulled in Nujol. Two C–O stretches are observed as a result of distinct methyl group interactions with two orientations of a 1,2-dimethylimidazole from an adjacent molecule in the crystal lattice.
Interestingly, there is a small difference in the tilt of the carbonyl ligand in the two isomorphous species [Fe(TPP)(CO)(L)], L = 2-methyl- and 1,2-dimethylimidazole. This is shown by the difference (0.38 Å) in the oxygen atom position when the two cores are overlaid as shown in Figure 4. The differences are such that the N–H⋯O interaction appears attractive (CO tilts toward imidazole) while that of the CH3⋯O interaction appears to be less attractive to modestly repulsive (CO tilts away from imidazole).
The unsolvated form of [Fe(TPP)(CO)(1,2-Me2Im)] is packed into a lattice with all porphyrin planes parallel. The environment of the CO oxygen has a pair (twofold-equivalent) O⋯H and O⋯C separations of 2.62 Å and 3.26 Å; the Fe⋯ O⋯H angles are 138.8°. The hydrogen atoms are from the β-carbons of adjacent porphyrins. Aspects of this environment are illustrated in Figure S7. This environment leads to νC–O = 1963 cm−1, shifted from the 1972 cm−1 observed in toluene solution. Even though the oxygen–hydrogen atom contacts are closer in this derivative than in the solvated form, the difference in the orientation and symmetry of the close contacts leads to a smaller shift in νC–O from the solution value.
The solid state C–O stretching frequency in [Fe(TPP)(CO)(1-MeIm)]·C6H6 is unshifted from its solution value. Although the carbonyl oxygen contact distances in this solid-state species are not significantly different from those of other derivatives, the detailed geometry has some significant differences. The closest contact has the C–O bond nearly parallel to the H–C bond of the imidazole of an adjacent molecule; the contacts are relatively short at O⋯H and O⋯C distances of 2.651 Å and 3.082 Å, respectively. The unshifted value (1968 cm−1) of νC–O clearly shows that short contact distances alone will not shift the vibration. The differences in the orientation of the adjacent imidazole in the three derivatives with close imidazole approaches are compared in Figure 7. The observed structural data and associated vibrational stretching frequencies for bound CO show that H–interactions with the CO oxygen atom that occur from the side will be much more significant than those that occur from the end. This generalization had been suggested by Franzen89 based on detailed ligand binding pocket modeling calculations.
Figure 7.
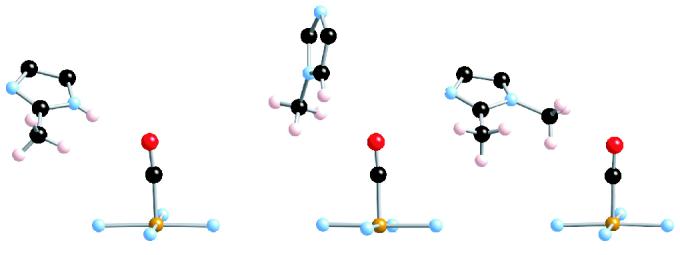
Drawing comparing the orientation of the closely approaching imidazole ligand in [Fe(TPP)(CO)(2-MeHIm)]·C7H8 (left) with those of [Fe(TPP)(CO)(1-MeIm)]·C7H6 (center) and [Fe(TPP)(CO)(1,2-Me2Im)]·C7H8 (right). Note the strong similarity in imidazole plane orientation between the left and right structures.
These structural results clearly show that the effects of close contacts on νC–O in the carbonyl complexes depends on the distance, hydrogen atom type, and orientation of the hydrogen atom contacts to the CO oxygen atom. All variables are significant and dissecting the individual contributions is clearly a challenge. Phillips et al.37 have approached this from a study of the distal pocket electrostatic potential of wild type and Mb mutants. These studies have demonstrated that much of the νC–O shifts to higher frequencies are due to the loss of hydrogen bonding interactions with histidine 64 (H64) in the distal binding pocket.14 The calculations of Franzen,89 as noted above, emphasize the importance of the orientation between the H-group and the oxygen atom in addition to the generalized electrostatic potential. Indeed, there are other possible contributions to the value of νC–O including the possibility of core conformation effects. It is important to note that the detailed structural information we have provided allows for the possibility of further detailed calculations.
Schlicting and co-workers have carried out a high-resolution (1.15 Å) structure determination of MbCO.30 In this study, three different conformers that involve differing orientations of the distal histidine 64 were found and were associated with νC–O of conformers A1, A3, and A0. Conformer A3 (1927 cm−1), which is a minor occupancy conformer, displays a hydrogen bond from the histidine N–H. Other investigators (Sage91 and Ray et al.92) have suggested that A1 (1945 cm−1) is the most likely hydrogen bonded conformer. Although the exact interactions of CO in MbCO can not be fully elucidated, the results we have observed for [Fe(TPP)(CO)(2-MeHIm)]·C7H8 further suggests that N–H interactions can cause large shifts in νC–O toward lower frequency akin to shifts observed from free heme (∼1970 cm−1) to A3 in MbCO.
Fe–C/C–O Bond Length Correlations
Spectroscopic studies of a large number of protein and porphyrin systems with CO bound to iron(II) have shown that there is an inverse correlation of νC–O and νFe–CO.5,10,61 This phenomenon is attributed to electron donation from the occupied iron dπ orbitals to the empty π* orbitals on CO thus causing a reduction in the C–O bond order and a concomitant increase in the Fe–C bond order.61 This classical π-back-donation effect should, in principle, lead to an inverse change in the Fe–C vs C–O bond distance. However, such bond distance changes are typically too small to be reliably observed in single-crystal structure determinations. For the present structures, which have been determined at very high precision and accuracy, we find that the structural equivalent to the spectroscopists π-back-bonding inverse correlation for iron carbonyls can be observed.
A plot of the observed Fe–C vs C–O bond distances for the four structures is given in Figure 8; the data are shown in tabular form in Table 1. The inverse linear correlation is clear; the correlation coefficient of the fit, given by Pearson's R,93 is 0.98. Values for all structurally characterized iron(II)carbonyl imidazole derivatives are shown in the inset of Figure 8. The linear fit correlation line from the main panel is overlaid on this data; the general fit to the correlation line is apparent. The larger range of values in the distribution of the data reflects the generally lower precision of the other measurements as well as the possible presence of small systematic errors.
Figure 8.
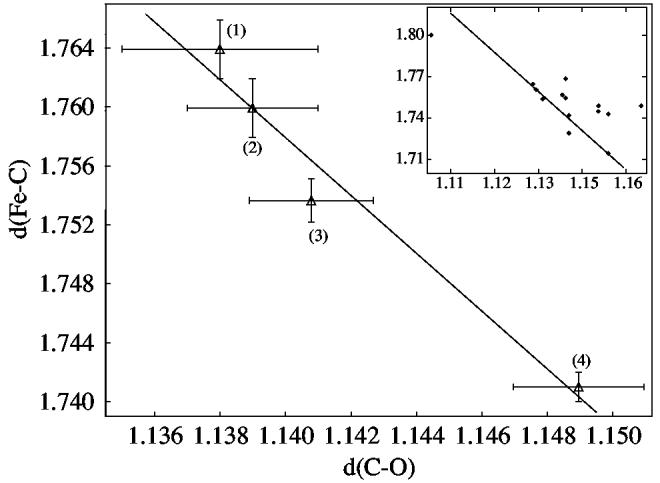
Plot of Fe–C vs C–O distances (Å). Data illustrated in main panel are: (1) [Fe(TPP)(CO)(1,2-Me2Im)], (2) [Fe(TPP)(CO)(1-MeIm)]·C6H6, (3) [Fe(TPP)(CO)(1,2-Me2Im)]·C7H8, and (4) [Fe(TPP)(CO)(2-MeHIm)]·C7H8. Error bars are displayed. The linear fit has a correlation coefficient of R = 0.98. 93 The inset shows all iron(II)carbonyl imidazole structures, with the main panel correlation line overlaid.
Not surprisingly, there are correlations between the measured, solid-state C–O stretching frequencies and the C–O and Fe–C bond distances in these four new derivatives. Figure 9 shows plots of νC–O vs the C–O bond distance (left panel) and νC–O vs the Fe–C bond distance (right panel). The increasing value of νC–O as the C–O distance decreases and the Fe–C distance increases can be clearly seen. The correlations for all equivalent literature data are given in SI Figure S5. The correlation fit lines from Figure 9 are imposed; although the general correlation may be recognized, the scatter clearly reflects the lower precision of most earlier structures. It should also be recognized that the correlations of Figure 9 are all based on tetraphenylporphyrin derivatives, while those of Figure S5 are principally those for tetraarylporphyrin derivatives that include many substituted phenyls. There is very likely some porphyrin dependence (cis effects) on these correlations that will lead to differing trend lines. This is likely to contribute to some of the scatter in Figure S5.
Figure 9.
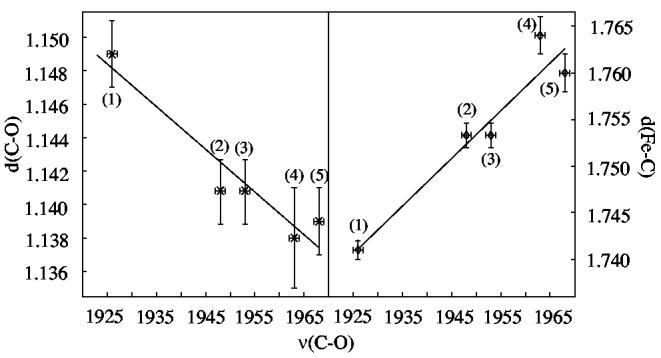
Plots showing the relationship between the Fe–C and C–O distances (Å) and νC–O (cm−1). The two panels show data for: (1) [Fe(TPP)(CO)(2-MeHIm)]·C7H8, (2) [Fe(TPP)(CO)(1,2-Me2Im)]·C7H8, (3) [Fe(TPP)(CO)(1,2-Me2Im)]·C7H8 (second νC–O), (4) [Fe(TPP)(CO)(1,2-Me2Im)], and (5) [Fe(TPP)(CO)(1-MeIm)]·C6H6. Error bars are displayed. Correlation coefficients for both panels are R = 0.96. 93 A plot including all iron(II)carbonyl imidazoles is included in the Supporting Information.
Axial Ligand Distortions: Structural Effects?
One early motivation for this study was the theoretical suggestion put forward by Jewsbury et al.22 that the possible distortions (bending/tilting) of the Fe–C–O group of myoglobin are the result of effects on the proximal (trans) side of the porphyrin plane. In this model, the off-perpendicular distortion of the Fe–C–O unit is caused by a nonequilibrium orientation of the proximal residue (histidine in the native protein) and not effects from the distal side. Our experimental test of this proposal was the preparation of a carbonyl complex with a sterically hindered trans imidazole ligand. A hindered imidazole would necessarily have a substantial off-axis tilt of the Fe–N bond that, if the Jewsbury hypothesis is valid, should then lead to some distortion of the iron carbonyl group.
The first such compound characterized was unsolvated [Fe(TPP)(CO)(1,2-DiMeIm)]. This complex crystallized in a monoclinic space group with required twofold symmetry along the axial bond direction. The Fe–N(imidazole) bond is indeed off-axis with a tilt of 6.2°; the required twofold symmetry leads to the disorder shown in Figure 2. However, the Fe–C–O unit is linear as required by the imposed symmetry, with no evidence of disorder apparent in the thermal parameters. The imposed symmetry left some uncertainty in the result and additional data were sought. Unfortunately, we were unable for some time to prepare appropriate crystalline materials to further study the question. Then, two related species were obtained nearly simultaneously.
Structure analysis for extremely high-quality crystals of the toluene solvates of [Fe(TPP)(CO)(1,2-Me2Im)] and [Fe(TPP)(CO)(2-MeHIm)] became available. Crystals of [Fe(TPP)(CO)(2-MeHIm)] have a completely ordered imidazole; both complexes exhibit an off-axis Fe–N(imidazole) bond that does not seem to lead to any unusual distortions of the Fe–C–O unit. Indeed, the structural features associated with these Fe–C–O units do not display any more anomalous features than those observed in [Fe(TPP)(CO)(1-MeIm)]·C6H6, which has an unhindered imidazole. We conclude that any anomalous CO orientational effects (tilting and bending) do not follow the simple correlation pattern as suggested by Jewsbury et al.22 Although there are some small Fe–C–O tilts in the three new compounds, they do not correlate directly with proximal ligand orientation and the pattern suggested by Jewsbury.
There does, however, seem to be an interesting relationship in the structural parameters involving the axial ligands. The effect was suggested from the [Fe(TPP)(CO)(1,2-Me2Im)]·C7H8 result. As noted earlier, the axial 1,2-dimethylimidazole is disordered over two positions that are pseudo-twofold related. The two ligand positions are slightly asymmetric with different Fe–N(Im) bond distances and nonequal site occupancies. Although correlation effects with such closely overlapped groups are difficult to define, all attempts to force equivalent Fe–N distances were unsuccessful. We believe that there are some differences in the two orientations. Final crystallographic results are shown in Figure S6 of the Supporting Information. Energetically, the major and minor imidazole orientations are probably only slightly different from each other. Nonetheless, the less occupied orientation site not only has an unusually long Fe–NIm bond (2.143 Å), but also a C–Fe–NIm angle (168.6°) that is abnormally small. A search of the C–Fe–NIm angle for all other iron(II)carbonyl imidazoles in the literature showed that angles less then 173° had not been previously reported. This search did suggest that there is a relationship between values of the Fe–NIm bond length vs the C–Fe–NIm angle. Figure 10 displays these values for all iron(II)carbonyl imidazole porphyrinates that are not “strapped” or “capped.” A decrease in the value of the C–Fe–NIm angle accompanies a lengthening of the Fe–NIm bond. These data points are fit linearly with a correlation coefficient of R93 = 0.87. The inset of Figure 10 shows the values for all iron(II) carbonyl porphyrinates with imidazole as a sixth ligand reported to date; the correlation line from the main panel is superimposed.
Figure 10.
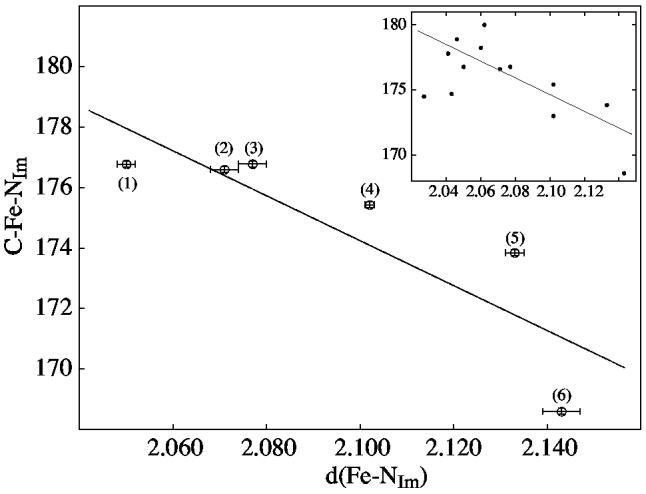
Plot of the C–Fe–NIm angle vs the Fe–NIm distance (Å). All iron(II)carbonyl imidazole structures that do not contain a porphyrin strap are included: (1) [Fe(TPP)(CO)(1-MeIm)]·C6H6, (2) [Fe(TPP)(CO)(1,2-Me2-Im)]·C7H8, (3) [Fe(OEP)(CO)(1-MeIm)], (4) Fe(TPP)(CO)(2-MeHIm)]·C7H8, (5) [Fe(TPP)(CO)(1,2-Me2Im)], (6) [Fe(TPP)(CO)(1,2-Me2Im)]·C7H8 (minor orientation of the axial ligand). Error bars are displayed. The line showing the correlation has a correlation coefficient of R = 0.84.93 The inset illustrates the values for all reported iron(II) carbonyl imidazole structures with the same correlation line as given in the main panel.
This correlation does suggest that proximal ligand pocket effects could have a role in the overall OC–Fe–histidine geometry in MbCO or HbCO. Any proximal ligand pocket effect that leads to modulation of the Fe–NHis distance could be expected to affect the C–Fe–NHis angle. What physiological role this effect may play is currently unknown. It is to be noted that distal pocket substitutions in many heme protein systems have been shown to affect ligand binding and discrimination; it is not difficult to imagine both distal and proximal control of binding.
Summary
Four new six-coordinate iron(II) imidazole- and carbonyl-ligated porphyrinates have been prepared and characterized. Crystallographic data that was both of very high quality and high resolution was used in their structural characterization. Although the IR spectra of the four species showed similar values of νC–O in toluene solution, large differences (46 cm−1 range) are seen in solid-state νC–O's. These frequency differences result from the differing crystalline environments of the CO. The lowest frequency (1926 cm−1) is the result of a hydrogen bond to the CO oxygen. The structural data is of sufficient accuracy to allow the observation of the correlation of the Fe–C vs C–O distances that is expected from the classical picture of π-back-bonding for metal carbonyls. The Fe–C and C–O distances are also strongly correlated with the observed solid-state CO stretching frequencies. The off-axis tilting of the hindered imidazole ligand trans to CO appears to have little effect on possible tilts and bends of the Fe–C–O unit. However, there does appear to be a correlation between a decreasing C–Fe–NIm angle and an increasing Fe–NIm bond distance.
Supplementary Material
Acknowledgments
We thank the National Institutes of Health for support of this research under Grant GM-38401 (W.R.S). We thank Prof. Timothy Sage for useful discussions.
Footnotes
Supporting Information Available: Figures S1–S3, formal diagrams displaying the perpendicular displacement of core atoms from the 24-atom mean planes; Figure S4 giving a diagram showing herringbone-like crystal packing pattern of [Fe(TPP)(CO)(1,2-Me2Im)]·C7H8 and [Fe(TPP)(CO)(2-MeHIm)]·C7H8; Figure S5, plot illustrating Fe–C/C–O distances (Å) vs νC–O (cm−1) for all carbonyl iron(II) imidazoles; Figure S6, ORTEP diagram of [Fe(TPP)(CO)(1,2-Me2Im)]·C7H8 showing both orientations of the imidazole; Figure S7, displaying the environment of the oxygen atom in unsolvated [Fe(TPP)(CO)(1,2-Me2Im)]; Table S1, giving a summary of all crystallographic information Tables S2–S25, giving complete crystallographic details, atomic coordinates, bond distances and angles, anisotropic temperature factors, and hydrogen positions for [Fe(TPP)(CO)(1,2-Me2Im)]·C7H8, [Fe(TPP)(CO)(2-MeHIm)]·C7H8, [Fe(TPP)(CO)(1,2-Me2Im)] and [Fe(TPP)(CO)(1-MeIm)]·C6H6; Table S26, the orthogonal coordinates of the 1,2-dimethyl imidazole used in rigid body refinement of [Fe(TPP)(CO)(1,2-Me2Im)]. Crystallographic data is available as CIF files. This material is available free of charge via the Internet at http://pubs.acs.org.
References and Notes
- 1. The following abbreviations are used in this paper. Proteins: Mb, myoglobin; MbCO, myoglobin with coordinated CO; Hb, hemoglobin; HbCO, hemoglobin with coordinated CO. Porphyrins: Por, generalized porphyrin dianion; OEP, dianion of octaethylporphyrin; Deut, dianion of deuteroporphyrin; TpivPP, dianion of meso-α,α,α,α-tetrakis(o-pivalamidophenyl)porphyrin; TPP, dianion of meso-tetraphenylporphyrin. Ligands: Im, generalized imidazole; 1-MeIm, 1-methylimidazole; 2-MeHIm, 2-methylimidazole; 1,2-Me2Im, 1,2-dimethylimidazole; SEt−, anion of ethane thiol; THF, tetrahydrofuran; THT, tetrahydrothiophene; Py, pyridine. Spectroscopic techniques: IR, infrared absorption spectroscopy; rR, resonance Raman spectroscopy; NRVS, nuclear resonance vibrational spectroscopy.
- 2.Cotton FA, Wilkinson G, Murillo CA, Bochmann M. Advanced Inorganic Chemistry. 6th Wiley & Sons; New York: 1999. pp. 636–639. [Google Scholar]
- 3.Nakamoto K. Infrared and Raman Spectra of Inorganic and Coordination Compounds. 3rd Wiley & Sons; New York: 1978. pp. 279–281. [Google Scholar]
- 4.Tsubaki M, Ichikawa Y. Biochim. Biophys. Acta. 1985;827:268. doi: 10.1016/0167-4838(85)90211-0. [DOI] [PubMed] [Google Scholar]
- 5.Uno T, Nishimura Y, Masamichi T, Makino R, Iizuka T, Ishimura Y. J. Biol. Chem. 1987;262:4549. [PubMed] [Google Scholar]
- 6.Alben JO, Fiamingo FG. In: Optical Techniques in Biological Research. Rousseau DL, editor. Academic Press; Orlando: 1984. pp. 133–179. [Google Scholar]
- 7.(a) Rousseau DL, Ondrias MR. In: Optical Techniques in Biological Research. Rousseau DL, editor. Academic Press; Orlando: 1984. pp. 65–132. [Google Scholar]; (b) Kerr EA, Yu NT. In: Biological Applications of Raman Spectroscopy. Spiro TG, editor. Vol. 3. Wiley & Sons; New York: 1988. pp. 39–95. [Google Scholar]
- 8.Scheidt WR, Durbin SM, Sage JT. J. Inorg. Biochem. 2005;99:60. doi: 10.1016/j.jinorgbio.2004.11.004. [DOI] [PubMed] [Google Scholar]
- 9.Wang JH, Nakahara A, Fleischer EB. J. Am. Chem. Soc. 1958;80:1109. [Google Scholar]
- 10.Spiro TG, Zgierski MZ, Kozlowski PW. Coord. Chem. Rev. 2001;219-221:923. [Google Scholar]
- 11.Kitagawa T, Ozaki Y. Struct. Bonding (Berlin) 1987;64:71. [Google Scholar]
- 12.Alben JO. In: The Porphyrins. Dolphin D, editor. Vol. 3. Academic Press; New York: 1978. pp. 323–345. [Google Scholar]
- 13.Caughey WS, Alben JO. Biochemistry. 1968;7:175. doi: 10.1021/bi00841a022. [DOI] [PubMed] [Google Scholar]
- 14.Li T, Quillin ML, Phillips GN, Jr., Olsen JS. Biochemistry. 1994;33:1433. doi: 10.1021/bi00172a021. [DOI] [PubMed] [Google Scholar]
- 15.Rougee M, Brault D. Biochemistry. 1975;73:4100. [Google Scholar]
- 16.Rougee M, Brault D. Biochem. Biophys. Res. Commun. 1974;57:654. doi: 10.1016/0006-291x(74)90596-8. [DOI] [PubMed] [Google Scholar]
- 17.Gibson QH, Roughton FJ. Proc. Roy. Soc., Ser. B, Biol. Sci. 1957;146:206. doi: 10.1098/rspb.1957.0005. [DOI] [PubMed] [Google Scholar]
- 18.Landaw SA, Callahan EW, Jr., Schmid R. J. Clin. Invest. 1970;49:914. doi: 10.1172/JCI106311. [DOI] [PMC free article] [PubMed] [Google Scholar]
- 19.Collman JP, Brauman JI, Halbert TR, Suslick KS. Proc. Natl. Acad. Sci. U.S.A. 1976;73:3333. doi: 10.1073/pnas.73.10.3333. [DOI] [PMC free article] [PubMed] [Google Scholar]
- 20.Antonini E, Brunori M. Hemoglobin and Myoglobin in Their Reactions With Ligands. North-Holland; London: 1971. [Google Scholar]
- 21.Spiro TG, Smulevich G, Su C. Biochemistry. 1990;29:4497. doi: 10.1021/bi00471a001. [DOI] [PubMed] [Google Scholar]
- 22.(a) Jewsbury P, Yamamoto S, Minato T, Saito Minoru S, Kitagawa T. J. Am. Chem. Soc. 1994;116:11586. [Google Scholar]; (b) Jewsbury P, Yamamoto S, Minato T, Saito Minoru S, Kitagawa T. J. Phys. Chem. 1995;99:12677. [Google Scholar]
- 23.Springer BA, Sligar SG, Olsen JS, Phillips GN., Jr. Chem. Rev. 1994;94 [Google Scholar]
- 24.Ivanov D, Sage JT, Keim M, Powell JR, Asher SA, Champion PM. J. Am. Chem. Soc. 1994;116:4139. [Google Scholar]
- 25.Lim M, Jackson TA, Anfinrud PA. Science. 1995;269:962. doi: 10.1126/science.7638619. [DOI] [PubMed] [Google Scholar]
- 26.Kuriyan J, Wilz S, Karplus M, Petsko GA. J. Mol. Biol. 1986;192:133. doi: 10.1016/0022-2836(86)90470-5. [DOI] [PubMed] [Google Scholar]
- 27.Teng T-Y, Šrajer V, Moffat K. Nat. Struct. Biol. 1994;1 doi: 10.1038/nsb1094-701. [DOI] [PubMed] [Google Scholar]
- 28.Schlichting I, Berendzen J, Phillips GN, Jr., Sweet RM. Nature. 1994;371:808. doi: 10.1038/371808a0. [DOI] [PubMed] [Google Scholar]
- 29.Cheng X, Schoenborn BP. J. Mol. Biol. 1991;220:381. doi: 10.1016/0022-2836(91)90020-7. [DOI] [PubMed] [Google Scholar]
- 30.Vojtĕchovský J, Chu K, Berendzen J, Sweet RM, Schlichting I. Biophys. J. 1999;77:2153. doi: 10.1016/S0006-3495(99)77056-6. [DOI] [PMC free article] [PubMed] [Google Scholar]
- 31.Kachalova GS, Popov AN, Bartunik HD. Science. 1999;284:473. doi: 10.1126/science.284.5413.473. [DOI] [PubMed] [Google Scholar]
- 32.Shimada H, Caughey WS. J. Biol. Chem. 1982;257 [PubMed] [Google Scholar]
- 33.Potter WT, Hazzard JH, Choc MG, Tucker MP, Caughey WS. Biochemistry. 1990;29:6283. doi: 10.1021/bi00478a025. [DOI] [PubMed] [Google Scholar]
- 34.Frauenfelder H, Sligar SG, Wolynes PG. Science. 1991;254:1598. doi: 10.1126/science.1749933. [DOI] [PubMed] [Google Scholar]; Young RD, Frauenfelder H, Johnson JB, Lamb DC, Nienhaus GU, Phillip R, Scholl R. Chem. Phys. 1991;158:315. [Google Scholar]
- 35.Alben JO, Beece D, Bowne SF, Doster W, Eisenstein L, Frauenfelder H, Good D, McDonald MC, Marden MC, Moh PP, Reinisch L, Reynolds AH, Shyamsunder E, Yue KT. Proc. Natl. Acad. Sci. U.S.A. 1982;79:3744. doi: 10.1073/pnas.79.12.3744. [DOI] [PMC free article] [PubMed] [Google Scholar]
- 36.Makinen MW, Houtchens RA, Caughey WS. Proc. Natl. Acad. Sci. U.S.A. 1979;76:6042. doi: 10.1073/pnas.76.12.6042. [DOI] [PMC free article] [PubMed] [Google Scholar]
- 37.Phillips GN, Jr., Teodoro ML, Li T, Smith B, Olsen JS. J. Phys. Chem. B. 1999;103:8817. [Google Scholar]
- 38.Adler AD, Longo FR, Finarelli JD, Goldmacher J, Assour J, Korsakoff L. J. Org. Chem. 1967;32:476. [Google Scholar]
- 39.Adler AD, Longo FR, Kampus F, Kim J. J. Inorg. Nucl. Chem. 1970;32:2443. [Google Scholar]
- 40.(a) Fleischer EB, Srivastava TS. J. Am. Chem. Soc. 1969;91:2403. [Google Scholar]; (b) Hoffman AB, Collins DM, Day VW, Fleischer EB, Srivastava TS, Hoard JL. J. Am. Chem. Soc. 1972;94:3620. doi: 10.1021/ja00765a060. [DOI] [PubMed] [Google Scholar]
- 41.Stolzenberg AM, Strauss SH, Holm RH. J. Am. Chem. Soc. 1981;103:4763. [Google Scholar]
- 42.Sheldrick GM. Universität Göttingen; Germany: 1996. Program for empirical absorption correction of area detector data. [Google Scholar]
- 43.Sheldrick GM. Acta Crystallogr. 1990;A46:467. [Google Scholar]
- 44.Patterson AL. Phys. Rev. 1934;46:372. [Google Scholar]
- 45.Sheldrick GM. Universität Göttingen; Germany: SHELXL-97: FORTRAN program for crystal structure refinement, © 1997. [Google Scholar]
- 46. A reviewer has raised the question of possible problems with correlation of the parameters in the disordered system. We have carried out three types of refinement of the disordered imidazole. The first was the “traditional” refinement with constrained imidazole ring and equivalent Fe–N bond distances. We also carried out two refinements with unconstrained axial Fe–N bonds, one with constrained imidazole ring parameters and the second with free imidazole ring parameters. These two refinements gave essentially the same Fe–N distances and occupancies of the two rings. We concluded that there was a real chance that the two ring orientations and differing Fe–N distances was the correct choice to be made for this particular problem, which is clearly a difficult one.
- 47.Salzmann R, Ziegler CJ, Godbout N, McMahon MT, Suslick KS, Oldfield E. J. Am. Chem. Soc. 1998;120:11323. [Google Scholar]
- 48.Silvernail NJ, Noll BC, Scheidt WR. unpublished results. [Google Scholar]
- 49.White DK, Cannon JB, Traylor TG. J. Am. Chem. Soc. 1979;101:2443. [Google Scholar]
- 50.Collman JP, Brauman JI, Doxsee KM, Halbert TR, Suslick KS. Proc. Natl. Acad. Sci. U.S.A. 1978;75:564. doi: 10.1073/pnas.75.2.564. [DOI] [PMC free article] [PubMed] [Google Scholar]
- 51.Little RG, Ibers JA. J. Am. Chem. Soc. 1974;96:4452. doi: 10.1021/ja00821a018. [DOI] [PubMed] [Google Scholar]
- 52.Kim K, Ibers JA. J. Am. Chem. Soc. 1991;113:6077. [Google Scholar]
- 53.Slebodnick C, Duval ML, Ibers JA. Inorg. Chem. 1996;35:3607. [Google Scholar]
- 54.Hashimoto T, Dyer RL, Crossley MJ, Baldwin JE, Basolo F. J. Am. Chem. Soc. 1982;104:2101. [Google Scholar]
- 55.Ricard L, Weiss R, Momenteau M. J. Chem. Soc., Chem. Commun. 1986:818. [Google Scholar]
- 56.Collman JP, Sorrell TN. J. Am. Chem. Soc. 1975;97:4133. doi: 10.1021/ja00847a046. [DOI] [PubMed] [Google Scholar]
- 57.Salzmann R, McMahon MT, Godbout N, Sanders LK, Wojdelski M, Oldfield E. J. Am. Chem. Soc. 1999;121:3818. [Google Scholar]
- 58.Slebodnick C, Fettinger JC, Peterson HB, Ibers JA. J. Am. Chem. Soc. 1996;118:3216. [Google Scholar]
- 59.Kim K, Fettinger JC, Sessler JL, Cyr M, Hugdahl J, Collman JP, Ibers JA. J. Am. Chem. Soc. 1989;111 [Google Scholar]
- 60.Peng SM, Ibers JA. J. Am. Chem. Soc. 1976;98:8032. doi: 10.1021/ja00441a025. [DOI] [PubMed] [Google Scholar]
- 61.Buchler JW, Kokisch W, Smith PD. Struct. Bonding (Berlin) 1978;34 [Google Scholar]
- 62.Scheidt WR, Haller KJ, Fons M, Mashiko T, Reed CA. Biochemistry. 1981;20:3653. doi: 10.1021/bi00515a054. [DOI] [PubMed] [Google Scholar]
- 63.Collman JP, Sorrel TN, Dawson JH, Trudell JR, Bunnenberg E, Djerassi C. Proc. Natl. Acad. Sci. U.S.A. 1976;73:6. doi: 10.1073/pnas.73.1.6. [DOI] [PMC free article] [PubMed] [Google Scholar]
- 64.Caron C, Mitschler A, Rivére G, Richard L, Schappacher M, Weiss R. J. Am. Chem. Soc. 1979;101:7401. [Google Scholar]
- 65.Momenteau M, Scheidt WR, Eigenbrot CW, Reed CA. J. Am. Chem. Soc. 1988;110 [Google Scholar]
- 66.Munro OQ, Marques HM, Debrunner PG, Mohanrao K, Scheidt WR. J. Am. Chem. Soc. 1995;117 [Google Scholar]
- 67.(a) Hoard JL. Several bis-ligated iron(II) complexes of general formula [Fe(Por)(L)2] where L is an imidazole derivative have been structurally characterized. The values of Fe–N(L) are as follows: [Fe(TPP)(1-MeIm)2], 2.014(5) Å. personal communication to WRS. [Google Scholar]; (b) Safo MK, Scheidt WR, Gupta GP. Inorg. Chem. 1990;29:626. [Fe(TPP)(1-VinIm)2], 2.004(2) Å; [Fe(TPP)(1-BzIm)2], 2.017(4) [Google Scholar]
- 68.Cao C, Dahal S, Shang M, Beatty AM, Hibbs W, Schulz CE, Scheidt WR. Inorg. Chem. 2003;42:5202. doi: 10.1021/ic030043r. [DOI] [PMC free article] [PubMed] [Google Scholar]
- 69.Scheidt WR, Piciulo PL. J. Am. Chem. Soc. 1976;98:1913. doi: 10.1021/ja00423a044. [DOI] [PubMed] [Google Scholar]
- 70.Scheidt WR, Brinegar AC, Ferro EB, Kirner JF. J. Am. Chem. Soc. 1977;99:7315. [Google Scholar]
- 71.Wyllie GRA, Schulz CE, Scheidt WR. Inorg. Chem. 2003;42:5722. doi: 10.1021/ic034473t. [DOI] [PMC free article] [PubMed] [Google Scholar]
- 72.Hoard JL. Ann. N.Y. Acad. Sci. 1973;206 doi: 10.1111/j.1749-6632.1973.tb43202.x. [DOI] [PubMed] [Google Scholar]
- 73.Collins DM, Scheidt WR, Hoard JL. J. Am. Chem. Soc. 1972;94:6689. doi: 10.1021/ja00761a045. [DOI] [PubMed] [Google Scholar]
- 74.Jameson GB, Rodley GA, Robinson WT, Gagne RR, Reed CA, J. A, Collman Inorg. Chem. 1978;17:850. [Google Scholar]
- 75.Jameson GB, Molinaro FS, Ibers JA, Collman JP, Brauman JI, Rose E, Suslick KS. J. Am. Chem. Soc. 1980;102:3224. [Google Scholar]
- 76.Nasri H, Ellison MK, Shang M, Schulz CE, Scheidt WR. Inorg. Chem. 2004;43:2932. doi: 10.1021/ic035119y. [DOI] [PMC free article] [PubMed] [Google Scholar]
- 77.(a) Ma JG, Zhang J, Franco R, Jia SL, Moura I, Moura JJ, Kroneck PM, Shelnutt JA. Biochemistry. 1998;37:12431. doi: 10.1021/bi981189i. [DOI] [PubMed] [Google Scholar]; (b) Senge MO. In: The Porphyrin Handbook. Kadish KM, Smith KM, Guilard R, editors. Vol. 1. Academic Press; San Diego: 2000. p. 240. [Google Scholar]; (c) Kadish KM, Van Camelbecke E, Royal G. In: The Porphyrin Handbook. Kadish KM, Smith KM, Guilard R, editors. Vol. 8. Academic Press; San Diego: 2000. p. 3. [Google Scholar]
- 78.Roberts SA, Weichsel A, Qiu Y, Shelnutt JA, Walker FA, Montfort WR. Biochemistry. 2001;40:11327. doi: 10.1021/bi0109257. [DOI] [PubMed] [Google Scholar]
- 79.Pellicena P, Karow DS, Boon EM, Marletta MA, Kuriyan J. Proc. Natl. Acad. Sci. U.S.A. 2004;101 doi: 10.1073/pnas.0405188101. [DOI] [PMC free article] [PubMed] [Google Scholar]
- 80.Havlin RH, Godbout N, Salzmann R, Wojdelski M, Arnold W, Schulz CE, Oldfield E. J. Am. Chem. Soc. 1998;120:3144. [Google Scholar]
- 81.James BR, Sams JR, Tsin TB, Reimer KJ. J. Chem. Soc., Chem. Commun. 1978:746. [Google Scholar]
- 82.Maeda Y, Harami T, Morita Y, Trautwein A, Gonser U. J. Chem. Phys. 1981;75 [Google Scholar]
- 83.Lang G, Marshall W. Proc. Phys. Soc. 1981;75 [Google Scholar]
- 84.Nasri H, Ellison MK, Chen S, Hunyh BH, Scheidt WR. J. Am. Chem. Soc. 1997;119:6274. [Google Scholar]
- 85.Bohle DS, Debrunner PG, Fitzgerald J, Hansert B, Hung C-H, Thompson AJ. J. Chem. Soc., Chem. Commun. 1997:91. [Google Scholar]
- 86.Vogel KM, Kozlowski PM, Zgierski MZ, Spiro TG. Inorg. Chim. Acta. 2000;297:11. [Google Scholar]
- 87.McCoy S, Caughey WS. In: Probes of Structure and Function of Macromolecules and Membranes, Probes of Enzymes and Hemoproteins. Chance B, Yonetani T, Mildvan AS, editors. Vol. 2. Academic; New York: 1971. p. 289. [Google Scholar]
- 88.Fuchsman WH, Appleby CA. Biochemistry. 1979;18:1309. doi: 10.1021/bi00574a030. [DOI] [PubMed] [Google Scholar]; Ansari A, Berendzen J, Braunstein D, Cowen BR, Frauenfelder H, Hong MK, Iben IET, Johnson B, Ormos P, Sauke TB, Scholl R, Schulte A, Steinbach PJ, Vittitow J, Young RD. Biophys. Chem. 1987;26:337. doi: 10.1016/0301-4622(87)80034-0. [DOI] [PubMed] [Google Scholar]; Frauenfelder H, Alberding NA, Ansari A, Braunstein D, Cowen BR, Hong MK, Iben IET, Johnson JB, Luck S, Marden MC, Mourant JR. J. Phys. Chem. 1990;94:1024. [Google Scholar]
- 89.Franzen S. J. Am. Chem. Soc. 2002;124 [Google Scholar]
- 90.Hamilton WC, Ibers JA. Hydrogen Bonding in Solids. Vol. 16. Benjamin, W. A.; New York: 1968. [Google Scholar]
- 91.Sage JT. J. Biol. Inorg. Chem. 1994;116 [Google Scholar]
- 92.Ray GB, Li X-Y, Ibers JA,, Sessler JL, Spiro TG. J. Am. Chem. Soc. 1994;116 [Google Scholar]
- 93. A linear correlation coefficient, Pearson's R,94 was used to judge the fit to the data. .
- 94.Walpole RE, Meyers RH, Meyers SL, Ye K. Probability and Statistics for Engineers and Scientists. 7th Prentice Hall; Upper Saddle River, NJ: 2002. pp. 391–394. [Google Scholar]
Associated Data
This section collects any data citations, data availability statements, or supplementary materials included in this article.