

Abstract
Apoptosis is a dynamic process in which a characteristic morphological or biochemical event used in an assay as a specific marker of apoptosis may be observed over a limited period of time. Asynchronous involvement of cells in apoptosis results in different proportions of apoptotic cells with blebbed membrane, broken nuclei, modified mitochondrial units or fragmented DNA coexisting in the culture at any single moment. Thus, depending on the method used, the extent of apoptosis determined in the same cell population may vary. In the present study, a microculture kinetic (MiCK) assay was used to monitor apoptosis in HL-60 cells exposed to 1, 2.5, 5, 10, and 20 μmol/L etoposide and cisplatin. Both the extent and timing of apoptotic responses were dependent on the drug and drug concentration. Time-lapse video microscopy (TLVM), flow cytometry analysis of the light scattering properties of cells, morphological studies of Giemsa-stained cells, annexin V binding, and DNA fragmentation assays were performed at multiple times of cell exposure to 10 μmol/L etoposide and 5 μmol/L cisplatin. Steep linear increases in optical density, indicating apoptosis in the MiCK assay, correlated with both linear increases in the proportion of cells with plasma membrane blebbing in TLVM and with increased side scattering properties of apoptotic cells in flow cytometry. During a 24-hour culture period, the MiCK assay and TLVM provided multiple consecutive appraisals of nondisturbed cell microcultures at intervals of 5 and 2.5 minutes, respectively, and thus could be considered as real time kinetic assays. With the three endpoint assays, each of which was applied 12 times at 2-hour intervals, maximum apoptotic responses varied from 22.5 to 72% in etoposide-treated cells and from 30 to 57% in cisplatin-treated cells. With the annexin V binding assay, maximum apoptosis could always be detected 4 to 5 hours earlier than it was seen in Giemsa-stained preparations and 8 hours earlier than it was detected by measuring of DNA fragmentation. Values of the maximum extent of apoptosis varied, being the lowest with annexin V and the greatest with DNA fragmentation assays. The best correlations of both extent and timing of apoptosis were observed between the MiCK, TLVM, and morphological assays. In conclusion, both a maximum apoptotic response and the time at which it was achieved are the obligatory requirements for determining the apoptosis-inducing potency of an agent and for comparing results of studies performed in different laboratories.
Apoptosis is a form of cell death which occurs in both physiological and pathological conditions. The realization that induction of apoptosis in tumor cells is a key mechanism by which chemotherapeutic drugs cause tumor regression has raised interest in the in vitro measurement of drug-induced apoptosis to test for tumor cell chemosensitivity. 1-6
Apoptosis can best be described as a sequence of morphological events that includes cell shrinkage, formation of the plasma membrane protrusions, or blebs, nuclear fragmentation, formation of apoptotic bodies, and eventual cell disintegration. 7-10 Over the last 25 years, several molecular events accompanying apoptosis have been discovered. These include internucleosomal DNA fragmentation, 11 alterations in the mitochondrial structures, 12 loss of the plasma membrane phospholipid asymmetry, 13,14 and caspase activation. 15 A majority of apoptosis assays are based on detecting morphological evidence of apoptosis or visualization of products of internucleosomal DNA cleavage. 7,8,11,16,17 Other tests rely on measuring subG1 DNA content in cells, 18 binding of annexin V to phosphatidylserine residues exposed on the outer surface of the plasma membrane, 19 or activation of caspases. 20 Recently, we have applied an automated microculture kinetic (MiCK) assay 21 to monitor changes in optical density (OD) of cells undergoing apoptosis 22 and demonstrated applicability of this assay to the measurement of drug-induced apoptosis in leukemias. 23
In our previous studies, the MiCK assay was compared with morphological, DNA fragmentation, and annexin V tests. 22,23 Whenever apoptotic cells were detected by the MiCK assay, their presence was confirmed by these standard techniques. However, the extent of apoptosis varied depending on the assay method used and the time point at which cultures were assessed. All apoptosis assays used for comparisons with the MiCK assay were endpoint tests that evaluated a fraction of cells bearing an assay-specific apoptosis marker at an arbitrarily chosen time point. Conversely, the MiCK assay of apoptosis is a real-time kinetic test that utilizes cell membrane blebbing as an indicator of apoptosis and provides an integrative analysis for the multiple occurrences of single cell apoptosis over the entire culture period. 23 These methodological differences imply that direct comparisons between endpoint assays and the MiCK assay in measuring apoptosis may not always be feasible.
In this study, changes in the OD of the cultures undergoing apoptosis were compared with direct observation of apoptosis by means of time-lapse video microscopy (TLVM). The latter technique is similar to the MiCK assay in that it enables real time observation of apoptosis-related morphological changes in cell cultures. The plasma membrane blebbing, an early event in apoptosis, can easily be observed by light microscopy, thus enabling the determination of the percentages of apoptotic cells in sequential frames taken at frequent intervals. Plotting these data against time allows for a real-time kinetic analysis of apoptosis which is not feasible with endpoint tests. To induce apoptosis, promyelocytic HL-60 cells were exposed to two chemotherapeutic compounds with different mechanisms of action, the topoisomerase II inhibitor epipodophyllotoxin etoposide and the intercalating agent cis-diamminedichloroplatinum (II) (cisplatin).
The TLVM data showed that in cell cultures undergoing apoptosis, both timing and rate of accumulation of cells with the plasma membrane distortions correlated with the timing and rate of the OD increase as determined by the MiCK assay. Flow cytometry studies of the light-scattering properties of the cells demonstrated an increase in side scattering of the light when steep increases of the OD were detected in cultures by the MiCK assay. Taken together, the TLVM and flow cytometry studies confirmed that early morphological modifications of apoptosis are responsible for the steep OD increases in cell cultures undergoing apoptosis. Comparisons were made between the results of analyses of apoptosis by the MiCK and TLVM assays and those by the three endpoint assays of DNA fragmentation, annexin V binding, and morphological evidence of apoptosis in Giemsa-stained cells.
Materials and Methods
Cells
Human HL-60 acute promyelocytic leukemia cells (American Type Culture Collection, Manassas, VA) were maintained in RPMI-1640 medium without phenol red and supplemented with 10% heat-inactivated fetal bovine serum (FBS, Hyclone, Logan, UT), 100 U/ml penicillin and 100 μg/ml streptomycin (complete medium) in completely humidified air with 5% CO2 at 37°C. The cultures were diluted every third day to a concentration of 5 × 10 5 cells/ml. Before use, exponentially growing cells were harvested, washed with prewarmed RPMI-1640 medium, and resuspended at required concentrations in complete medium. Cell counts and viability were determined using a hemocytometer and trypan blue dye exclusion.
MiCK Assay for Apoptosis
The MiCK assay for apoptosis was performed as described previously, 22 with minor modifications. Cells were suspended in complete medium at 2 × 10 5 cells/ml, plated in 240-μl aliquots in a 96-well micro titer plate (Corning-Costar, Cambridge, MA), and incubated in a fully humidified atmosphere of 5% CO2 for 60 minutes. Next, appropriate dilutions of etoposide and cisplatin were added to wells in 10-μl aliquots to achieve final concentrations of 1, 2.5, 5, 10, and 20 μmol/L. After incubation at 37°C for 30 minutes in a completely humidified atmosphere of 5% CO2 in air, 50 μl of sterile mineral oil (Sigma, St. Louis, MO) were layered on the top of each microculture. The microtiter plate was then placed in the incubated chamber of a spectrophotometer (SPECTRAmax 340, Molecular Devices Corp., Sunnyvale, CA), incubated at 37°C, and the OD at 600 nm was read every 5 minutes for a period of 24 hours. The reader was calibrated to zero absorbance using wells containing only complete medium without cells. The extent of apoptosis was expressed as both kinetic units (KU) of apoptosis and percentage of apoptotic cells using the methods described previously. 23
Timing of Apoptosis in the MiCK Assay
The OD-versus-time curve produced by the MiCK assay consisted of several segments used to determine the timing of apoptosis. 23 The time to the maximum response (Tm) is the period between the beginning of exposure of cells to the chemotherapeutic agent and the maximum OD. The Tm indicates the time of drug exposure at which a maximum proportion of cells display morphological evidence of apoptosis. The Tm consists of two components, the initiation time (Ti) and development time (Td). The Ti is the time from the beginning of the exposure of cells to the chemotherapeutic agent being tested until the beginning of the rapidly rising segment of the OD-versus-time curve. The Td is the period from the beginning of the rapidly rising segment until the maximum OD.
Time-Lapse Video Microscopy
Cells at 2 × 10 5 cells/ml were plated in 240 μl in a well of a 96-well microtiter plate and incubated for 1 hour in a fully humidified atmosphere of 5% CO2. A 10-μl aliquot of the appropriate drug was added to the well at the indicated concentration and 50 μl of sterilized mineral oil were layered on top of the medium to prevent liquid evaporation and CO2 escape. Next, the plate was placed in a 37°C plastic culture chamber fitted to a Nikon Diaphot Microscope (Nikon Inc., Melville, NY). A field with about 150 cells was selected and observed under either phase or Nomarski optics. Sequential images were collected at 2.5-minute intervals over a 24-hour period. Cells with the visible membrane protrusions were counted in consecutive frames and their proportions were expressed as percentages of the total number of cells.
Flow Cytometry Light Scattering Measurements
Cell aliquots were collected at multiple time points of drug exposure and maintained at 5 × 10 5 cells/ml in RPMI medium without phenol red at 4°C. Ten thousand cells per sample were analyzed for forward and side light scattering using a FACSCalibur Analyzer (Becton-Dickinson, San Jose, CA) equipped with an argon-ion laser with excitation at 488 nm. Cell debris was excluded by an appropriate forward light-scatter threshold setting.
Fluorescein-Conjugated Annexin V Binding Assay
The assay was performed as described previously. 23 Briefly, at different times of drug exposure, cells were labeled with Annexin-V-fluorescein isothiocyanate (FITC) conjugate and propidium iodide (PI) using an Apoptosis Detection Kit (R&D Systems, Minneapolis, MN). After labeling, cells were resuspended in binding buffer and analyzed using the FACSCalibur Analyzer. FITC fluorescence was measured at 530–545 nm and fluorescence of DNA-PI complexes at 575–606 nm. Cell debris was excluded from analysis by appropriate forward light scatter threshold setting. Five thousand cells were analyzed in each condition. Four quadrants of the cytograms were set using negative controls. Proportions of cells in each quadrant were expressed as the percentage of the total population. 23 Lower left quadrants of the cytograms showed viable, An−PI− cells. Lower right quadrants showed early apoptotic cells with preserved plasma membrane integrity (An+PI−). Upper right quadrants showed cells which have lost their plasma membrane integrity and became An+PI+.
Cell Morphology
Percentages of cells with morphological evidence of apoptosis were counted in Giemsa-stained cytospin preparations of control and drug-treated cultures. A total of 200 cells was counted on each preparation. Apoptotic cells were identified by plasma membrane protrusions, aggregated chromatin, fragmented nuclei, and condensed basophilic cytoplasm. 22,23
Electrophoretic Analysis and Quantitation of DNA Fragmentation
Cells were exposed to 10 μmol/L etoposide or 5 μmol/L cisplatin for various periods of time, harvested, washed twice in cold Tris-buffered saline (TBS), and incubated at 37°C for 1 hour in lysis buffer (10 mmol/L Tris-HCl, pH 8.0, 100 mmol/L EDTA, pH 8.0, 20 mg/ml RNase A, 0.5% sodium dodecyl sulfate). Cell lysates were incubated at 50°C overnight in the presence of 50 mg/ml proteinase K. DNA was extracted with an equal volume of Tris buffer-saturated phenol-chloroform (1:1). The extraction was repeated three times, and after the third extraction the aqueous phase was mixed with 0.2 volume of 10 mol/L ammonium acetate followed by addition of 2 volumes of absolute ethanol. After 15 minutes at −70°C, precipitated DNA was dried, resuspended in Tris-EDTA buffer (10 mmol/L Tris-HCl and 1 mmol/L EDTA) and DNA concentrations were determined from the absorbance at 260 nm. One microgram of DNA from each sample was separated on 1.5% agarose gels in Tris-phosphate electrophoresis buffer, pH 8.0, containing 0.5 mg/ml ethidium bromide. For quantitation of DNA fragmentation, densitometric analysis of a digital image of the agarose gel was performed using the IS-1000 Digital Imaging System (Alpha Innotech Corp., San Leandro, CA). Unloaded lanes were used to measure background fluorescence.
Statistics and Graphics
Linear regression analyses of slopes of the apoptotic OD-versus-time curves as well as all graphics and other statistics were performed using Origin Scientific Software (MicroCal Software, Inc., Northampton, MA). Images were captured using Bioquant Image Analysis Software (Bioquant Corp., Nashville, TN)
Results
MiCK Assay of Drug-Induced Apoptosis in HL-60 Cells
Promyelocytic HL-60 cells have previously been shown to undergo apoptosis on exposure to both etoposide 24,25 and cisplatin. 26,27 In the present study, the MiCK assay was used for 24-hour monitoring of apoptosis in HL-60 cells exposed to 1, 2.5, 5, 10, and 20 μmol/L of either drug. In the MiCK assay, apoptosis is indicated by a steep OD increase which exceeds the rise in the OD observed in the control culture over the same time interval; the net slope of the steep rising portion of the apoptotic curve is proportional to the percentage of apoptosis. 22,23
All doses of etoposide and the four highest doses of cisplatin induced apoptosis in HL-60 cells within 24 hours of drug exposure (Figure 1 ▶ and Table 1 ▶ ). Increases in the concentrations of either drug were followed by a gradual increase in the extent of apoptosis and shortening of the time to the maximum response (Figure 1) ▶ . At 1 μmol/L etoposide, a weak apoptotic response of 0.4 KU (6.4% apoptotic cells) could be detected with a maximum at 23.5 hours, whereas 20 μmol/L etoposide caused apoptosis response of 9.6 KU (62% apoptotic cells) with a maximum at 7 hours (Figure 1A) ▶ . In HL-60 cells exposed to 1 μmol/L cisplatin, apoptosis could not be detected within 24 hours, whereas 2.5 μmol/L cisplatin caused an apoptosis response of 4.1 KU (30% apoptotic cells) with a maximum by 22.5 hours (Figure 1B) ▶ . As with etoposide, an increase in concentration of cisplatin was followed by an increase in the proportion of apoptotic cells and a substantial shortening the time to the maximum response (Figure 1B ▶ and Table 1 ▶ ).
Figure 1.
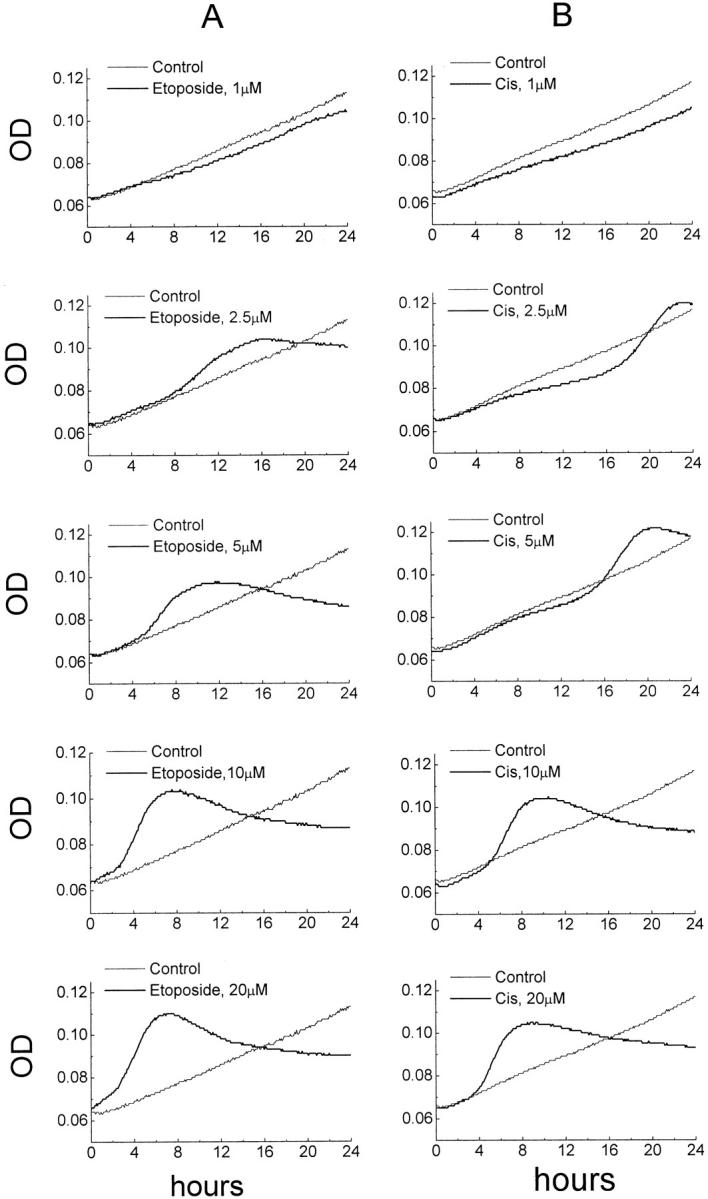
Dose-response effects of etoposide (column A) and cisplatin (column B) in the MiCK assay of apoptosis. HL-60 cells were plated in complete medium with various concentrations of either etoposide or cisplatin added to the cells at the initiation of the cultures. OD of the cultures at 600 nm were measured every 5 minutes for 24 hours. Graphs of OD plotted against time of culture in hours are shown. In each graph, the drug-treated culture is shown as a heavy line and an untreated control culture is shown as a thin line. Results of one representative experiment of three performed with each drug are shown.
Table 1.
Dose-Response Effects of Etoposide and Cisplatin on the Extent and Timing of Apoptosis in HL-60 Cells
| Apoptosis parameters | Etoposide (μmol/L) | cis-Platinum (μmol/L) | ||||||||
|---|---|---|---|---|---|---|---|---|---|---|
| 1 | 2.5 | 5 | 10 | 20 | 1 | 2.5 | 5 | 10 | 20 | |
| Extent KU (%) | 0.4 (6.4) | 2.7 (20) | 5.3 (36) | 9.4 (61) | 9.6 (62) | ND | 4.1 (29) | 5.9 (40) | 9.0 (58) | 9.9 (64) |
| Tm (h) | 23.5 | 15.5 | 10.5 | 8.0 | 6.9 | — | 22.6 | 20.2 | 9.1 | 7.5 |
| Ti (h) | 14.0 | 8.5 | 5.2 | 4.0 | 3.25 | — | 18.5 | 15.75 | 5.5 | 4.25 |
| Td (h) | 9.5 | 7.5 | 5.3 | 4.0 | 3.5 | — | 4.1 | 4.45 | 3.6 | 3.25 |
All values are calculated from the MiCK assay results shown in Figure 1 ▶ . Extent of apoptosis is expressed in both kinetic units (KU) and percentage of morphologically apoptotic cells (shown in parentheses) determined from KU as described previously. 23 Time to maximal apoptosis (Tm), initiation time (Ti), and development time (Td) were determined as described in Materials and Methods. ND, not determined.
The duration of both Ti and Td varied greatly depending on the type of the drug as well as the drug concentrations (Table 1) ▶ . Increases in doses of etoposide from 1 to 20 μmol/L and cisplatin from 2.5 to 20 μmol/L resulted in shortening of Ti by 80% in both cases. However, at 2.5 and 5 μmol/L, the Ti was 10 hours and 9 hours longer, respectively, in cisplatin-treated cells as compared to the cells exposed to the same doses of etoposide (Table 1) ▶ . At 10 and 20 μmol/L, the differences in Ti between cells exposed to the two drugs still existed, but to a much lesser degree (Table 1) ▶ . Td in etoposide-treated cultures was 3 times longer at 1 μmol/L as compared to 20 μmol/L, whereas in cisplatin-treated cells the duration of Td at 2.5 μmol/L was only 1.3 times longer than it was at 20 μmol/L (Table 1) ▶ . As opposed to the duration of Ti, at the same dosages of the two drugs, Td was always shorter in cisplatin-treated cells. The shortest Td of 3.25 hours was observed in cells exposed to 20 μmol/L cisplatin (Figure 1B ▶ and Table 1 ▶ ).
Comparisons between the MiCK Assay and Time-Lapse Video Microscopy Studies of Apoptosis
Comparisons between the MiCK assay and TLVM were made for cells exposed to 10 μmol/L etoposide and 5 μmol/L cisplatin, two treatments that resulted in substantially different extent and timing of apoptosis (Figure 1 ▶ and Table 1 ▶ ). In the MiCK assay, 10 μmol/L etoposide induced an apoptotic response of 9.4 KU (61% apoptotic cells) with a Tm of 8 hours and both Ti and Td of 4 hours (Figure 2A ▶ and Table 1 ▶ ). Over the initial 2-hour culture, a minor OD increase was seen which gradually became steeper between 2 and 4 hours (Figure 2A) ▶ . Between 4 and 7 hours of culture, the steepest increase in the OD was observed at an almost linear rate (r = 0.994). Between 7 and 8 hours, the OD increased at a slower rate, merging with a short OD plateau which lasted until 9.5 hours of culture (Figure 2A) ▶ . The plateau was followed by a gradual OD decline which slowed even more after 16 hours (Figure 2A) ▶ . Until the end of the assay (24 hours), the OD value remained elevated compared to its value at 0 hours.
Figure 2.
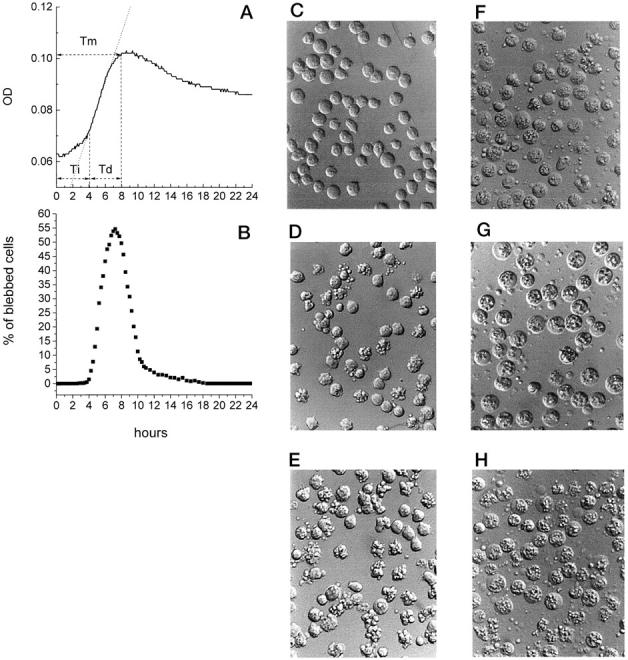
Comparison of the MiCK assay and TLVM of HL-60 cells exposed to etoposide. HL-60 cells were cultured with 10 μmol/L etoposide in complete medium for 24 hours. The cell cultures were analyzed by (A) MiCK assay for changes in OD and (B) the TLVM for percentages of blebbed cells (shown at 15-minute intervals). In A, time to the maximum apoptotic response (Tm), initiation time (Ti), development time (Td), and best-fit line (dotted line) of the increasing portion of the OD-versus-time curve are presented. Results of one representative experiment of three performed are shown. Phase contrast photomicrographs of cell culture were taken at the following times of exposure to etoposide: C, 2.5 hours; D, 4.2 hours; E, 7.25 hours; F, 12 hours; G, 16 hours; H, 24 hours. Original magnification, ×200.
Morphological analysis of cells with consecutive 2.5-minute interval frames demonstrated that up to 2.5 hours of culture no cells showed blebbed plasma membranes (Figure 2, B and C) ▶ . After 2.5 hours of drug exposure, an increase in the proportion of blebbed cells was observed which progressed between 4.2 and 7.25 hours with the maximum of blebbed cells at 7.25 hours (54.6%; Figure 2, B, D, and E ▶ ). Between 4.5 and 6.25 hours of drug exposure, the proportion of blebbed cells increased at a uniform, almost linear rate of 21.5% of the total cell number per hour (r = 0.997). Between 6.25 and 7.25 hours, the proportion of blebbed cells continued to increase at a slower rate reaching a short plateau (which appears as a peak in Figure 2B ▶ because only every sixth time point is shown), followed by an abrupt fall in the proportion of blebbed cells (Figure 2B) ▶ . At 12 hours, blebbed cells comprised only 5% of the population and continued to decline further (Figure 2, B and F) ▶ . At this time, the cell population mainly consisted of rounded cells with granular inclusions, which are referred to as residual apoptotic bodies (Figure 2F) ▶ . In addition to residual apoptotic bodies, a number of small cell fragments could also be seen in the cultures (Figure 2G) ▶ . At 16 hours and especially at 24 hours, most of residual apoptotic bodies acquired the morphological appearance of secondarily necrotic cells with swollen cytoplasm and prominent inner granularity (Figure 2, G and H) ▶ . Some of them were present in the cultures even at 36 hours of drug exposure (not shown). At these late times, necrotic cells coexisted with an increased number of cell fragments and cell debris (Figure 2H) ▶ .
In the MiCK assay, cells exposed to 5 μmol/L cisplatin showed an apoptotic response of 5.9 KU (40% apoptotic cells) with Tm of 20.2 hours, Ti of 15.75 hours, and Td of 4.45 hours (Figure 3A ▶ and Table 1 ▶ ). Over the initial 9 hours, a gradual OD increase was seen in the culture. The period between 9 and 14.5 hours was remarkable for an OD increase at a rate which was slower than either the rate of OD increase over the initial 9 hours or the rate of the OD increase between 14.5 and 21 hours. Between 16 and 19 hours of culture, the steepest increase in the OD was observed (r = 0.997). After 19 hours, the increase in OD slowed, with the curve merging with a short plateau at 20.2 hours. Between 21 and 24 hours, the OD declined gradually (Figure 3A) ▶ .
Figure 3.
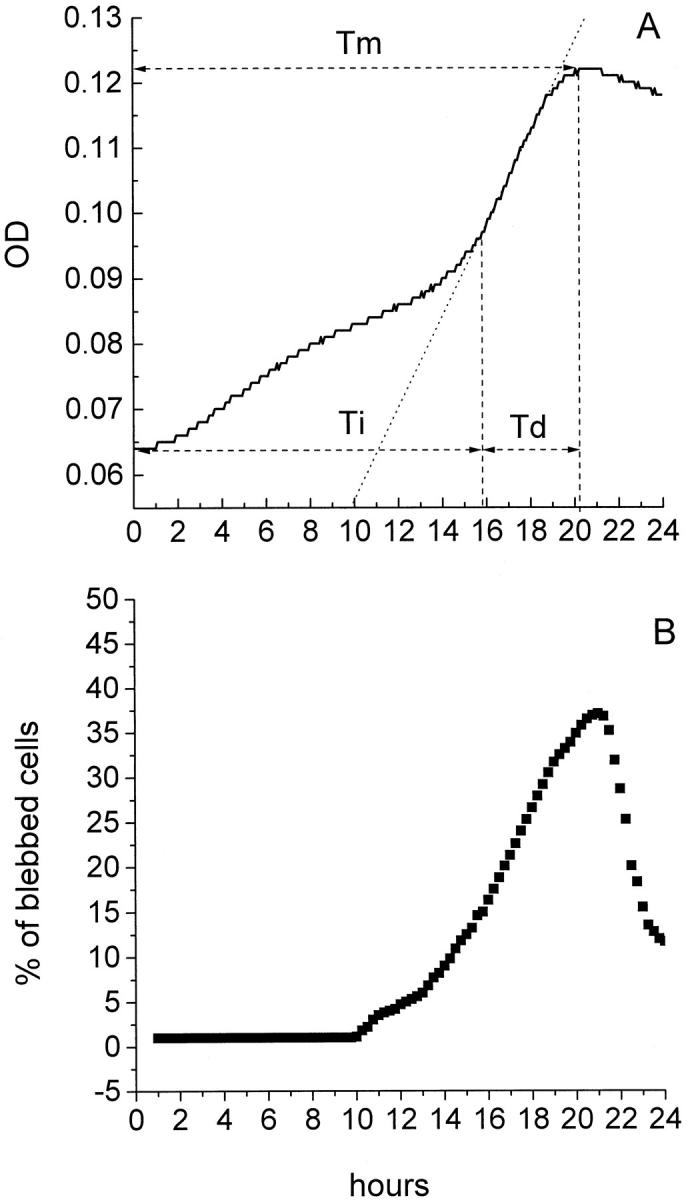
Comparison of the MiCK assay and TLVM of HL-60 cells exposed to cisplatin. HL-60 cells were cultured with 5 μmol/L cisplatin in complete medium for 24 hours. The cell cultures were analyzed by (A) MiCK assay for changes in OD and (B) the TLVM for percentages of blebbed cells. In A, time to the maximum apoptotic response (Tm), initiation time (Ti), development time (Td), and best fit line (dotted line) of the rapidly increasing portion of the OD-versus-time curve are shown. Results of one representative experiment of three performed are presented.
In TLVM, no blebbed cells were noticed until about 10 hours’ exposure of cells to 5 μmol/L cisplatin (Figure 3B) ▶ . Within this 10-hour period, cells continued to proliferate. The final step of cell division (cytokinesis) with two resulting daughter cells could clearly be seen in consecutive frames (not shown). Counting cell numbers with a hemocytometer demonstrated a 1.5-fold increase in the cellularity over initial 10-hour period with 92% viable cells in the culture. The observed increase in cellularity corresponded to a steady increase in the OD over the same period of time (Figure 3A) ▶ . Between 10.2 and 13.5 hours, the percentage of blebbed cells increased at a slow rate, which was then accelerated between 13.5 and 16 hours. No dividing cells were revealed between 10 and 13.5 hours, suggesting that the slow OD increase over this period reflected a moderate increase in the proportion of blebbed cells from 0 to 8.5% (Figure 3, A and B) ▶ . Between 16 and 19 hours, the steepest increase in the proportion of blebbed cells was observed at a uniform rate of 5.1% of the total cell number per hour (r = 0.998) (Figure 3B) ▶ . After 19 hours, the proportion of blebbed cells continued to increase at a slower rate, reaching a maximum of 38% at 21.5 hours (Figure 3B) ▶ . Next, an abrupt decrease in their proportion was observed, with only 11.5% of blebbed cells present at 24 hours (Figure 3B) ▶ .
Despite the substantial differences in timing, apoptosis-related morphological changes in cells exposed to 5 μmol/L cisplatin were similar to those of cells treated with hours 10 μmol/L etoposide, which are shown in Figure 2, C–H ▶ . A decline in the proportion of blebbed cells after the maximum was accompanied by accumulation of rounded residual apoptotic bodies, small cell fragments and, at 24 and 36 hours, cells with necrotic morphology (not shown).
Frame-by-Frame Analysis of a Single Cell Apoptosis
Morphological changes in a single cell undergoing apoptosis on exposure to 10 μmol/L etoposide were monitored between 0 hours and 15 hours of culture (Figure 4) ▶ . Over the first 3.5 hours, the cell displayed no visible morphological changes (Figure 4A) ▶ . At 3.5 hours, a slight reduction in cell size was noticed with a minor ruffling of the plasma membrane (Figure 4B) ▶ . Formation of the plasma membrane protrusions was initiated at 4.12 hours (Figure 4C) ▶ with a full extent of blebbing achieved by 4.32 hours, ie, within 12 minutes (Figure 4D) ▶ . Once developed, the blebbed stage could be observed in the cell until 6.75 hours of culture. During this period, both cell geometry and size of the membrane protrusions were constantly changing. The cell pictured at 6.75 hours (Figure 4E) ▶ displayed prominent membrane blebs; however, the blebs were of a smaller caliber than found in the cell at 4.32 hours (Figure 4D) ▶ . After this time, the cell underwent the process which we designate as shedding of the blebs (Figure 4F) ▶ . During this stage, blebs, previously distributed evenly over the entire surface of the cells, gradually acquired regularly rounded shape and started to detach from the parental cell. This shedding stage required 12 minutes to complete, resulting in multiple membrane-bound cell fragments surrounding a large single residual apoptotic body (Figure 4G) ▶ . The cell fragments were of different sizes and located at different distances from the residual apoptotic body. Until 8.75 hours, a gradual detachment of the cell fragments from the residual body could be observed (Figure 4H) ▶ . After 8.75 hours, the content of the residual cell mass started to swell, its contour becoming less distinguishable, and by 8.83 hours (ie, within 5 minutes) it acquired the appearance of a necrotic cell with transparent swollen cytoplasm containing granular material (Figure 4I) ▶ . The known apoptotic history of this cell’s death permitted its designation as a secondarily necrotic cell. It persisted in culture until 15 hours, after which time the cell boundaries became indistinguishable (not shown). Necrotic cells with swollen and granular cytoplasm comprised a majority of the culture at 16 to 24 hours (Figure 2, D ▶ -F). They were trypan blue-positive and in cytospin preparations made after 16 hours of drug exposure they always appeared as cellular debris.
Figure 4.
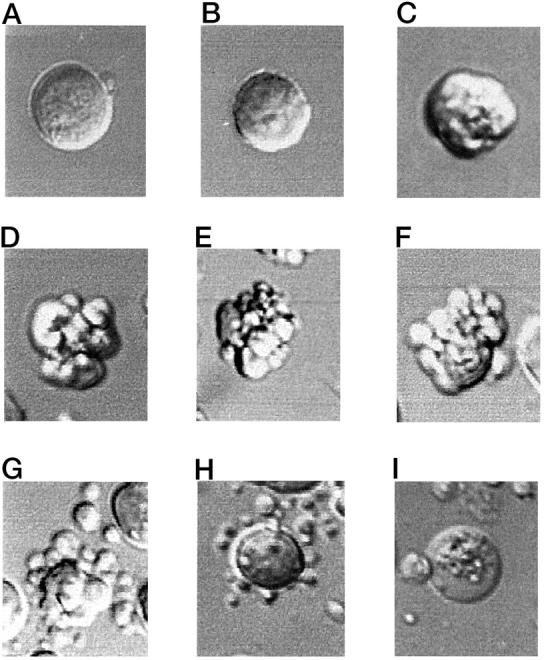
Sequential morphological modifications during a single cell apoptosis recorded by TLVM. A single cell from the culture exposed to 10 μmol/L etoposide is shown at various time points during the process of apoptosis. Time points are: A, 0.0 hours; B, 3.5 hours; C, 4.12 hours; D, 4.32 hours; E, 6.75 hours; F, 6.8 hours; G, 7.0 hours; H, 8.75 hours; I 8.83 hours. Original magnification, ×400. See text for descriptions.
Frame-by-frame analysis of morphological changes in another 14 individual cells showed that cells were entering apoptosis in an asynchronous manner, the shortest time until the stage of blebbing being 2.5 hours and the longest time being 7.2 hours. On average, cells required 8.2 ± 1.3 minutes for complete development of the plasma membrane blebs. The blebbed stage lasted for 3.4 ± 0.8 hours, after which time the shedding stage was initiated and completed within 15.2 ± 3.5 minutes. Large residual apoptotic bodies surrounded by varying numbers of the cell fragments, once formed, could be observed for 5.6 ± 1.5 hours before they started to swell. The swelling stage required 4.0 ± 1.5 minutes to complete. The duration of the stage of secondary necrosis varied greatly from 2 to 24 hours, with a substantial proportion of necrotic cells seen even at 36 hours of culture (not shown).
Flow Cytometry Studies of the Light-Scattering Properties of the Cells
To relate the morphological changes of apoptosis described above to changes in the optical properties of the cultures, flow cytometry analysis of forward and side light-scattering properties of the cells was performed. Light-scattering properties of HL-60 cells were studied at multiple time points during exposure of the cells to 10 μmol/L etoposide and 5 μmol/L cisplatin. In control cultures, four subsets of cells, which were designated as quadrants R1, R2, R3, and R4, could be defined by the combination of light-scattering properties of cells (Figure 5) ▶ . The vast majority of viable cells with relatively uniform light-scattering properties were located in quadrant R1 of the cytogram. A small proportion of cells displaying a decreased forward light-scattering was located in the quadrant R3. Presence of these cells in control cultures could be due to both the natural polymorphism of the cell population, with smallest cells located in R3 and shrinkage of cells undergoing spontaneous apoptosis. Quadrants 2 and 4 contained cells with increased side scattering and either normal (R2) or decreased (R4) forward scattering, ie, the properties suggestive for apoptotic cells with blebbed plasma membranes, fragmented nuclei, and increased granularity. In control cell cultures, cells in quadrants 2, 3, and 4 together comprised less than 4% of the total population. This number was similar to the percentage of HL-60 cells undergoing spontaneous apoptosis as determined in Giemsa-stained preparations.
Figure 5.
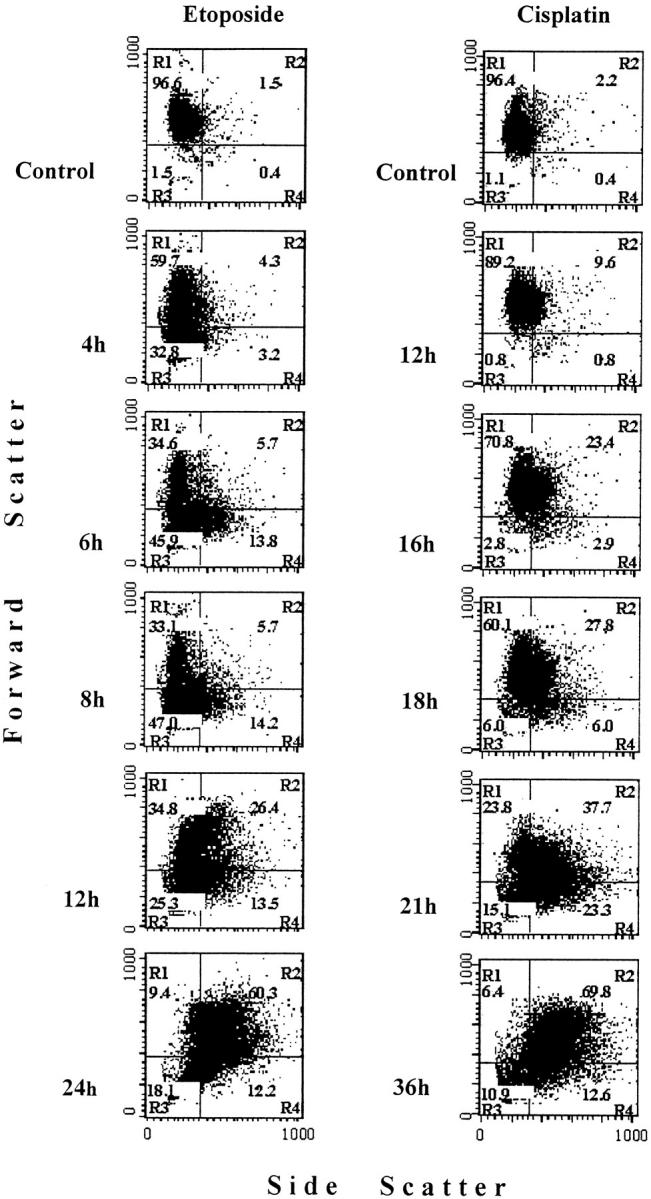
Changes in the forward and side scattering of the light by HL-60 cells during apoptosis. Cells were cultured in complete medium for 24 hours with 10 μmol/L etoposide or for 36 hours with 5 μmol/L cisplatin. At indicated times of culture, aliquots of cells were removed and analyzed by flow cytometry for light scattering properties as described in Materials and Methods. The data presented are bivariate cytograms of 10,000 events. Quadrants R1, R2, R3, and R4 were set using control (0 hour) cultures in which more than 96% of events were located in quadrant R1. The percentages of events in each quadrant are shown.
In etoposide-treated cultures at 1, 2, and 3 hours of incubation, there were no significant changes in scattering properties of the cells (not shown). At 4 hours, an increase in the proportion of cells with decreased forward scattering (R3) was noticed which lasted until 8 hours of culture (Figure 5) ▶ . Accumulation of cells with an increased side scatttering and decreased forward scattering (R4) was first seen at 4 hours and became even more evident at 6 and 8 hours (Figure 5) ▶ . Between 4 and 6 hours, a 4.3-fold increase in the proportion of cells in R4 was detected as compared to only 1.4-fold increase in the proportion of cells in R3. This indicates the increase in side scattering of the light as the main event detected by flow cytometry over the period between 4 and 6 hours of culture, ie, the time when the steepest rate of the OD rise was seen in the MiCK assay (Figure 2A) ▶ and the most intensive increase in percentage of blebbed cells was found in TLVM (Figure 2B) ▶ . The main event revealed by flow cytometry at 12 and 24 hours of culture was the accumulation of cells in R2 with concomitant loss of cells in R1. This progressive shift of cells to R2 correlated with accumulation in cultures of secondarily necrotic cells with granular inclusions (Figure 2, G and H) ▶ .
In cisplatin-treated cultures, changes in scattering of the light were first seen at 12 hours incubation (Figure 5) ▶ . As time elapsed, a modest increase in number of cells in R3 could be detected; however, the major event in the culture was an increase in side light-scattering properties of the cells (Figure 5) ▶ . Between 12 and 16 hours, cells were accumulating in both R2 and R4 but mainly in R2. However, between 16 and 21 hours, ie, at the time of the steepest OD increase reported by the MICK assay (Figures 5 and 3A) ▶ ▶ , an eightfold increase in cell number was detected in R4 as compared to only 1.6-fold increase in R2 (Figure 5) ▶ . At 36 hours, majority of the cells were shifted to R2 with a concomitant reduction in the proportion of cells in other quadrants (Figure 5) ▶ .
DNA Fragmentation, Annexin V Binding, and Morphological Assays
These three standard endpoint techniques for measuring apoptosis were applied to HL-60 cells at multiple time points of their exposure to 10 μmol/L etoposide or 5 μmol/L cisplatin.
Double labeling of the cells with Annexin V-FITC and PI helped to distinguish the early apoptotic cells (An+PI−) from the cells with lost plasma membrane integrity (An+PI+). The percentages of An+PI− cells at multiple times of exposure to each of the drugs were compared with quantitative data on DNA cleavage and the percentages of cells with morphological evidence of apoptosis as detected in Giemsa-stained preparations (Figure 6) ▶ .
Figure 6.

Comparisons between the results of Annexin V binding assay, DNA fragmentation and morphological tests in studying apoptosis in HL-60 cells. Cells were cultured in complete medium for 24 hours with 10 μmol/L etoposide or for 36 hours with 5 μmol/L cisplatin. At indicated times of culture, extent of apoptosis was determined using the three endpoint assays. In Annexin V binding assay, extent of apoptosis was determined as the percentage of early apoptotic cells with preserved plasma membrane integrity (An+PI−). The percentage of DNA fragmentation was determined by densitometric analysis of a digital image of the gel shown in Figure 7 ▶ . Results of one representative experiment of three performed are shown.
In etoposide-treated cultures, a maximum proportion of An+PI− cells (22.5%) was detected at 4 hours of drug exposure (Figure 6) ▶ . Between 4 and 8 hours, a gradual decline in early apoptotic cells was observed; between 8 and 12 hours, the proportion of An+PI− cells dropped abruptly and remained at this low level until 24 hours. In cisplatin-treated cultures, the proportion of the An+PI− cells peaked at 16 hours (28.9%), gradually declined until 24 hours, and then abruptly fell by 36 hours (Figure 6) ▶ . With either drug, abrupt decreases in An+PI− cells were accompanied by increases in the proportions of An+PI+ cells (not shown).
Results of electrophoretic separation of DNA extracted from cells at various time points are shown in Figure 7 ▶ . The ladder-like pattern of internucleosomal DNA cleavage is seen in etoposide-treated cells between 4 and 16 hours of drug exposure and in cisplatin-treated cells between 12 and 36 hours. Densitometric analyses of the digital images of the gel were performed to determine the proportion of fragmented DNA as a percentage of the total DNA (Figure 6) ▶ . In etoposide-treated cells, the percentage of fragmented DNA gradually increased, reaching its maximum of about 72% at 12 and 16 hours and then declining to 30% at 24 hours (Figure 6A) ▶ . In cisplatin-treated cells (Figure 6B) ▶ , a maximum proportion of fragmented DNA (57%) was observed at 24 hours, followed by its decline to 43% at 36 hours of culture.
Figure 7.

Agarose gel analysis of DNA fragmentation in HL-60 cells exposed to 10 μmol/L etoposide and 5 μmol/L cisplatin. Cells were cultured in complete medium for 24 hours with 10 μmol/L etoposide or for 36 hours with 5 μmol/L cisplatin. At indicated times of culture, aliquots of cells were removed, DNA extracted, purified and separated on 1.5% agarose gel as described in Materials and Methods. Molecular weight markers (FMC Bioproducts, Rockland, ME) are shown in the first and last lanes. DNA with size of ≥21 kbp was considered intact; all DNA <21 Kbp was considered as fragmented. 49 The time points and treatment for cells are shown atop the lanes.
Studies of the emergence of cells with apoptotic morphology in etoposide-treated cultures showed that after 4 hours, the proportion of apoptotic cells increased abruptly, with the maximum of 64% at 8 hours, and then declined to less than 5% at 16 and 24 hours. At 16- and 24-hour time points, more than 90% of cells were trypan blue-positive, whereas in Giemsa-stained preparations they had the appearance of cell debris (not shown). In cisplatin-treated cells, a 16-hour lag period elapsed before the proportion of apoptotic cells started to increase in the culture (Figure 6B) ▶ . The maximum percentage of morphologically apoptotic cells (35%) was seen at 21 hours and then was followed by its decline to 19.5% and 4.2% by 24 and 36 hours of exposure, respectively (Figure 6B) ▶ .
In Table 2 ▶ , results of studies of etoposide- and cisplatin-induced apoptosis with these three endpoint assays are shown in comparison with the results of the two kinetic tests, the TLVM and the MiCK assay.
Table 2.
Apoptotic Responses Measured by Five Different Assays
| Apoptosis assay | Etoposide 10 μmol/L | Cisplatin 5 μmol/L | ||
|---|---|---|---|---|
| Max apoptosis | Time to max apoptosis (h) | Max apoptosis | Time to max apoptosis (h) | |
| Annexin V | 22.5% | 4 | 28.9% | 16 |
| DNA | 72% | 12 | 57% | 24 |
| Morphology | 64% | 8 | 35% | 21 |
| TLVM | 54.6% | 7.25 | 38% | 21.5 |
| MiCK | 9.4 KU (61%) | 8 | 5.9 KU (40%) | 20.2 |
Maximum apoptotic responses (Max Apoptosis) and times to maximum apoptotic responses as determined with five apoptosis assays for HL-60 cells exposed to 10 μmol/L etoposide and 5 μmol/L cisplatin. Results of one representative experiment of three performed with each assay are shown. Extent of apoptosis measured in the MiCK assay expressed in both kinetic units (KU) and percentage of morphologically apoptotic cells (shown in parentheses) determined from KU as described previously. 23
Discussion
The MiCK assay has recently been adapted for automated monitoring of apoptotic responses in cell cultures exposed to various cell death inducers. 22,23 In the original description, 22 cellular morphological modifications were suggested as the cause of the characteristic changes in the optical properties of cell cultures during apoptosis. Particularly, a rapid OD increase, which indicates apoptosis in the MiCK assay, was suggested to be the result of changes in the light-scattering properties of the cells due to the plasma membrane blebbing. The present study was undertaken to relate directly the OD changes in apoptotic cell cultures, as measured by the MiCK assay, to sequential changes in morphological and light-scattering properties of the cells. We also aimed to make comparisons between the kinetic and endpoint assays currently used to study apoptosis in vitro.
The promyelocytic HL-60 leukemia cell line is a well established model that has previously been used in studies of apoptosis induced by the two chemotherapeutic agents, etoposide and cisplatin. 24-27 Etoposide, which is most effective against cells in the S and G2 phases of the cell cycle, forms a ternary complex with topoisomerase II and DNA, resulting in double-stranded DNA breaks. 28,29 Cisplatin causes both intrastrand and interstrand cross-linking of DNA, leading to the inhibition of DNA replication and DNA breakage. 30,31 Although the cross-linking effects of cisplatin are most prominent during S phase, the cell-cycle phase specificity of cisplatin is less evident than that of etoposide.
In the present study, the MiCK assay was applied to monitor drug responses in HL-60 cells exposed to multiple concentrations of etoposide and cisplatin. Due to the kinetic nature of the MiCK assay, it routinely reports the definite maximum of drug response and indicates the time at which it was achieved. In our previous publication, 23 this time was designated as the time to the maximum response (Tm) and was shown to consist of two components, initiation time (Ti) and development time (Td).
Both the extent and timing of apoptotic responses strongly depended on the concentration of either drug. An increase in the drug concentrations was accompanied by an increased apoptosis and shortening of the time to the maximum response (Figure 1) ▶ . These data were in agreement with our observations made with other chemotherapeutic agents, idarubicin, daunorubicin, and mitoxantrone. 23 Remarkable differences in kinetics of apoptosis caused by etoposide and cisplatin were revealed at 2.5 and 5 μmol/L of the drugs (Table 1) ▶ . At each of these doses, Tm was significantly longer with cisplatin while Td was longer with etoposide. Therefore, the prolonged duration of Tm at 2.5 and 5 μmol/L cisplatin was due to a prolonged Ti, ie, the time required to initiate apoptosis in the most susceptible cells of the population. This longer Ti in cisplatin-treated cultures is consistent with the pharmacokinetics of the drug. Namely, after entering the cell by diffusion, cisplatin must be converted into its active, positively charged form by replacement of chloride by water. 31 Therefore, accumulation in cells of effective concentrations of activated species of the drug depends on rate of aquation and may be affected by an increased concentration of intracellular chloride. Despite the differences in kinetics of apoptosis seen at low drug concentrations, we could not find any significant difference in the apoptosis-inducing potency of etoposide and cisplatin. Except for 1 μmol/L cisplatin, which did not induce apoptosis within 24 hours, at equal concentrations of both drugs similar values of the maximum apoptotic response were detected. At higher concentrations of 10 and 20 μmol/L, the differences in both kinetics and extent of apoptosis induced by the two drugs were negligible.
To relate the MiCK assay results to the changes in morphological and light-scattering properties of the cells during apoptosis, the MiCK assay, TLVM, and flow cytometry were applied to the cells exposed to etoposide and cisplatin. TLVM has previously been proven to be an informative tool in studying morphological changes of apoptosis. 32-34 In turn, flow cytometry studies performed with several types of cells demonstrated that early stages of apoptosis were characterized by a decreased forward light-scattering, whereas advanced stages were accompanied by an increased side scattering of the light. 16,35,36 The intensity of the forward light-scattering is proportional to the cell volume while side light scattering strongly depends on cell shape and granularity of the cellular contents. 37 In our experiments, 10 μmol/L etoposide and 5 μmol/L cisplatin were used as the cell death inducers because at these concentrations, the most prominent differences in both kinetics and extent of apoptosis were revealed by the MiCK assay. At times when the MiCK assay reported rapid linear increases in the OD of the cultures, rapid linear increases in the proportion of cells with plasma membrane blebbing could be detected by TLVM. Over the same periods, flow cytometry analyses revealed accumulation of cells with increased side scattering and decreased forward scattering of the light in the cell populations. These results indicated that accumulation of cells with irregular shapes was the main cause of the increased side scattering between 4 and 8 hours in etoposide-treated cultures and between 16 and 21 hours in cisplatin-treated cultures. In turn, these increases in side scattering appeared to cause the steep increases in the OD detected by the MiCK assay. Because the stage of membrane blebbing coincides with nuclear breakdown, 9,34,38 nuclear fragments may increase inner granularity of cells and, thus, may also contribute to increased side scattering properties of apoptotic cells. In our recent studies, 23,24 the slope of the steep rising portion of the OD-versus-time curve was used to quantify apoptosis because this slope was found to correlate with the proportion of apoptotic cells in Giemsa-stained preparations. Data presented in this paper directly confirm that the rapid linear increase of the OD, an indicator of apoptosis in the MiCK assay, correlates with the progressive accumulation in the cultures of cells with morphological evidence of apoptosis.
The frame-by-frame analysis of the sequential changes in cell morphology during apoptosis has shown that all of the 15 analyzed cells proceeded through the characteristic stages of cell shrinkage and plasma membrane blebbing. However, we did not observe a stage of cell fragmentation in its classic description in which apoptotic cells fall apart, forming multiple cell fragments of a smaller size. 7-9 Instead, the blebbed stage was followed by the stage which we have designated as shedding of the blebs. In this shedding stage, the blebs became complete spheres, some of which remained physically associated with the large residual apoptotic body for hours, while others promptly detached and became freely distributed in medium (Figure 4, F–I) ▶ . Propidium iodide staining has shown nuclear material to be associated with the large residual apoptotic bodies rather than with the freely distributed small cell fragments (not shown). Large residual bodies persisted for many hours but eventually they lost their membrane integrity, swelled, and acquired the morphology of necrotic cells.
Another finding from the TLVM was that morphological modifications in cells during apoptosis occurred in such a manner that the cells had prolonged periods of relatively stable shapes that were punctuated by brief periods of rapidly changing shape. These rapid changes required 5 to 15 minutes to complete and occurred when the cell developed blebs, when the cell shed blebs, when the residual body swelled, and when the residual body dissolved. Stable stages, which lasted for hours, were the pre-apoptotic, blebbed, and postshedding stages. In regard to the ability of the MiCK assay to quantify apoptosis, the most important findings were the rapid development of blebs and the prolonged duration of the blebbed stage, which lasted for 3 to 4 hours. Taken together, these two events help to explain the steepness and linearity of the OD increases in cultures undergoing apoptosis. First, the blebbing stage developed in the cells most susceptible to the induction of apoptosis. Blebbing of the plasma membrane of the early responders provided the initial rise in the OD of the culture seen at the beginning of Td. Once developed, the blebbing stage lasted for about 3 to 4 hours, thus providing for an increased side scattering in cultures. Cells which entered apoptosis at later times contributed to a further OD increase from the level which has already been achieved and maintained due to the lasting blebbing stage in cells which initiated apoptosis earlier. TLVM studies showed that in both etoposide-treated and cisplatin-treated cells, the increases in the percentages of blebbed cells were linear over certain periods during Td (Figures 2B and 3B) ▶ ▶ . Hence, this linear influx of blebbed cells accounts for linearity of the steep rising portion of the apoptotic curve. Cessation of the OD increase can be explained by the depletion of the cell subpopulation capable of developing apoptosis in response to an inducer. The following fall in the proportion of blebbed cells was due to shedding of the blebs with accumulation in cultures of large residual apoptotic bodies and small cell fragments.
In the MiCK assay, only the portion of the OD-versus-time curve that precedes the OD maximum is used in evaluation of apoptosis. However, we took advantage of direct comparisons between the MiCK assay, TLVM, and flow cytometry and attempted to explain the behavior of the portion of the apoptotic curve after the OD maximum. TLVM demonstrated significant complexity in the composition of cultures at times after the OD maximum. This structural polymorphism of the culture impedes an accurate interpretation of the corresponding flow cytometry data. Nonetheless, as seen in TLVM, similarity in the size of large residual bodies and that of unaffected cells may account for similarity in forward light-scattering properties of cells at the beginning and at the end of study. Prominent intracellular granularity of large residual bodies and, later, of highly translucent necrotic cells may explain their augmented side scattering properties and account for gradual, rather than abrupt, decline of the apoptotic curve after the OD maximum. In general, under the conditions used, the gradual decline of the apoptotic curve after the maximum OD appeared to reflect the disintegrative process in dead cells.
Although the membrane blebbing is an important component of apoptosis, it has also been described in a form of cell death that is more rapid than apoptosis and has been observed in renal tubular cells 39,40 and hepatocytes. 41-43 These cells can die within minutes following specific stimuli that include metabolic toxins, anoxia, and rapidly altered intracellular ion concentrations. 39-43 However, unlike the blebbing in apoptosis, the blebbing associated with these acute toxic stimuli can result in immediate cell lysis through bleb rupture or, in cases of sublethal stimuli, the blebbing can be reversible. 42 The rapid death of cells by these toxic processes has been termed cell lysis or cell oncosis and, like apoptosis, this lytic process can lead to the subsequent morphological endpoint of cellular necrosis. 41,44
Different endpoint assays of apoptosis rely on different markers of apoptosis. However, apoptosis is a highly dynamic process during which characteristic morphological and biochemical markers of apoptosis may be observed in cells for only a limited period of time. The durations of these periods vary depending on the cell type, the cell-cycle status, and the type and concentration of apoptosis inducer. Moreover, cells of the same population are not uniform in their susceptibility to an apoptosis inducer and may initiate apoptosis at different times of the drug exposure. Because of asynchronous involvement of the cells in apoptosis, different proportions of apoptotic cells with membrane blebbing, fragmented DNA, modified mitochondrial units, broken nuclei, or activated caspases coexist at any one time of culture. Therefore, depending on the endpoint method used to study apoptosis, the extent of apoptosis determined in the same cell population may be different. For example, Koopman et al, 45 who studied apoptosis in Burkitt’s lymphoma cells and in the germinal center B lymphocytes cultured in serum-restricted medium, reported that in populations with well developed DNA cleavage only a low proportion of cells was annexin V-positive. When cultures were incubated in serum-restricted medium for longer periods, intensity of the oligonucleosomal bands decreased, whereas the proportions of annexin V-positive cells and cells with condensed nuclei increased. Conversely, Martin et al 14 have shown that in cultures of T-lymphocytic Jurkat cells exposed to anti-Fas antibody, the accumulation of annexin V-positive cells always preceded that of cells with morphological criteria of apoptosis.
In our study of apoptosis in HL-60 cells exposed to 10 μmol/L etoposide or 5 μmol/L cisplatin, cell cultures were examined at multiple times to determine the time at which a maximum extent of apoptosis is revealed by each of the three endpoint assays (Figure 6 ▶ and Table 2 ▶ ). With annexin V binding assay, a maximum extent of apoptosis could always be detected 4 to 5 hours earlier than it was seen in Giemsa-stained preparations and 8 hours earlier than it was detected by measuring of DNA fragmentation. Values of the maximum extent of apoptosis varied depending on an endpoint assay used (Table 2) ▶ . Moreover, the extent of apoptosis varied when it was measured at the same time points with the annexin V, morphological and DNA fragmentation assays (Figure 6) ▶ .
The dynamic nature of apoptotic process suggests that the same endpoint assay applied at different times of culture would produce differing estimates of apoptosis. Indeed, in our study, the results of the measurement of apoptosis with each of the three endpoint assays strictly depended on time of the drug exposure. With all these assays, the proportions of apoptotic cells were increasing with time until the maxima and then declined. Therefore, to determine a maximum of apoptotic response induced by a certain drug concentration, any endpoint assay must be applied at multiple times of drug exposure. In turn, the determination of both a maximum response and the time at which it was achieved, is an obligatory requirement for determining of an apoptosis-inducing potency of an agent and for a comparison between results of studies performed in different laboratories or with different methods. Remarkably, of the three endpoint assays of apoptosis, results of morphological evaluation showed best correlations with those of the TLVM and MiCK assay (Table 2) ▶ .
In our studies, the maximum DNA cleavage was detected when cells with necrotic morphology clearly predominated in the cultures. These observations are consistent with the fact that internucleosomal DNA cleavage is a late event of apoptosis. 13,33,34 However, detection of the maximum DNA fragmentation in cultures consisting of morphologically necrotic cells does not allow a definite conclusion to be made as of whether internucleosomal DNA cleavage was initiated in cells during apoptosis or it was confined to the stage of secondary necrosis. It is noteworthy, that in cultures treated with 10 μmol/L etoposide, a maximum extent of apoptosis by the morphological test was 64% at 8 hours culture (Figure 6A) ▶ , whereas at 16 hours, more than 95% of cells were trypan blue-positive and had necrotic morphology. It follows that, at least, 30% of necrotic cells seen at 16 hours could have emerged from primary or ab initio necrosis rather than to be a final step of the apoptotic cell death. A concern has already been raised by others as to whether internucleosomal DNA cleavage is a specific and obligatory event of apoptosis. 46-48 Our observations heightened this concern and necessitate additional studies to clarify the issue.
Like the plasma membrane blebbing, the activation of a series of caspases, a family of the interleukin-1β-converting enzyme (ICE)-like cysteine proteases, is an early event in apoptosis. Detection of apoptosis by measurement of cleavage of various caspase substrates 49-51 has the potential to be used as an apoptosis assay. 52 However, as with any endpoint assay, this method may be accurate in evaluation of apoptosis only if applied at multiple times after exposure of the cells to an inducer of apoptosis. Recent reports showed that protease inhibitors zVADfmk or BDfmk inhibited chromatin condensation and internucleosomal cleavage in cells exposed to various apoptosis inducers; however, these inhibitors had no effect on the membrane blebbing. 53 Considering that membrane blebbing is the major determinant in the apoptosis signal measured in the MiCK assay, it would be of an interest to perform MiCK assay-guided quantitative kinetic studies of the caspase activation during drug-induced apoptosis as well as to investigate the effects of caspase inhibitors on the kinetics of drug-induced apoptosis in tumor cells.
Footnotes
Address reprint requests to Dr. Vladimir D. Kravtsov, M.D., Ph.D., 547 MRB-II, Department of Medicine, Division of Hematology/Oncology, Vanderbilt University Medical Center, 2220 Pierce Avenue, Nashville, TN 37232-6305. E-mail: vladimir.d.kravtsov@vanderbilt.edu.
Support for this study has been provided in part by National Cancer Institute Cancer Center Support grant 1P30 CA68485 to V. D. K., National Institutes of Health grant RO-1 DK38518 to T. O. D., and Leukemia Society of America Translational Research grant 6276 to M. J. K.
References
- 1.Sachs L, Lotem J: Control of programmed cell death in normal and leukemic cells: new implications for therapy. Blood 1993, 82:15-21 [PubMed] [Google Scholar]
- 2.Kerr JFR, Winterford CM, Harmon BV: Apoptosis: its significance in cancer and cancer therapy. Cancer 1994, 73:2013-2026 [DOI] [PubMed] [Google Scholar]
- 3.Hannun YA: Apoptosis and the dilemma of cancer chemotherapy. Blood 1997, 89:1845-1853 [PubMed] [Google Scholar]
- 4.Sekiguchi I, Suzuki M, Ohwada M, Sato I: Apoptosis as a criterion for sensitivity of uterine cervical adenocarcinoma to cisplatin. Oncol Rep 1998, 5:1077-1078 [DOI] [PubMed] [Google Scholar]
- 5.Fan W, Johnson KR, Miller MC, III: In vitro evaluation of combination chemotherapy against human tumor cells. Oncol Rep 1998, 5:1035-1042 [DOI] [PubMed] [Google Scholar]
- 6.Kamesaki H: Mechanisms involved in chemotherapy-induced apoptosis and their implications in cancer chemotherapy. Int J Hematol 1998, 68:29-43 [DOI] [PubMed] [Google Scholar]
- 7.Kerr JFR, Wyllie AH, Currie AR: Apoptosis: a basic biological phenomenon with wide ranging implications in tissue kinetics. Br J Cancer 1972, 26:239-257 [DOI] [PMC free article] [PubMed] [Google Scholar]
- 8.Wyllie AH, Kerr JFR, Currie AR: Cell death: the significance of apoptosis. Int Rev Cytol 1981, 68:251-306 [DOI] [PubMed] [Google Scholar]
- 9.Cohen JJ: Overview: mechanisms of apoptosis. Immunol Today 1993, 14:126-130 [DOI] [PubMed] [Google Scholar]
- 10.Hockenbery D: Defining apoptosis. Am J Pathol 1995, 146:16-19 [PMC free article] [PubMed] [Google Scholar]
- 11.Wyllie AH: Glucocorticoid-induced thymocyte apoptosis is associated with endogenous endonuclease activation. Nature 1980, 284:555-556 [DOI] [PubMed] [Google Scholar]
- 12.Green DR, Reed JC: Mitochondria and apoptosis. Science 1998, 281:1309-1312 [DOI] [PubMed] [Google Scholar]
- 13.Mower DA, Peckham DW, Illera VA, Fishbaugh JK, Stunz LL, Ashman RF: Decreased membrane phospholipid packing and decreased cell size precede DNA cleavage in mature mouse B cell apoptosis. J Immunol 1994, 152:4832-4842 [PubMed] [Google Scholar]
- 14.Martin SJ, Reutelingsperger CPM, McGahon AJ, Rader JA, van Schie RCAA, LaFace DM, Green DR: Early redistribution of plasma membrane phosphatidylserine is a general feature of apoptosis regardless of the initiating stimulus: inhibition by overexpression of Bcl-2 and Abl. J Exp Med 1995, 182:1545-1556 [DOI] [PMC free article] [PubMed] [Google Scholar]
- 15.Thornberry NA, Lazebnik Y: Caspases: enemies within. Science 1998, 281:1312-1316 [DOI] [PubMed] [Google Scholar]
- 16.Darzynkiewicz Z, Bruno S, Del Bino G, Gorczyca W, Hotz MA, Lassota P, Traganos F: Features of apoptotic cells measured by flow cytometry. Cytometry 1992, 13:795-808 [DOI] [PubMed] [Google Scholar]
- 17.Gorczyca W, Gong J, Darzynkiewicz Z: Detection of DNA strand breaks in individual apoptotic cells by the in situ terminal deoxynucleotidyl transferase and nick translation assays. Cancer Res 1993, 53:1945-1951 [PubMed] [Google Scholar]
- 18.Ormerod MG, Collins MK, Rodriguez-Tarduchy G, Robertson D: Apoptosis in interleukin-3-dependent haemopoietic cells. Quantification by two flow cytometric methods. J Immunol Methods 1992, 153:57–65 [DOI] [PubMed]
- 19.Koopman G, Reutelingsperger CPM, Kuijten GAM, Keehen RMJ, Pals ST, van Oers MHJ: Annexin V for flow cytometric detection of phosphatidylserine expression on B cells undergoing apoptosis. Blood 1994, 84:1415-1420 [PubMed] [Google Scholar]
- 20.Durrieu F, Belloc F, Lacoste L, Dumain P, Chabrol J, Dachary-Prigent J, Morjani H, Boisseau M, Reiffers J, Bernard P, Lacombe F: Caspase activation is an early event in anthracycline-induced apoptosis and allows detection of apoptotic cells before they are ingested by phagocytes. Exp Cell Res 1998, 240:165-175 [DOI] [PubMed] [Google Scholar]
- 21.Kravtsov VD: A novel microculture kinetic assay (MiCK assay) for malignant cell growth and chemosensitivity. Eur J Cancer 1994, 30A:1564-1570 [DOI] [PubMed] [Google Scholar]
- 22.Kravtsov V, Fabian I: Automated monitoring of apoptosis in suspension cell cultures. Lab Invest 1996, 74:557-570 [PubMed] [Google Scholar]
- 23.Kravtsov V, Greer J, Whitlock J, Koury M: Use of the microculture kinetic (MiCK) assay of apoptosis to determine chemosensitivities of leukemias. Blood 1998, 92:968-980 [PubMed] [Google Scholar]
- 24.Barry MA, Reynolds JE, Eastman A: Etoposide-induced apoptosis in human HL-60 cells is associated with intracellular acidification. Cancer Res 1993, 53:2349-2357 [PubMed] [Google Scholar]
- 25.Martins LM, Mesner PW, Kottke TJ, Basi GS, Sinha S, Tung JS, Svingen PA, Madden BJ, Takahashi A, McCormick DJ, Earnshaw WC, Kaufmann SH: Comparison of caspase activation and subcellular localization in HL-60 and K562 cells undergoing etoposide-induced apoptosis. Blood 1997, 90:4283-4296 [PubMed] [Google Scholar]
- 26.Gorczyca W, Gong J, Ardelt B, Traganos F, Darzynkiewicz Z: The cell cycle related differences in susceptibility of HL-60 cells to apoptosis induced by various antitumor agents. Cancer Res 1993, 53:3186-3192 [PubMed] [Google Scholar]
- 27.Shi Y, Frankel A, Radvanyi LG, Penn LZ, Miller RG, Mills GB: Rapamycin enhances apoptosis and increases sensitivity to cisplatin in vitro. Cancer Res 1995, 55:1982-1988 [PubMed] [Google Scholar]
- 28.Long BH: Mechanisms of action of teniposide (VM-26) and comparison with etoposide (VP-16). Semin Oncol 1992, 19:3-19 [PubMed] [Google Scholar]
- 29.Damayanthi Y, Lown JW: Podophyllotoxins: current status and recent developments. Curr Med Chem 1998, 5:205-252 [PubMed] [Google Scholar]
- 30.Parker RJ, Eastman A, Bostick-Bruton F, Reed E: Acquired cisplatin resistance in human ovarian cancer cells is associated with enhanced repair of cisplatin-DNA lesions and reduced drug accumulation. J Clin Invest 1991, 87:772-777 [DOI] [PMC free article] [PubMed] [Google Scholar]
- 31.Calvert H, Judson I, van der Vijgh WJ: Platinum complexes in cancer medicine: pharmacokinetics and pharmacodynamics in relation to toxicity and therapeutic activity. Cancer Surv 1993, 17:189-217 [PubMed] [Google Scholar]
- 32.Pulkkinen JO, Elomaa L, Joensuu H, Martikainen P, Servomaa K, Grenman R: Paclitaxel-induced apoptotic changes followed by time-lapse video microscopy in cell lines established from head and neck cancer. J Cancer Res Clin Oncol 1996, 122:214-218 [DOI] [PubMed] [Google Scholar]
- 33.Collins JA, Schandi CA, Young KK, Vesely J, Willingham MC: Major DNA fragmentation is a late event in apoptosis. J Histochem Cytochem 1997, 45:923-934 [DOI] [PubMed] [Google Scholar]
- 34.Messam CA, Pittman RN: Asynchrony and commitment to die during apoptosis. Exp Cell Res 1998, 238:389-398 [DOI] [PubMed] [Google Scholar]
- 35.Ferlini C, Di Cesare S, Rainaldi G, Malorni W, Samoggia P, Biselli R, Fattorossi A: Flow cytometric analysis of the early phases of apoptosis by cellular and nuclear techniques. Cytometry 1996, 24:106-115 [DOI] [PubMed] [Google Scholar]
- 36.Petit PX, Lecoeur H, Zorn E, Dauguet C, Mignotte B, Gougeon ML: Alterations in mitochondrial structure and function are early events of dexamethasone-induced thymocyte apoptosis. J Cell Biol 1995, 130:157-167 [DOI] [PMC free article] [PubMed] [Google Scholar]
- 37.Shapiro HM: Practical Flow Cytometry. 1993:pp 115-121 Wiley-Liss, New York
- 38.Katsen AD, Vollmar B, Mestres-Ventura P, Menger MD: Cell surface and nuclear changes during TNF-α-induced apoptosis in WEHI 164 murine fibrosarcoma cells. A correlative light, scanning, and transmission electron microscopical study. Virchows Arch 1998, 433:75-83 [DOI] [PubMed] [Google Scholar]
- 39.Phelps PC, Smith MW, Trump BF: Cytosolic ionized calcium and bleb formation after acute cell injury of cultured rabbit renal tubule cells. Lab Invest 1989, 60:630-642 [PubMed] [Google Scholar]
- 40.Smith MW, Phelps PC, Trump BF: Cytosolic Ca2+ deregulation and blebbing after HgCl2 injury to cultured rabbit proximal tubule cells as determined by digital imaging microscopy. Proc Natl Acad Sci USA 1991, 88:4926-4930 [DOI] [PMC free article] [PubMed] [Google Scholar]
- 41.Nicotera R, Thor H, Orrenius S: Cytosolic-free Ca2+, and cell killing in hepatoma 1c1c7 cells exposed to chemical anoxia. FASEB J 1989, 3:59-64 [DOI] [PubMed] [Google Scholar]
- 42.Gores GJ, Herman B, Lemasters JJ: Plasma membrane bleb formation and rupture: a common feature of hepatocellular injury. Hepatology 1990, 11:690-698 [DOI] [PubMed] [Google Scholar]
- 43.Herman B, Gores GJ, Nieminen A-L, Kawanishi T, Harman A, Lemasters JJ: Calcium and pH in anoxic and toxic injury. Toxicology 1990, 21:127-143 [DOI] [PubMed] [Google Scholar]
- 44.Trump BF, Berezesky IK, Chang SH, Phelps PC: The pathways of cell death: oncosis, apoptosis, and necrosis. Toxicol Pathol 1997, 25:82-88 [DOI] [PubMed] [Google Scholar]
- 45.Koopman G, Reutelingsperger CPM, Kuijten GAM, Keehen RMJ, Pals ST, van Oers MHJ: Annexin V for flow cytometric detection of phosphatidylserine expression on B cells undergoing apoptosis. Blood 1994, 84:1415-1420 [PubMed] [Google Scholar]
- 46.Cohen GM, Sun X-M, Snowden RT, Dinsdale D, Skilleter DN: Key morphological features of apoptosis may occur in the absence in internucleosomal DNA fragmentation. Biochem J 1992, 286:331-334 [DOI] [PMC free article] [PubMed] [Google Scholar]
- 47.Collins RJ, Harmon BV, Gobe GC, Kerr JFR: Internucleosomal DNA cleavage should not be the sole criterion for identifying apoptosis. Int J Radiat Biol 1992, 61:451-453 [DOI] [PubMed] [Google Scholar]
- 48.Schulze-Osthoff K, Walczak H, Droge W, Krammer PH: Cell nucleus and DNA fragmentation are not required for apoptosis. J Cell Biol 1994, 127:15-20 [DOI] [PMC free article] [PubMed] [Google Scholar]
- 49.Kelley LL, Koury MJ, Bondurant MC, Koury ST, Sawyer ST, Wickrema A: Survival or death of individual proerythroblasts results from differing erythropoietin sensitivities: a mechanism for controlled rates of erythrocyte production. Blood 1993, 82:2340-2352 [PubMed] [Google Scholar]
- 50.Lazebnik Y, Kaufmann S, Desnoyers S, Poirier G, Earnshaw W: Cleavage of poly (ADP-ribose) polymerase by a proteinase with properties like ICE. Nature 1994, 371:346-347 [DOI] [PubMed] [Google Scholar]
- 51.Lazebnik YA, Takahashi A, Moir RD, Goldman RD, Poirier GG, Kaufman SH, Earnshaw WC: Studies of the lamin proteinase reveal multiple parallel biochemical pathways during apoptotic execution. Proc Natl Acad Sci USA 1995, 92:9042-9046 [DOI] [PMC free article] [PubMed] [Google Scholar]
- 52.McCarthy NJ, Evan GI: Methods for detecting and quantifying apoptosis. Curr Top Dev Biol 1998, 36:259-278 [DOI] [PubMed] [Google Scholar]
- 53.McCarthy NJ, Whyte MKB, Gilbert CS, Evan GI: Inhibition of Ced-3/ICE-related proteases does not prevent cell death induced by oncogenes, DNA damage, or the Bcl-2 homologue Bak. J Cell Biol 1997, 136:215-227 [DOI] [PMC free article] [PubMed] [Google Scholar]