

Abstract
Angiogenesis is a critical step in tumor growth and metastatic invasion. We here report the study of the vascular status of 10 benign and 9 malignant pheochromocytomas. We examined the vascular architecture after immunostaining endothelial cells (CD34) and vascular smooth muscle cells (α-actin) and identified a vascular pattern characteristic of malignant lesions. To define a gene expression profile indicative of the invasive phenotype, we studied by in situ hybridization the expression of genes encoding several pro- and anti-angiogenic factors [hypoxia-inducible factor (HIF-1α), EPAS1, vascular endothelial growth factor (VEGF), VEGF receptors, angiopoietins and their receptor Tie2, five genes of the endothelin system, and thrombospondin 1]. A semiquantitative evaluation of the labeling revealed an induction of genes encoding EPAS1, VEGF, VEGFR-1, VEGFR-2, endothelin receptor, type B (ETB) and endothelin receptor, type A (ETA) in malignant pheochromocytomas as compared to benign tumors. These differences were observed in tumor cells, in endothelial cells, or in both. Quantification by real-time reverse-transcriptase polymerase chain reaction showed an increase of EPAS1, VEGF, and ETB transcripts of 4.5-, 3.5-, and 10-fold, respectively, in malignant versus benign tumors. Furthermore, we observed a strong correlation between the expression of EPAS1 and VEGF in tumoral tissue and between EPAS1 and ETB in endothelial cells. Altogether, our observations show that analysis of angiogenesis provides promising new criteria for the diagnosis of malignant pheochromocytomas.
Pheochromocytomas are catecholamine-secreting neoplasms of chromaffin tissue. 1 They usually arise from the adrenal medulla, although one-tenth of tumors may arise from extra-adrenal chromaffin tissue (extra-adrenal pheochromocytomas or paragangliomas). Pheochromocytomas may be malignant, as documented by the presence of lymph node, bone, or visceral metastasis 2,3 either at first operation or at recurrence. Tumor recurrence may occur months or years after the initial operation. 4 Extra-adrenal pheochromocytomas are frequently malignant and associated with a high incidence of persistent or recurrent disease. 5 Whereas diagnosis of malignancy is clear-cut in the presence of metastatic lesions, recent interest has focused on identifying primary tumor phenotypes likely to predict future recurrence or metastasis. Angiogenic patterns are one such phenotype.
According to a commonly accepted concept, induction of angiogenesis is a condition for tumor growth beyond a certain size and for metastasis invasion. 6 This process of neovascularization, necessary to ensure the input of oxygen and nutrients, is regulated by hypoxia, which triggers the increased expression of various endothelial growth factors and/or their receptors. Specifically, modulation of the angiogenic balance is monitored by two hypoxia-inducible transcription factors called hypoxia-inducible factor (HIF)-1α and EPAS1 (HIF-2α), which activate the expression of several angiogenic agents in response to low oxygen tension. 7 Vascular endothelial growth factor (VEGF), which is the most potent factor for vascular development, 8 is a direct target of both these transcription factors. 9,10 In contrast, the VEGF receptor VEGFR-2 11 and Tie2, 12 a receptor involved in vascular remodeling and stabilization. 13 are activated specifically by EPAS1, in vitro. Although there is still no evidence on the direct binding of either HIF-1α or EPAS1 to the hypoxia responsive elements present in their promoters, other genes, such as those encoding VEGFR-1, 14 Tie2’s ligand angiopoietin-2, 15 or genes of the endothelin system 16,17 are known to be overexpressed in hypoxic conditions.
The pivotal role of angiogenesis in tumor growth has initiated a wealth of studies on the expression of growth and differentiation factors, as well as other molecules, which affect the modeling of blood vessels, particularly small capillaries. These studies have better defined the relative roles of activators and inhibitors of angiogenesis in tumors, with the ultimate goal being the blockade of vascular growth as inhibitory tools to stop tumor progression.
Pheochromocytomas are usually highly vascular tumors, although there is a wide variation between the vascularity of individual tumors. Several studies have analyzed vascular density as a putative marker to define the malignant status of these tumors, 18,19 but the expression of angiogenic factors has never been reported in pheochromocytomas. This lack of information, when angiogenesis is considered the permissive condition of tumor growth, prompted us to undertake a comparative study of the structure of the vascular network and the angiogenesis status in tissue from both benign and malignant pheochromocytomas. We have examined the vascular architecture after immunostaining blood vessels with anti-CD34 and anti-α-actin antibodies and evaluated by in situ hybridization the expression of well-established angiogenic agents: 1) the two hypoxia-inducible transcription factors (HIF-1α and EPAS1); 2) VEGF and its receptors VEGFR-1 and VEGFR-2; 3) angiopoietin (Ang)-1 and Ang-2 and their receptor Tie2. In addition, we studied the expression of genes of the endothelin system [the prepro-endothelin 1 (PPET-1) and 3 (PPET-3) together with their maturation enzyme (ECE1) and their receptors endothelin receptor, type A (ETA) and endothelin receptor, type B (ETB) as they seem to be involved in angiogenic processes in several tumor types. 20-22 Their implication in neural crest cell development made them good candidates in this study, pheochromocytomas being neural crest-derived tumors. Finally, we looked for the presence of a known anti-angiogenic component of the extracellular matrix [thrombospondin 1 (TSP1)]. The relative expression of these markers was evaluated in benign and malignant pheochromocytomas to identify a putative pattern of gene expression characteristic of malignancy in these tumors, which, in term, may provide new prognostic tools for the diagnosis of pheochromocytomas.
Materials and Methods
Patients
We analyzed tumors from 19 patients with pheochromocytomas (10 males, 9 females) diagnosed from 1983 to 2000 (Table 1) ▶ . Ten patients had benign tumors (seven adrenal, three extra-adrenal) and nine had malignant tumors (five adrenal, four extra-adrenal). Among the malignant pheochromocytomas, two were initially diagnosed as benign but had a malignant recurrence several years later. Patients with malignant pheochromocytomas had larger tumors at initial operation than those with benign pheochromocytomas (81 and 47 mm, respectively; P = 0.015). The mean age of patients with benign tumors and those with malignant tumors was 45.4 and 40.9 years, respectively, at first operation.
Table 1.
Clinical Characteristics of Patients with Benign (B1 to B10) or Ever Malignant (M1 to M9) Pheochromocytoma
| No. | Gender/age at 1st operation | Year of 1st operation | Preoperative UMN, μmol/day | Preoperative plasma NorE/E, nmol/l | Tumor status at 1st operation | Tumor size at 1st operation, mm | Tumor site at 1st operation | Source of tumor sample analyzed | Present outcome |
|---|---|---|---|---|---|---|---|---|---|
| B1 | M/27 | 1989 | 35.7 | 30.2/0.5 | Benign | 72 | Zuckerkandl body | Primary tumor | Tumor-free |
| B2 | M/25 | 1990 | 57.0 | 109.0/1.3 | Benign | 70 | Zuckerkandl body | Primary tumor | Lost to follow-up |
| B3 | F/37 | 1992 | 12.7 | 14.9/0 | Benign | 30 | Zuckerkandl body | Primary tumor | Tumor-free |
| B4 | M/45 | 1999 | 20.3 | 16.8/0.2 | Benign | 35 | Left adrenal | Primary tumor | Tumor-free |
| B5 | F/41 | 1998 | 35.3 | 4.4/1.3 | Benign | 45 | Right adrenal | Primary tumor | Tumor-free |
| B6 | F/53 | 1998 | 12.2 | 3.7/0.6 | Benign | 40 | Right adrenal | Primary tumor | Tumor-free |
| B7 | M/62 | 1998 | 16.0 | 3.8/3.4 | Benign | 35 | Left adrenal | Primary tumor | Tumor-free |
| B8 | F/44 | 1998 | 161.3 | 27.9/0 | Benign | 41 | Left adrenal | Primary tumor | Tumor-free |
| B9 | F/49 | 1999 | 51.9 | 1.9/0.4 | Benign | 35 | Right adrenal | Primary tumor | Tumor-free |
| B10 | M/71 | 2000 | 128.4 | 7.8/3.1 | Benign | 65 | Right adrenal | Primary tumor | Tumor-free |
| M1 | M/38 | 1988 | 51.7 | 21.6/0 | Malignant | 120 | Zuckerkandl body | Primary tumor | Multiple meta, died 1996 |
| M2 | M/29 | 1991 | 18.0 | 13.0/0.1 | Benign | 50 | Zuckerkandl body | Primary tumor | Multiple meta, died 2001 |
| M3 | M/24 | 1977 | Not available | Not available | Malignant | Not available | Zuckerkandl body | Intrascrotal meta, 1996 | Multiple meta, died 1997 |
| M4 | F/39 | 1988 | 55.9 | 32.6/0.4 | Malignant | 90 | Left adrenal | Lymph node meta, 1992 | Diseased, asymptomatic |
| M5 | M/43 | 1993 | 25.6 | 114.0/0 | Malignant | 50 | Urinary bladder | Primary tumor | Multiple meta, died 1997 |
| M6 | F/54 | 1999 | 96.3 | 87.3/0.2 | Malignant | 140 | Right adrenal | Primary tumor | Multiple meta, died 1999 |
| M7 | M/53 | 1983 | 104.8 | 17.0/1.4 | Malignant | 90 | Right adrenal | Lymph node meta, 1983 | Multiple meta, died 1984 |
| M8 | F/42 | 1989 | Not available | Not available | Malignant | 60 | Left adrenal | Lymph node meta, 1996 | Multiple meta, died 1998 |
| M9 | F/46 | 1992 | 21.0 | 46.0 | Benign | 45 | Right adrenal | Lymph node meta, 1998 | Diseased, asymptomatic |
M, male; F, female; UMN, urinary metanephrine excretion; NorE, norepinephrine; E, norepinephrine; meta, metastasis.
The procedures used for pheochromocytoma diagnosis and treatment were in accordance with institutional guidelines and have been described previously. 4,23-25
Tissue Samples
Tumor samples were obtained at first operation in 14 patients (10 with benign, 4 with malignant pheochromocytomas) and at repeat operation for a malignant recurrence in 5 patients. All samples were obtained as paraffin blocks prepared for routine pathological section. Paraffin blocks were cut and sections (7-μm thick) were mounted on silane-treated slides before being used for immunohistochemistry or in situ hybridization. For four patients (two with benign and two with malignant pheochromocytomas), we obtained tumor samples frozen by immersion in liquid nitrogen.
Antibodies and Riboprobes
The antibodies used for immunostaining were: tyrosine hydroxylase (Institut J. Boy, Reims, France), neuronal-specific enolase (gift from N. Lamandé 26 ), CD34 (Immunotech, Marseille, France) and α-actin (DAKO, Trappes, France).
The following probes used for in situ hybridization were previously described 27 : EPAS1, HIF-1α, VEGF, VEGFR-1, VEGFR-2, Ang-1, Ang-2, and Tie2. TSP1 (nucleotides −33 to 1189) was a gift from J. J. Feige, and components of the endothelin system were gifts from M. Brand. 28
Immunohistochemistry
Immunohistochemistry was performed as previously described. 29 The protocol used a biotinylated secondary antibody (Vector Laboratories, Burlingame, CA), an avidin-biotin-peroxidase complex (Vectastain ABC Elite, Vector Laboratories) and diaminobenzidine as a chromogen for the peroxidase activity.
In Situ Hybridization
The in situ hybridization method has been described in detail. 30 Briefly, after deparaffinization, sections were prepared for hybridization by boiling in citrate buffer, followed by a proteinase K digestion. Sections received 50 μl of hybridization mixture containing 5 × 10⁵ cpm of 35S-UTP-labeled riboprobe and were hybridized at 50°C overnight. Then slides were washed in buffer solutions of varying stringencies and temperatures. The posthybridization procedure also included an RNase treatment to eliminate all single-strand RNAs. After ethanol dehydration, slides were exposed for 2 to 4 days on X-ray film (BioMax MR; Eastman-Kodak, Rochester, NY) and then dipped in NTB2 liquid emulsion (Eastman-Kodak). After 1 to 6 weeks the slides were developed, fixed, and stained with toluidine blue before mounting in Eukitt.
Semiquantification of in Situ Hybridization Signals
The intensity of labeling was compared exclusively between slides processed simultaneously for hybridization, dipping, photographic treatment, and histological staining. All precautions were taken to ensure identical conditions of labeling for all slides that were to be compared. Evaluation of the intensity of labeling was made in a blind manner by two independent investigators and graded using a 5-scale system: 0, no signal; 1, weak; 2, moderate; 3, strong; 4, very strong. VEGFR-1 required more grades (from 0 to 6) because the hybridization signal was much stronger. In many cases, a second evaluation several weeks later yielded identical values. In the rare cases of discrepancy between the two measurements, a mean value was calculated.
Real-Time Quantitative Reverse Transcriptase-Polymerase Chain Reaction (RT-PCR)
Total RNA was extracted from the frozen tissues using the RNeasy kit (Qiagen, Courtaboeuf, France) and submitted to a DNase I RNase-free treatment (Roche, Basel, Switzerland). Three μg of total RNA were retrotranscribed in a 20-μl volume containing 50 mmol/L Tris-HCl (pH 8.3), 75 mmol/L KCl, 3 mmol/L MgCl2, 5 μmol/L random hexamers, 500 μmol/L dNTP mix, 1 U/μl RNAsin, 1 mmol/L dithiothreitol, and 10 U/μl Moloney murine leukemia virus reverse transcriptase. After denaturation for 5 minutes at 70°C, the reaction was performed for 10 minutes at 26°C and 50 minutes at 37°C and stopped by a 10-minute incubation at 70°C.
Real-time PCR was performed on an ABI Prism 7700 sequence detector (Applied Biosystems) using a SYBR green assay. Primer sequences were as follows: 5′-GCGCTAGACTCCGAGAACAT-3′ (forward) and 5′-TGGCCACTTACTACCTGACCCTT-3′ (reverse) for EPAS1 amplification; 5′-CTACCTCCACCATGCCAAGTG-3′ (forward) and 5′-TGATTCTGCCCTCCTCCTTCT-3′ (reverse) for VEGF; 5′-CTGCTGCACATCGTCATTGAC-3′ (forward) and 5′-GCTCCAAATGGCCAGTCCT-3′ (reverse) for ETB amplification; 5′-CGCCGCTAGAGGTGAAATTC-3′ (forward) and 5′-TCTTGGCAAATGCTTTCGC-3′ (reverse) for 18S amplification. EPAS1, VEGF, and 18S primers were used at a 300-mmol/L concentration whereas ETB primers were at 900 mmol/L each. PCR reaction was performed as follows: 50°C for 2 minutes, 95°C for 10 minutes, and 45 cycles of two-step PCR (95°C for 15 seconds and 60°C for 1 minute). Each experiment was achieved in duplicate for five dilutions of cDNA template (10−1, 10−2, 10−3, 10−4, and 10−5). Gene expression was analyzed for each tumor as a target-to-control expression ratio using the ΔΔCT method for EPAS1 and ETB and the standard curve method for VEGF.
Statistical Analysis
The significance of the in situ hybridization results was tested by the unpaired t-test with 1 degree of freedom. Significance of the real-time PCR differences was assessed by a nonparametric Mann-Whitney test. A P value <0.05 was considered statistically significant. Analyses were performed using the SAS statistical package.
Results
Immunostaining of Chromaffin Cells
To characterize tumor cells as cells of neuronal lineage, the sections were immunostained with antibodies to tyrosine hydroxylase, a key enzyme for the synthesis of catecholamines (Figure 1, A and C) ▶ , and with antibodies to neuron-specific enolase, a marker of neuroendocrine differentiation 31 (Figure 1, B and D) ▶ . Tyrosine hydroxylase-immunostained cells formed compact clusters or masses of large polygonal cells. These clusters were separated by strands of stromal tissue that served as passageways for large blood vessels. All cells positive for tyrosine hydroxylase were also immunostained with the anti-neuron-specific enolase antibody. Although there was some variation between individual tumors (intensity of staining and density of labeled cells), none of these differences appeared to distinguish benign (Figure 1, A and B) ▶ from malignant (Figure 1, C and D) ▶ pheochromocytomas.
Figure 1.
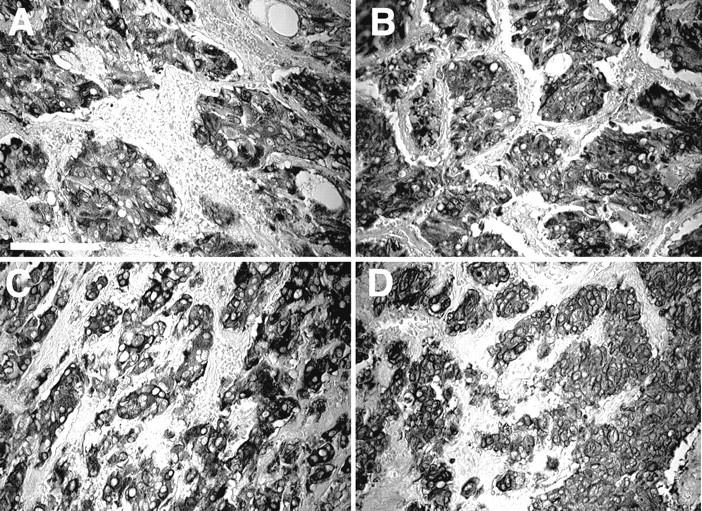
Immunostaining of chromaffin cells. Immunolabeling of tyrosine hydroxylase (A, C) or neuron-specific enolase (B, D) reveals the nodules of tumoral cells of a benign (A, B) and a malignant (C, D) pheochromocytoma. No apparent difference in the signal intensity between benign and malignant tumors was observed. Scale bar, 100 μm.
Vascular Architecture
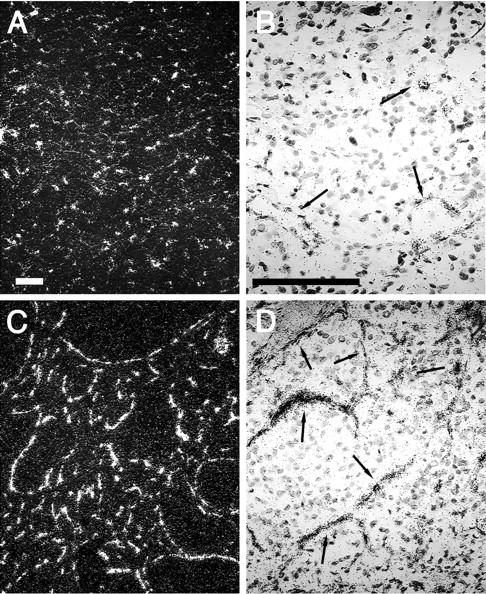
The architecture of the vasculature within medullar plexus of normal adrenals and the 19 pheochromocytomas was delineated by immunostaining for CD34, an endothelial surface antigen and α-actin in smooth muscle cells (Figure 2) ▶ . The immunostaining pattern obtained with these two markers of the blood vessel wall did not differ from each other (see Figure 2 ▶ , insets, for α-actin labeling). Pheochromocytomas could be divided in two groups according to their vascular architecture. One pattern (Figure 2B) ▶ consisted mostly of short, straight vascular segments distributed regularly over large areas of tumoral tissue. The vascular density of these tumors was equivalent to that observed in normal adrenal medulla (Figure 2A) ▶ . Another pattern (Figure 2; C to F) ▶ exhibited longer segments, of irregular length, frequently displaying at least one branching and an open luminal space. The density of vascular entities apparent on a section was lower in this second pattern than in tumors with the first, more regular pattern. Interestingly, the average length of the vascular entities in the irregular pattern is not compatible with a vascular tree formed by dichotomy of tubular capillary-like blood vessels. Indeed, the important length of these blood vessels, as seen on a 7-μm section, cannot represent the transversal section of an organized vascular network. The density of these structures is also too high to result from a sagittal section of all capillaries, unless one assumes a privileged direction of all blood vessels, almost parallel to the plane of section. Most consistent with our data are to view these vascular structures as three-dimensional flattened vascular bags, limited by endothelium and pericytes and surrounding large nodules of tumor tissue (Figure 2D) ▶ , rather than linear tubular structures. When, in a blind screening, the pheochromocytomas were sorted according to their regular or irregular pattern of vascularization, all of the nine malignant tumors exhibited an irregular pattern, Conversely, 9 of 10 benign tumors exhibited the regular pattern and one the irregular (B1). Interestingly, the primary tumor of patient M2 displayed this irregular pattern, confirming its malignant state, whereas, it was, at the time of first operation, diagnosed as benign (Table 1) ▶ .
Figure 2.
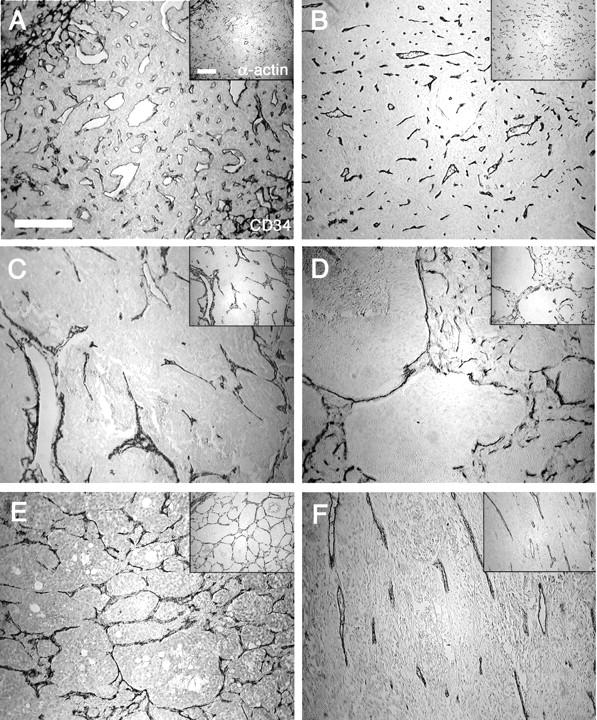
Vascular architecture. The vascular network of a normal adrenal medulla (A), and a benign (B) and four malignant (C–F) pheochromocytomas is observed under light microscopy. Sections were immunostained for ECs with an anti-CD34 antibody and for vascular smooth muscle cells with an anti-α-actin antibody (insets). These structures illustrate archetypal examples of the regular (B) and the irregular vascular patterns (C–F). Note the presence of vascular entities forming arcs (C) as well as large (D) or tight (E) networks. Images in which straight blood vessels run in parallel have also been observed (F). In the irregular patterns, the vascular density is inferior to that observed in the regular pattern, as illustrated by the presence of avascular tumor nodules (D). Scale bars, 200 μm.
Expression of Agents of the Angiogenic Condition
The expressions of 13 stimulators and 1 inhibitor (TSP1) of angiogenesis were studied by in situ hybridization with specific riboprobes (Figure 3) ▶ on 10 benign and 6 malignant pheochromocytomas. Genes encoding VEGFR-1 and VEGFR-2, ETB, Tie2, TSP1, and PPET-1 were expressed exclusively in vascular endothelial cells (ECs). VEGF receptors and ETB transcripts were present in the endothelium of all blood vessels, with a particularly strong expression of VEGFR-1. Tie2 mRNA was also detected in both large blood vessels and capillaries at very low levels. However, Tie2 mRNA was not detectable in a great number of blood vessels within the tumor samples. TSP1 expression was present at a high level in a limited subpopulation of ECs; PPET1 labeling was observed in a still more limited number of ECs, but at a very high level. The gene encoding the transcription factor EPAS1 was expressed in ECs of all vessels, irrespective of their size and, together with VEGF mRNA, in chromaffin cells, identified by tyrosine hydroxylase and neuron-specific enolase immunostaining. HIF-1α, PPET-3, and ECE1 (data not shown) transcripts were ubiquitously expressed in these sections. In contrast, mRNAs encoding angiopoietins were hardly detectable in all pheochromocytomas, with the exception of Ang-2 transcripts, which were detected in some ECs in the most invasive malignant tumor of this study (M6, data not shown). Finally, ETA displayed a heterogeneous pattern of expression. Transcripts encoding this receptor were detected mostly in the first layer of pericytes surrounding large and medium size blood vessels. Surprisingly, in two malignant samples, ETA mRNA was not present in the vessel wall but in tumor cells.
Figure 3.
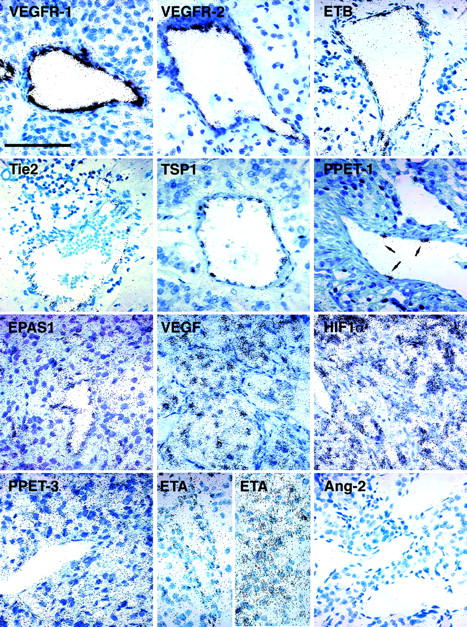
Sites of expression of angiogenesis-related factors in pheochromocytomas revealed by observation under bright-field illumination at a high magnification. VEGFR-1, VEGFR-2, ETB, Tie2, TSP1, and PPET-1 are restricted to ECs. Note the presence of PPET-1 in very few ECs in the blood vessel wall (arrows). EPAS1 is present in both ECs and chromaffin cells, which express large amounts of VEGF transcript. Genes encoding HIF-1α and PPET-3 are ubiquitously expressed whereas ETA has a heterogeneous pattern of expression. It is present either in pericytes (left) or in tumor cells (right). Ang-2 is not detectable in these tissues. Scale bar, 100 μm.
To estimate the differences in these gene’s expression levels between benign and malignant tumors, we have semiquantitatively evaluated the hybridization signals. No difference was observed for mRNA encoding TSP1, HIF-1α, angiopoietins, Tie2, ECE1, PPET-1 and PPET-3. The detailed individual values and statistical analysis for genes that presented a variation (EPAS1, VEGF, VEGFR-1, VEGFR-2, and ETB) are reported in Table 2 ▶ . An average twofold increase was observed for the transcription factor EPAS1 (Figure 4) ▶ and for VEGF (Figure 5, A and D) ▶ in tumor tissue. In the wall of blood vessels, we also observed an overexpression of EPAS1 (Figure 4) ▶ , both of the VEGF receptors (Figure 5; B, C, E, and F) ▶ , and the ETB receptor (Figure 6) ▶ . ETA (Figure 7) ▶ was nearly absent in benign samples and exhibited a heterogeneous tissue distribution in malignant pheochromocytomas (pericytes or tumor cells); the significance of these differences could therefore not be statistically assessed. Among all of the genes studied, ETB and ETA stand out as those with the best prognostic value (ie, the highest individual value for a benign tumor was equal, but never superior, to the lowest value of a malignant pheochromocytoma) (Figure 8) ▶ .
Table 2.
Semiquantitative Analysis of Differentially Expressed Genes in All Benign (B1-B10) and Malignant (M1-M6) Pheochromocytomas
| Probes | EPAS1 | EPAS1 | VEGF | VEGFR-1 | VEGFR-2 | ETB |
|---|---|---|---|---|---|---|
| cell type | EC | TC | TC | EC | EC | EC |
| B1 | 2.5 | 2.0 | 3.5 | 5.0 | 2.5 | 2.0 |
| B2 | 2.5 | 2.0 | 2.5 | 2.0 | 2.5 | 2.0 |
| B3 | 1.5 | 1.5 | 2.5 | 3.0 | 2.0 | 2.0 |
| B4 | 1.0 | 0.5 | 3.0 | 4.0 | 2.0 | 2.0 |
| B5 | 1.5 | 0.0 | 0.5 | 2.0 | 2.0 | 1.5 |
| B6 | 1.0 | 0.0 | 0.0 | 2.0 | 0.5 | 0.5 |
| B7 | 1.0 | 0.0 | 0.0 | 2.0 | 1.5 | 1.0 |
| B8 | 1.5 | 0.0 | 0.5 | 4.0 | 3.5 | 0.5 |
| B9 | 3.0 | 1.5 | 2.0 | 6.0 | 2.5 | 2.5 |
| B10 | 1.5 | 0.5 | 0.0 | 3.5 | ND | ND |
| M1 | 3.5 | 1.5 | 2.5 | 5.0 | 4.0 | 3.0 |
| M2 | 3.0 | 1.0 | 3.0 | 6.0 | 3.0 | 4.0 |
| M3 | 3.0 | 2.0 | 3.0 | 4.0 | 3.0 | 3.0 |
| M4 | 3.0 | 2.0 | 3.5 | 5.0 | 3.5 | 2.5 |
| M5 | 2.5 | 1.5 | 3.5 | 6.0 | 2.0 | 2.5 |
| M6 | 3.5 | 2.5 | 3.5 | 5.0 | 3.0 | 4.0 |
| Mean B | 1.7 ± 0.23 | 0.8 ± 0.27 | 1.4 ± 0.43 | 3.4 ± 0.45 | 2.1 ± 0.27 | 1.6 ± 0.24 |
| Mean M | 3.1 ± 0.15 | 1.8 ± 0.21 | 3.1 ± 0.24 | 5.2 ± 0.31 | 3.1 ± 0.27 | 3.2 ± 0.28 |
| M/B Ratio | 1.8 | 2.2 | 2.2 | 1.5 | 1.5 | 2 |
| P value | 0.0007 | 0.029 | 0.011 | 0.12 | 0.031 | 0.0009 |
Mean values are indicated ± SEM.
EC, Endothelial cells; TC, tumor cells; ND, not determined.
Figure 4.
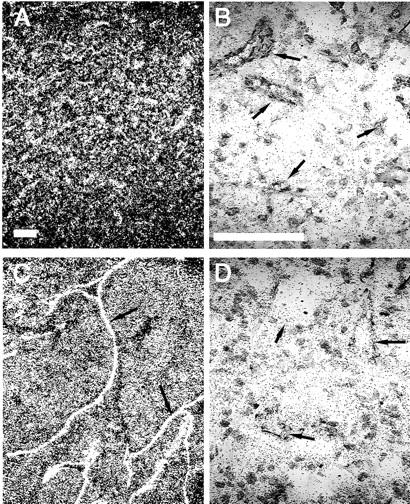
Expression of EPAS1 transcripts in a benign (A, B) and a malignant (C, D) pheochromocytoma. Observation under dark-field (A, C) or bright-field (B, D) illuminations. Note the overexpression of EPAS1 in the malignant tumor, especially in ECs of the blood vessels wall (arrows). Scale bars, 100 μm.
Figure 5.

In situ hybridization of genes of the VEGF system. Serial sections of a benign (A–C) and a malignant (D–F) pheochromocytoma radiolabeled with VEGF (A, D), VEGFR-1 (B, E), and VEGFR-2 (C, F) probes. Signals are observed under dark-field illumination. The presence of VEGF transcripts is detected in tumoral cells, whereas the receptors are expressed in vascular ECs. Note that these three markers are expressed at a higher level in the malignant tissue. Scale bar, 100 μm.
Figure 6.
Expression of the ETB receptor in a benign (A, B) and a malignant (C, D) pheochromocytoma. Observation under dark-field illumination (A, C) reveals a higher density of ETB-positive ECs in the malignant tissue (C) compared to the benign neoplasm (A). The intensity of the signal for one cell, as shown in bright-field observations (B, D) is also stronger in the malignant pheochromocytoma (D). Arrows, blood vessels. Scale bars, 100 μm.
Figure 7.

Expression of the ETA receptor in a benign (A) and two malignant (B, C) pheochromocytomas. No ETA labeling is detected in a benign neoplasm whereas there is a strong signal in malignant tissues, either in pericytes (B) or in tumor cells (C). Dark-field pictures. Arrows, blood vessels. Scale bar, 100 μm.
Figure 8.

Expression levels of endothelin receptors in benign and malignant pheochromocytomas: comparison of individual values. The values correspond to the intensity of labeling in ECs for ETB gene (A) and in either pericytes or tumor cells for ETA mRNA (B). Note the absence of overlap between these levels of expression in patients with benign tumors when compared to the malignant pheochromocytomas.
To determine whether there was a correlation between the expression of these genes for each patient, we performed a statistical correlation between individual data points for all genes that exhibited a difference between benign and malignant lesions in the same cell type. A high correlation was obtained for EPAS1 and VEGF in tumor cells (correlation factor, 0.81; P < 0.0001), and for EPAS1 and ETB (correlation factor, 0.83; P < 0.0001), and EPAS1 and VEGFR-2 (correlation factor, 0.72; P = 0.0025) in ECs.
To validate our semiquantitative evaluation of gene expression, we performed real-time RT-PCR for three of the overexpressed genes, EPAS1, VEGF, and ETB, on two benign (B6, B8) and two malignant (M8, M9) pheochromocytomas (Figure 9) ▶ . The mean values of these experiments showed a 4.5-fold increase of EPAS1 mRNA (P < 0.0001) and a 3.5-fold induction of VEGF (P < 0.0001) in malignant versus benign, after normalization with endogenous control RNAs (18S ribosomal). And, as observed in situ, ETB levels emerged as the most reliable prognostic tool; this gene appears overexpressed 10-fold in the malignant pheochromocytomas (P < 0.0001). Altogether, these results strongly support the relevance of the in situ hybridization data on gene expression levels.
Figure 9.

Real-time RT-PCR quantification of EPAS1, VEGF, and ETB transcripts in benign versus malignant pheochromocytomas. Mean values ± SEM of relative mRNA expressions in two benign (hatched bars) versus two malignant (black bars) tumors are presented as a gene/18S ratio.
Discussion
One of the main difficulties in the management of pheochromocytomas is the absence of reliable criteria for distinguishing malignant from benign tumors. Actually, the diagnosis of malignancy still depends on the in situ recurrence of the tumor or the occurrence of metastasis. In view of the current concept of neovascularization being necessary for tumor growth, and because pheochromocytomas are considered as highly vascularized tumors, it was pertinent to correlate their angiogenic status with their invasive behavior. Two independent reports recently examined the vascular density in pheochromocytomas but reached discrepant conclusions. In one study, Liu and colleagues 18 found a correlation between the density of microvessels stained for factor VIII and the invasive behavior of pheochromocytomas. In contrast, a recent report by Ohji and colleagues 19 reported the absence of a statistical association between microvascular counts after CD34 immunolabeling and malignancy. We therefore analyzed the vascular architecture of pheochromocytomas using a qualitative approach, together with an evaluation, using in situ hybridization and real-time PCR, of the mRNA expression of several agents (promoters and inhibitor) of angiogenesis.
Our observations on the vascular structures of these tumors revealed that all malignant pheochromocytomas exhibited an abnormal vascular architecture, characterized essentially by an irregular pattern of large vascular volumes flattened between the tumor nodules. In contrast, all but one benign tumor exhibited a regular pattern of short straight capillaries. Interestingly, the irregular patterns observed in malignant pheochromocytomas resembled some of the periodic acid-Schiff (PAS) patterns described by Folberg and colleagues 32 in primary uveal melanomas. In particular, we observed a strong analogy with the parallel, arc, and network PAS patterns. Networks and abnormal vascular architecture have previously been described in three-dimensional images in mammary carcinomas 33 and in colon cancer 34 but have never been reported in two-dimensional images. Moreover, the PAS-stained patterns, which were first ascribed to blood vessels, are now thought to consist of tumor-lined vascular channels, generated by the new process of vasculogenic mimicry proposed by Maniotis and colleagues. 35-37 Our observations of comparable motifs on pheochromocytoma tissue sections, using well-established vascular markers (CD34 and α-actin) is, to our knowledge, the first demonstration of the existence of such vascular patterns of endothelial- and pericyte-lined channels.
The abnormal, irregular vascular architecture in pheochromocytomas appears as one consistent trait of malignancy. It is worth noting that our classification of a benign tumor in the malignant group may be of prognostic value, as in the case of patient M2 whose primary tumor was first diagnosed as benign but presented the irregular vascular pattern. In addition, the benign tumor that exhibited this architecture was the largest of the benign group and presented high levels of angiogenic factors. A particular attention should therefore be paid in the follow-up of this patient.
The marked difference in vascular morphology between benign and malignant tumors supports our assumption that blood vessel counting is probably not appropriate to characterize these tumors because the choice of counting strategy (number, length, branching) will inevitably influence the results.
To unambiguously distinguish malignant from benign pheochromocytomas, we attempted to characterize other features, which may be causal in inducing this typical vascular architecture. We investigated the angiogenesis status by comparing the expression level of pro- and anti-angiogenic factors, as a means of distinguishing malignancy. Because nothing was known about the expression of angiogenic factors in pheochromocytomas, we chose to screen for the expression of 13 known or putative angiogenic agents and of one angiostatic molecule (TSP1).
The increased expression of the endothelin receptors ETB in ECs and of ETA in pericytes or tumor cells is a very interesting observation because these overexpressions in malignant tumors are, in addition to the vascular architecture, the most reproducible traits distinguishing benign and malignant tumors. Thus, among the 14 genes studied by in situ hybridization, ETB and ETA appear as the most reliable factors to identify an invasive pheochromocytoma. Interestingly, in these tumors, the endothelin precursors PPET-1, PPET-3, and their maturation enzyme ECE1 are not up-regulated by malignancy. Both ET-1 and ET-3 have been shown to induce EC migration and proliferation via the ETB receptor. 38 In the pheochromocytomas, PPET-1 mRNA was occasionally detected in ECs whereas PPET-3 was widely expressed in the tumoral tissue. Thus, as ET-3 does not bind to the ETA receptor, 39 it seems likely that the putative contribution of the endothelin system to the vascularization of these tumors, and particularly to the malignant lesions, is mediated by an ET-3 activity via the ETB receptor. Whether the peculiar induction of ETB in malignant pheochromocytomas is a cause or a consequence of the angiogenic phenotype of ECs remains to be addressed.
In contrast to genes of the Tie/angiopoietin system, which did not seem to be involved in the vascularization of pheochromocytomas, an approximately twofold excess in VEGF and both of its receptor’s expression level was measured in malignant versus benign tumors. Such observations were previously reported in many human tumors. 40-43 The overexpression of VEGF and VEGFR-2 is in keeping with the concept of tumor growth fueled by VEGF-dependent neoangiogenesis. In addition, the recent assumption by Carmeliet and colleagues 44 that, in pathological conditions, VEGFR-1 is not only a decoy receptor 45 but also a bona fide signal transducer receptor is in favor of an active angiogenic function of VEGFR-1 in malignant pheochromocytomas.
We have observed a strong correlation between the expressions of EPAS1 and of VEGF in tumor cells of malignant and benign pheochromocytomas. Such a correlation has recently been described in stromal cells of capillary hemangioblastomas, 46 in bladder cancer, 47 in renal cell carcinoma, 48 and in non-small-cell lung cancer. 49 It has previously been reported that VEGF transcription is induced by EPAS1 10,50 and by HIF-1α, 9 via the hypoxia responsive elements contained in its promoter. 51 Blancher and colleagues 52 recently reported a highly significant correlation between EPAS1 mRNA and protein levels in human breast carcinoma cell lines. Thus, if these findings also apply to pheochromocytomas, our observations on the expression of EPAS1 mRNA are highly suggestive of the presence of the protein and putatively of an activity of this transcription factor in these tumors. In contrast, Blancher and colleagues 52 did not observe a linear relation between mRNA and protein levels of HIF-1α, confirming the importance of posttranslational regulation in HIF-1α modulation. 53,54 Although we have not observed any correlation between HIF-1α and VEGF levels of expression, we cannot exclude the possibility of an up-regulation of this transcription factor at protein level in malignant versus benign lesions.
In summary, malignant pheochromocytomas are bigger, exhibit a peculiar irregular pattern of vascular architecture, have an induced VEGF pathway, a higher level of EPAS1 and particularly of the ETB and ETA receptors than the benign tumors. The present results, which draw a limit between benign and malignant tumors, may contribute to the development of new prognostic tools to evaluate the malignant potential of a pheochromocytoma. They provide a basis to envisage new therapies based on the repression of neovascularization.
Acknowledgments
We thank Dr. Baviera for the gift of most tumor samples, H. Kempf and M. Brand for the probes for genes of the endothelin system, J. J. Feige for TSP1 plasmid, J. Plouet for VEGF and VEGFR-1 cDNAs, S. Mc Knight for EPAS1, M. T. Morin and F. Mongiat for their great technical assistance, F. Mathieu for precious help in statistical analysis, A. P. Gimenez-Roqueplo for real-time PCR technical formation, and K. Bernstein for critical reading of the manuscript.
Footnotes
Address reprint requests to Judith Favier, Collège de France, INSERM U36, 11 Place Marcelin Berthelot, Paris, Cedex 05, France 75231. E-mail: jean-marie.gasc@college-de-france.fr.
Supported in part by grant AOM95201 from the Assistance Publique–Hôpitaux de Paris, Délégation à la Recherche Clinique, for the Cortico et Medullosurrénales: Etude des Tumeurs Endocrines Network; and a fellowship from la Ligue Contre le Cancer (to J. F.).
References
- 1.Bravo EL: Evolving concepts in the pathophysiology, diagnosis, and treatment of pheochromocytoma. Endocr Rev 1994, 15:356-368 [DOI] [PubMed] [Google Scholar]
- 2.Shapiro B, Sisson JC, Lloyd R, Nakajo M, Satterlee W, Beierwaltes WH: Malignant phaeochromocytoma: clinical, biochemical and scintigraphic characterization. Clin Endocrinol (Oxf) 1984, 20:189-203 [DOI] [PubMed] [Google Scholar]
- 3.Pattarino F, Bouloux PM: The diagnosis of malignancy in phaeochromocytoma. Clin Endocrinol (Oxf) 1996, 44:239-241 [DOI] [PubMed] [Google Scholar]
- 4.Plouin PF, Chatellier G, Fofol I, Corvol P: Tumor recurrence and hypertension persistence after successful pheochromocytoma operation. Hypertension 1997, 29:1133-1139 [DOI] [PubMed] [Google Scholar]
- 5.O’Riordain DS, Young WF, Jr, Grant CS, Carney JA, van Heerden JA: Clinical spectrum and outcome of functional extraadrenal paraganglioma. World J Surg 1996, 20:916-922 [DOI] [PubMed] [Google Scholar]
- 6.Carmeliet P, Jain RK: Angiogenesis in cancer and other diseases. Nature 2000, 407:249-257 [DOI] [PubMed] [Google Scholar]
- 7.Semenza GL: HIF-1 and human disease: one highly involved factor. Genes Dev 2000, 14:1983-1991 [PubMed] [Google Scholar]
- 8.Yancopoulos GD, Davis S, Gale NW, Rudge JS, Wiegand SJ, Holash J: Vascular-specific growth factors and blood vessel formation. Nature 2000, 407:242-248 [DOI] [PubMed] [Google Scholar]
- 9.Forsythe JA, Jiang BH, Iyer NV, Agani F, Leung SW, Koos RD, Semenza GL: Activation of vascular endothelial growth factor gene transcription by hypoxia-inducible factor 1. Mol Cell Biol 1996, 16:4604-4613 [DOI] [PMC free article] [PubMed] [Google Scholar]
- 10.Ema M, Taya S, Yokotani N, Sogawa K, Matsuda Y, Fujii-Kuriyama Y: A novel bHLH-PAS factor with close sequence similarity to hypoxia-inducible factor 1alpha regulates the VEGF expression and is potentially involved in lung and vascular development. Proc Natl Acad Sci USA 1997, 94:4273-4278 [DOI] [PMC free article] [PubMed] [Google Scholar]
- 11.Kappel A, Ronicke V, Damert A, Flamme I, Risau W, Breier G: Identification of vascular endothelial growth factor (VEGF) receptor-2 (Flk-1) promoter/enhancer sequences sufficient for angioblast and endothelial cell-specific transcription in transgenic mice. Blood 1999, 93:4284-4292 [PubMed] [Google Scholar]
- 12.Tian H, McKnight SL, Russell DW: Endothelial PAS domain protein 1 (EPAS1), a transcription factor selectively expressed in endothelial cells. Genes Dev 1997, 11:72-82 [DOI] [PubMed] [Google Scholar]
- 13.Jones N, Iljin K, Dumont DJ, Alitalo K: Tie receptors: new modulators of angiogenic and lymphangiogenic responses. Nat Rev Mol Cell Biol 2001, 2:257-267 [DOI] [PubMed] [Google Scholar]
- 14.Gerber HP, Condorelli F, Park J, Ferrara N: Differential transcriptional regulation of the two vascular endothelial growth factor receptor genes. Flt-1, but not Flk-1/KDR, is up-regulated by hypoxia. J Biol Chem 1997, 272:23659-23667 [DOI] [PubMed] [Google Scholar]
- 15.Mandriota SJ, Pepper MS: Regulation of angiopoietin-2 mRNA levels in bovine microvascular endothelial cells by cytokines and hypoxia. Circ Res 1998, 83:852-859 [DOI] [PubMed] [Google Scholar]
- 16.Li H, Chen SJ, Chen YF, Meng QC, Durand J, Oparil S, Elton TS: Enhanced endothelin-1 and endothelin receptor gene expression in chronic hypoxia. J Appl Physiol 1994, 77:1451-1459 [DOI] [PubMed] [Google Scholar]
- 17.Yamashita K, Discher DJ, Hu J, Bishopric NH, Webster KA: Molecular regulation of the endothelin-1 gene by hypoxia. Contributions of hypoxia-inducible factor-1, activator protein-1, GATA-2, AND p300/CBP. J Biol Chem 2001, 276:12645-12653 [DOI] [PubMed] [Google Scholar]
- 18.Liu Q, Djuricin G, Staren ED, Gattuso P, Gould VE, Shen J, Saclarides T, Rubin DB, Prinz RA: Tumor angiogenesis in pheochromocytomas and paragangliomas. Surgery 1996, 120:938-942 [DOI] [PubMed] [Google Scholar]
- 19.Ohji H, Sasagawa I, Iciyanagi O, Suzuki Y, Nakada T: Tumour angiogenesis and Ki-67 expression in phaeochromocytoma. BJU Int 2001, 87:381-385 [DOI] [PubMed] [Google Scholar]
- 20.Ahmed SI, Thompson J, Coulson JM, Woll PJ: Studies on the expression of endothelin, its receptor subtypes, and converting enzymes in lung cancer and in human bronchial epithelium. Am J Respir Cell Mol Biol 2000, 22:422-431 [DOI] [PubMed] [Google Scholar]
- 21.Egidy G, Eberl LP, Valdenaire O, Irmler M, Majdi R, Diserens AC, Fontana A, Janzer RC, Pinet F, Juillerat-Jeanneret L: The endothelin system in human glioblastoma. Lab Invest 2000, 80:1681-1689 [DOI] [PubMed] [Google Scholar]
- 22.Salani D, Di Castro V, Nicotra MR, Rosano L, Tecce R, Venuti A, Natali PG, Bagnato A: Role of endothelin-1 in neovascularization of ovarian carcinoma. Am J Pathol 2000, 157:1537-1547 [DOI] [PMC free article] [PubMed] [Google Scholar]
- 23.Plouin PF, Azizi M, Day M, Duclos JM, Corvol P: The pathophysiological basis of current pheochromocytoma management. Pinsky MR Dhainaut JFA eds. Pathophysiologic Foundations of Critical Care. 1992:pp 917-924 Williams & Wilkins, Baltimore
- 24.Heron E, Chatellier G, Billaud E, Foos E, Plouin PF: The urinary metanephrine-to-creatinine ratio for the diagnosis of pheochromocytoma. Ann Intern Med 1996, 125:300-303 [DOI] [PubMed] [Google Scholar]
- 25.Plouin PF, Duclos JM, Soppelsa F, Boublil G, Chatellier G: Factors associated with perioperative morbidity and mortality in patients with pheochromocytoma: analysis of 165 operations at a single center. J Clin Endocrinol Metab 2001, 86:1480-1486 [DOI] [PubMed] [Google Scholar]
- 26.Legault-Demare L, Lamande N, Zeitoun Y, Gros F, Scarna H, Keller A, Lando D, Cousin MA: Transition between isozymic forms of enolase during in vitro differentiation of neuroblastoma cells-II. Neurochem Int 1981, 3:301-310 [DOI] [PubMed] [Google Scholar]
- 27.Favier J, Kempf H, Corvol P, Gasc JM: Coexpression of endothelial PAS protein 1 with essential angiogenic factors suggests its involvement in human vascular development. Dev Dyn 2001, 222:377-388 [DOI] [PubMed] [Google Scholar]
- 28.Brand M, Le Moullec JM, Corvol P, Gasc JM: Ontogeny of endothelins-1 and -3, their receptors, and endothelin converting enzyme-1 in the early human embryo. J Clin Invest 1998, 101:549-559 [DOI] [PMC free article] [PubMed] [Google Scholar]
- 29.Favier J, Kempf H, Corvol P, Gasc J: Cloning and expression pattern of EPAS1 in the chicken embryo. Colocalization with tyrosine hydroxylase. FEBS Lett 1999, 462:19-24 [DOI] [PubMed] [Google Scholar]
- 30.Sibony M, Commo F, Callard P, Gasc J-M: Enhancement of mRNA in situ hybridization signal by microwave heating. Lab Invest 1995, 73:586-591 [PubMed] [Google Scholar]
- 31.Schmechel D, Marangos PJ, Brightman M: Neurone-specific enolase is a molecular marker for peripheral and central neuroendocrine cells. Nature 1978, 276:834-836 [DOI] [PubMed] [Google Scholar]
- 32.Folberg R, Pe’er J, Gruman LM, Woolson RF, Jeng G, Montague PR, Moninger TO, Yi H, Moore KC: The morphologic characteristics of tumor blood vessels as a marker of tumor progression in primary human uveal melanoma: a matched case-control study. Hum Pathol 1992, 23:1298-1305 [DOI] [PubMed] [Google Scholar]
- 33.Less JR, Skalak TC, Sevick EM, Jain RK: Microvascular architecture in a mammary carcinoma: branching patterns and vessel dimensions. Cancer Res 1991, 51:265-273 [PubMed] [Google Scholar]
- 34.Sun XF, Zhang H, Wu XC, Han YM, Hou GQ, Xian MS: Microvascular corrosion casting of normal tissue, transitional mucosa and adenocarcinoma in the human colon. Acta Oncol 1992, 31:37-40 [DOI] [PubMed] [Google Scholar]
- 35.Maniotis AJ, Folberg R, Hess A, Seftor EA, Gardner LM, Pe’er J, Trent JM, Meltzer PS, Hendrix MJ: Vascular channel formation by human melanoma cells in vivo and in vitro: vasculogenic mimicry. Am J Pathol 1999, 155:739-752 [DOI] [PMC free article] [PubMed] [Google Scholar]
- 36.Folberg R, Hendrix MJ, Maniotis AJ: Vasculogenic mimicry and tumor angiogenesis. Am J Pathol 2000, 156:361-381 [DOI] [PMC free article] [PubMed] [Google Scholar]
- 37.McDonald DM, Munn L, Jain RK: Vasculogenic mimicry: how convincing, how novel, and how significant? Am J Pathol 2000, 156:383-388 [DOI] [PMC free article] [PubMed] [Google Scholar]
- 38.Morbidelli L, Orlando C, Maggi CA, Ledda F, Ziche M: Proliferation and migration of endothelial cells is promoted by endothelins via activation of ETB receptors. Am J Physiol 1995, 269:H686-H695 [DOI] [PubMed] [Google Scholar]
- 39.Levin ER: Endothelins. N Engl J Med 1995, 333:356-363 [DOI] [PubMed] [Google Scholar]
- 40.Brown LF, Berse B, Jackman RW, Tognazzi K, Manseau EJ, Dvorak HF, Senger DR: Increased expression of vascular permeability factor (vascular endothelial growth factor) and its receptors in kidney and bladder carcinomas. Am J Pathol 1993, 143:1255-1262 [PMC free article] [PubMed] [Google Scholar]
- 41.Brown LF, Berse B, Jackman RW, Tognazzi K, Guidi AJ, Dvorak HF, Senger DR, Connolly JL, Schnitt SJ: Expression of vascular permeability factor (vascular endothelial growth factor) and its receptors in breast cancer. Hum Pathol 1995, 26:86-91 [DOI] [PubMed] [Google Scholar]
- 42.Guidi AJ, Abu-Jawdeh G, Tognazzi K, Dvorak HF, Brown LF: Expression of vascular permeability factor (vascular endothelial growth factor) and its receptors in endometrial carcinoma. Cancer 1996, 78:454-460 [DOI] [PubMed] [Google Scholar]
- 43.Yoshiji H, Gomez DE, Shibuya M, Thorgeirsson UP: Expression of vascular endothelial growth factor, its receptor, and other angiogenic factors in human breast cancer. Cancer Res 1996, 56:2013-2016 [PubMed] [Google Scholar]
- 44.Carmeliet P, Moons L, Luttun A, Vincenti V, Compernolle V, De Mol M, Wu Y, Bono F, Devy L, Beck H, Scholz D, Acker T, DiPalma T, Dewerchin M, Noel A, Stalmans I, Barra A, Blacher S, Vandendriessche T, Ponten A, Eriksson U, Plate KH, Foidart JM, Schaper W, Charnock-Jones DS, Hicklin DJ, Herbert JM, Collen D, Persico MG: Synergism between vascular endothelial growth factor and placental growth factor contributes to angiogenesis and plasma extravasation in pathological conditions. Nat Med 2001, 7:575-583 [DOI] [PubMed] [Google Scholar]
- 45.Hiratsuka S, Minowa O, Kuno J, Noda T, Shibuya M: Flt-1 lacking the tyrosine kinase domain is sufficient for normal development and angiogenesis in mice. Proc Natl Acad Sci USA 1998, 95:9349-9354 [DOI] [PMC free article] [PubMed] [Google Scholar]
- 46.Flamme I, Krieg M, Plate KH: Up-regulation of vascular endothelial growth factor in stromal cells of hemangioblastomas is correlated with up-regulation of the transcription factor HRF/HIF-2alpha. Am J Pathol 1998, 153:25-29 [DOI] [PMC free article] [PubMed] [Google Scholar]
- 47.Onita T, Ji PG, Xuan JW, Sakai H, Kanetake H, Maxwell PH, Fong GH, Gabril MY, Moussa M, Chin JL: Hypoxia-induced, perinecrotic expression of endothelial Per-ARNT-Sim domain protein-1/hypoxia-inducible factor-2alpha correlates with tumor progression, vascularization, and focal macrophage infiltration in bladder cancer. Clin Cancer Res 2002, 8:471-480 [PubMed] [Google Scholar]
- 48.Xia G, Kageyama Y, Hayashi T, Kawakami S, Yoshida M, Kihara K: Regulation of vascular endothelial growth factor transcription by endothelial PAS domain protein 1 (EPAS1) and possible involvement of EPAS1 in the angiogenesis of renal cell carcinoma. Cancer 2001, 91:1429-1436 [DOI] [PubMed] [Google Scholar]
- 49.Giatromanolaki A, Koukourakis MI, Sivridis E, Turley H, Talks K, Pezzella F, Gatter KC, Harris AL: Relation of hypoxia inducible factor 1 alpha and 2 alpha in operable non-small cell lung cancer to angiogenic/molecular profile of tumours and survival. Br J Cancer 2001, 85:881-890 [DOI] [PMC free article] [PubMed] [Google Scholar]
- 50.Wiesener MS, Turley H, Allen WE, Willam C, Eckardt KU, Talks KL, Wood SM, Gatter KC, Harris AL, Pugh CW, Ratcliffe PJ, Maxwell PH: Induction of endothelial PAS domain protein-1 by hypoxia: characterization and comparison with hypoxia-inducible factor-1alpha. Blood 1998, 92:2260-2268 [PubMed] [Google Scholar]
- 51.Levy AP, Levy NS, Wegner S, Goldberg MA: Transcriptional regulation of the rat vascular endothelial growth factor gene by hypoxia. J Biol Chem 1995, 270:13333-13340 [DOI] [PubMed] [Google Scholar]
- 52.Blancher C, Moore JW, Talks KL, Houlbrook S, Harris AL: Relationship of hypoxia-inducible factor (HIF)-1alpha and HIF-2alpha expression to vascular endothelial growth factor induction and hypoxia survival in human breast cancer cell lines. Cancer Res 2000, 60:7106-7113 [PubMed] [Google Scholar]
- 53.Kallio PJ, Pongratz I, Gradin K, McGuire J, Poellinger L: Activation of hypoxia-inducible factor 1alpha: posttranscriptional regulation and conformational change by recruitment of the Arnt transcription factor. Proc Natl Acad Sci USA 1997, 94:5667-5672 [DOI] [PMC free article] [PubMed] [Google Scholar]
- 54.Maxwell PH, Wiesener MS, Chang GW, Clifford SC, Vaux EC, Cockman ME, Wykoff CC, Pugh CW, Maher ER, Ratcliffe PJ: The tumour suppressor protein VHL targets hypoxia-inducible factors for oxygen-dependent proteolysis. Nature 1999, 399:271-275 [DOI] [PubMed] [Google Scholar]