

Abstract
Overexpression of the oncogene HER2/neu (c-erbB-2) occurs in up to 30% of breast cancers and is correlated with reduced survival, especially in node-positive disease. The aim of this study was to identify genes associated with the aggressive phenotype of HER2/neu-positive breast cancer cells using cDNA microarrays. RNA was extracted from three HER2/neu-positive and three HER2/neu-negative breast cancer cell lines. Pooled RNA was hybridized in duplicate to the breast specific microarray filters from Research Genetics containing 5184 unique cDNAs. Subsequently, a similar comparison was performed for pooled RNAs from 10 node-positive, ER-positive invasive ductal carcinomas, half of which were HER2/neu overexpressers. In HER2/neu overexpressing breast cancer cell lines, 90 (1.7%) genes were up-regulated and 46 (0.9%) were down-regulated, compared to cell lines with low HER2/neu protein levels. In contrast, in HER2/neu overexpressing primary breast cancers, more genes were down-regulated (N = 132, 2.5%) than up-regulated (N = 19, 0.4%). Many of the differentially expressed genes have previously not been known to play a role in human neoplasia, and some of them may represent novel tumor suppressor or oncogenes. No genes were up-regulated, and only a small number of genes were down-regulated both in cell lines and in carcinomas with high HER2/neu protein levels. These included transforming acidic coiled-coil containing protein 1, glycogen phosphorylase BB, complement 1q and one EST. The differential expression of select genes was confirmed by Northern blotting (trefoil factor 3) or by immunocytochemistry (glycogen phosphorylase BB, vimentin, KAI1). In an extended validation study, 18 of 41 ER-negative, but none of 46 ER-positive, breast carcinomas were found to express vimentin, and all but one of the vimentin-positive tumors were confined to the HER2/neu-negative subgroup (P = 0.0019). Our findings support an important role of the mammary stroma in determining the clinical breast cancer phenotype.
HER2/neu (c-erbB-2) is a proto-oncogene that is amplified and/or overexpressed in some 30% of human breast cancers. Numerous studies have shown that this event is associated with a more aggressive phenotype. In particular, HER2/neu overexpressing tumors are known to be refractory to various types of chemo- and endocrine therapy (often associated with down-regulation of the estrogen receptor; ER) and to be associated with shortened overall survival, especially in node-positive patients. 1-3 However, the mechanism(s) by which HER2/neu overexpression confers the more aggressive biological behavior are poorly understood. HER2/neu encodes a tyrosine kinase receptor, p185erbB-2, which is anchored in the cell membrane. Activation of this receptor leads to transduction of an extracellular signal to the nucleus via one of several signaling cascades including the ras/raf/mitogen-activated protein kinase pathway that ultimately leads to intranuclear activation of c-fos and c-jun. 3 A limited number of additional genes have been found to be up- or down-regulated by HER2/neu. 4-6
The principal aim of our study was to examine the gene expression profile of HER2/neu-positive and -negative breast cancer cells on a more global scale. To this end, we used recently developed cDNA microarray technology that allows the simultaneous evaluation of expression, at the mRNA level, of thousands of genes. 7 Several groups have used this technology to study gene expression patterns in human breast cancer. 8-11 We used it to answer the specific question whether HER2/neu-positive and -negative breast cancer cells could be distinguished by their gene expression profiles and whether this could be related to differences in biological effects. We used an array enriched in genes expressed in normal breast tissue to evaluate the effect of HER2/neu status on the expression level of novel genes with physiological functions in the human mammary gland. Some of the differentially expressed genes may be, directly or indirectly, responsible for the more aggressive properties of HER2/neu overexpressing tumor cells. In addition to new diagnostic and prognostic markers, this approach may also yield new therapeutic targets. Lastly, to determine whether differential gene expression in HER2/neu-positive and -negative breast cancer cells in vitro reflects differences in gene expression profiles in vivo, we subjected both breast cancer cell lines and primary carcinomas to cDNA microarray analysis. Our results suggest that a significant number of genes are up- or down-regulated in HER2/neu-positive breast cancer cells, but only a minority of them have previously been implicated in mammary tumorigenesis or human neoplasia in general. Surprisingly, only a small number of genes were found to be differentially expressed in HER2/neu-positive versus -negative breast cancer cells both in vitro and in vivo.
Materials and Methods
Cell Culture
Six commercially available breast carcinoma cell lines (obtained from the ICRF Cell Production Department, Clare Hall, London, UK) were cultured under the recommended optimum conditions (Dulbecco’s modified E4 medium (DMEM) (ICRF) supplemented with fetal calf serum (10%) and glutamine (2 mmol/L) except for BT474 which required DMEM:F12 (Life Technologies, Paisley, UK), fetal calf serum (10%), glutamine (2 mmol/L), penicillin (100U/ml), streptomycin (100 mg/ml), insulin (10 μg/ml), and EGF (10 ng/ml)). Three of these cell lines were known to be high expressers of HER2/neu (MDA-MB-361, SKBR3 and BT474) with the remaining three demonstrating low p185erbB-2 levels (MDA-MB-231, MDA-MB-435 and MDA-MB-468). The cells were harvested by trypsinization before reaching confluence. They were then pelleted and divided for RNA extraction (see below) and for paraffin section immunocytochemistry. Cell blocks were prepared by fixation of the pelleted cells in 10% buffered formalin for 30 minutes, followed by a wash in 70% ethanol for 30 minutes and 100% ethanol overnight at 4°C. The fixed cell buttons were then xylene cleared and embedded in paraffin.
Tissues
Ten breast carcinomas were selected from the ICRF frozen breast cancer archive for cDNA microarray analysis. The tumors had been stored at −80°C for 8 to 10 years following surgical excision. All were classified as invasive ductal carcinomas, of which half had been determined to be HER2/neu-positive. The HER2/neu status was originally determined by Southern blotting and subsequently confirmed by immunohistochemistry (IHC). All ten carcinomas were of intermediate or high combined grade, ER-positive (ER+) and lymph node positive. We used only ER+ primary tumors (as determined by ELISA and IHC) to focus on the HER2/neu pathway, as many studies have shown an inverse relation of ER to HER2/neu, which could confound analysis of genes regulated by HER2/neu in vivo. A second piece of each tumor was used for frozen section IHC. In addition, a representative formalin-fixed block of each case was selected for paraffin section IHC. A second group of 15 invasive ductal carcinomas was randomly selected from the ICRF frozen breast cancer archive for confirmatory Northern analysis. These tumors had variable grade, HER2/neu, ER, and nodal status. Formalin-fixed samples of these tumors were also used for paraffin section IHC. For further validation of the vimentin staining data, IHC for this marker was performed on 70 additional formalin-fixed, paraffin-embedded invasive ductal carcinomas with variable ER and HER2/neu status retrieved from the pathology files of the Roswell Park Cancer Institute.
RNA Isolation
Approximately 5 × 10⁶ cultured cells were pelleted, following harvesting at subconfluency, and total RNA was extracted using TRI reagent (ς-Aldrich, Inc., St. Louis, MO), as described in the protocol supplied by the manufacturer. The frozen breast carcinomas were homogenized using an Ultra Turrax T25 homogenizer, and total RNA was extracted by the same procedure as for the cell pellets. For the cell lines, 3.3 μg of total RNA was used for each line for each hybridization. For the frozen carcinomas, 5 μg RNA was used per case. Total RNA from the HER2/neu-positive samples was pooled (for a total of 10 μg for the cell lines and 25 μg for the carcinomas) and compared against pooled RNA from the HER2/neu-negative samples (see below).
cDNA Microarray Hybridization
GF225 (Research Genetics, Huntsville, AL) is a commercially available “breast-specific” cDNA filter containing 5184 unique cDNAs (0.5 ng per spot), including some 3000 named genes, in addition to 370 control points and housekeeping genes. According to the manufacturer, the array is enriched for genes expressed in human breast tissue. The filter is a 5 × 7 cm positively charged nylon membrane that may be re-used up to four times with careful handling. All filters used in this study were from the same lot. The hybridization of the filters with the pooled total RNA from HER2/neu-positive or -negative cell lines or carcinomas was performed in duplicate. Pre-hybridization, probe preparation (radiolabeled with Redivue [α-33P]dCTP (3000 Ci/mmol; Amersham-Pharmacia Biotech, Little Chalfont, Buckinghamshire, UK) and hybridization were conducted under the conditions recommended in the manual accompanying the Pathways 2 software (Research Genetics, Huntsville, AL). Unhybridized probe was washed from the GeneFilter at the recommended stringency (0.2X SSC/1% SDS).
Data Analysis
Following hybridization and stringent washing, the GeneFilter was exposed to a phosphor screen for periods of 1 hour, 3 hours, 5 hours, 10 hours, and 16 hours, and the subsequent images were scanned into a Storm PhosphorImager (Molecular Dynamics, Sunnyvale, CA). Comparisons between the images of HER2/neu-positive and -negative filters were made in triplicate using the Pathways 2 software and normalizing against all data points. Filters displaying similar maximum intensity and background radioactivity were selected for comparison against one another. Images generated from the HER2/neu-negative RNA species were coded green, and the HER2/neu-positive images were coded red. The images were then superimposed, and gene expression ratios calculated by the program. The expression ratios of all housekeeping genes and control points were used to calculate the mean and SD of each comparison. In the Pathways system, genes more highly expressed in the HER2/neu-positive samples were assigned positive ratios (≥1), while genes more highly expressed in the HER2/neu-negative samples had negative values (≤−1). All expression ratios lying 3 SD above (up-regulated) or below (down-regulated) the mean were selected and a combined table of possible significant data points from all three comparisons was produced. From this table all data points appearing only once were discarded. Subsequently all genes whose signal intensity was less than twice the background on both filters were eliminated from the list. The final lists were thus comprised of genes that were expressed above background levels and that were significantly differentially expressed in HER2/neu-negative and -positive samples in at least two of three comparisons.
Northern Blot Analysis
Total RNA from the cell lines and carcinomas (20 μg/lane) was run on a 1% agarose gel in MEA (0.2 mol/L MOPS, 0.05 mol/L sodium acetate, 0.01 mol/L sodium EDTA, pH 7)/formaldehyde, and transferred by capillary action onto Hybond-N+ nitrocellulose paper (Amersham-Pharmacia Biotech). Total RNA extracted from the 15 random breast carcinomas was also Northern blotted. A PCR product was obtained for trefoil factor 3 (TTF3) (plasmid kindly supplied by Dr. Karin Oien, Beatson Institute, Glasgow, UK) using primers 5′-CAGTCCTGAGCTGCGTCCCG-3′ and 5′-CAGGCACGAAGAACTGTCCTCG-3′ under previously described conditions 12 and purified by phenol-chloroform extraction. DECA Template GAPDH-mouse (10 ng/μl; Ambion Inc., Austin, TX) was included as a positive control. Approximately 20 ng of each probe was radiolabeled with Redivue [α-32P]dCTP (3000 Ci/mmol; Amersham-Pharmacia Biotech) using the random prime labeling system Rediprime II (Amersham-Pharmacia Biotech), as laid out in the supplied protocol. Prehybridization and hybridization were performed at 65°C, in the presence of PerfectHyb Plus (ς-Aldrich, Inc.), and blots were washed in increasingly stringent conditions (1X SSC/0.1% SDS twice, 0.5X SSC/0.1% SDS twice) before exposure to autoradiographical film at −70°C. The labeled filters were exposed for 16 and 22 hours (cell lines) or 65 hours (carcinomas), respectively.
Immunohistochemistry (IHC)
Immunohistochemical evaluation of glycogen phosphorylase isotype BB (GPBB) and vimentin expression was performed on 5-μm paraffin sections which were dewaxed, rehydrated, and quenched in 0.3% H2O2 in methanol for 20 minutes. For GPBB staining, the sections were reacted with monoclonal antibody (mAb) 8.F.313 (U.S. Biological, Swampscott, MA) at 0.1 μg/ml for one hour at room temperature (RT), following a 20 minutes antigen retrieval step in sub-boiling 0.1 mol/L EDTA (pH 8.0). The detection reaction followed the ChemMate protocol from DAKO (Ely, UK). A GPBB overexpressing colon carcinoma served as a positive external control, and benign breast epithelium and macrophages served as positive internal controls. For vimentin staining, the sections were reacted with mAb V9 (DAKO) at a 1:500 dilution for 2 hours at RT, following a 20 minute antigen retrieval step in sub-boiling 0.01 mol/L citrate buffer (pH 6.0). The detection reaction followed the Vectastain Elite ABC Kit protocol (Vector Laboratories, Burlingame, CA). Normal connective tissue was used as an external positive control, and benign stromal cells served as ubiquitous internal positive controls. Immunohistochemistry for KAI1 was performed on 6 μm frozen sections which were quenched in 10% H2O2 for 20 minutes and blocked with 10% FCS for 20 minutes. The sections were then reacted with mAb 50F11 (PharMingen, San Diego, CA) at 0.1 μg/ml for 1 hour at RT. The detection reaction used the DAKO ChemMate kit. Benign breast epithelium served as a positive external control, and inflammatory cells represented positive internal controls. For all three markers, diaminobenzidine was used as chromogen and hematoxylin as counterstain. The GPBB and vimentin immunostains were semiquantitatively assessed by multiplying the percentage of positive cells by the average staining intensity (1+, 2+, 3+), with a theoretical range in scores from 0 to 300. In the extended cohort of carcinomas (N = 87), cases were scored as vimentin positive if more than 5% of neoplastic cells stained. The KAI1 immunostains of the frozen breast cancer sections were categorized as negative if less than 10% of neoplastic cells showed membrane reactivity.
Results
cDNA Microarray Analysis of Differential Gene Expression in Breast Cancer Cell Lines
We compared the gene expression profile of three HER2/neu-positive breast cancer cell lines with that of three HER2/neu-negative breast cancer cell lines to specifically identify genes whose expression level may be linked to the HER2/neu status. Duplicate hybridizations to the cDNA microarrays and exposures of the hybridized filters to the phosphor imaging screen for variable periods of time produced multiple images for each RNA species. Three different pairs of images were used to detect differential gene expression, and in each case the cut-offs were determined by statistical analysis (see Materials and Methods). On average, 211 genes (4.1%) were up-regulated and 99 genes (1.9%) were down-regulated in HER2/neu-positive breast cancer cell lines. Figure 1 ▶ illustrates a representative comparison. Over half of the genes were found to be differentially expressed in only one of three comparisons and thus were disregarded, while 136 genes appeared in two or three analyses. Among these, 90 genes were up-regulated. These included 37 unknown genes (ESTs, KIAAs) and 53 named genes (Table 1) ▶ . The up-regulated genes included several genes that are known to play a role in mammary tumorigenesis such as mammaglobin, heat shock protein 70 (HSP70), trefoil factor 3 (TFF3) and tumor protein D52. Five other genes (α1-catenin, CD52, serine protease inhibitor Kunitz type I, interferon receptor 1 and histone acetyltransferase) have known roles in other types of neoplasia but not breast cancer. The largest group of named genes has no defined role in human neoplasia. It includes well-characterized genes such as hepatocyte nuclear factor 3 (HNF3), ribophorin II, ferritin, and myosin. The 46 consistently down-regulated genes are listed in Table 2 ▶ . Of these, 22 were named genes including several genes (eg, metallothionein 1E, transforming acidic coiled coil containing protein 1 (TACC1), vimentin) previously implicated in breast cancer. Five genes (tissue factor pathway inhibitor (LAC1), α2-glycoprotein 1, aldo-keto reductase family 1 member C1, GPBB, high mobility group protein isoforms I and Y) were described in other types of human tumors. Again, the largest group of named genes has previously not been implicated in neoplasia.
Figure 1.
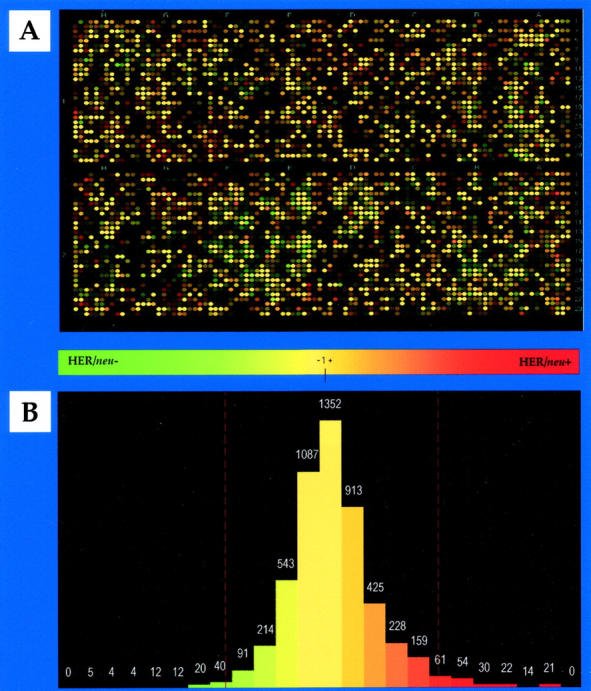
Representative comparison of gene expression profiles in pooled HER2/neu-negative and -positive breast cancer cell lines. A: Pathways generated green/red overlay. The green spots represent genes more highly expressed in pooled HER2/neu-negative breast cancer cell lines, the red spots represent genes more highly expressed in pooled HER2/neu-positive breast cancer cell lines, and the yellow spots indicate genes expressed at similar levels. B: Histogram derived from A. Cutoffs were determined by statistical analysis and are indicated by red lines. In this analysis, 202 genes (3.9%) were up-, and 94 genes (1.8%) were down-regulated in HER2/neu-overexpressing breast cancer cells in vitro.
Table 1.
Up-Regulated Genes in HER2/neu-Positive Breast Cancer Cell Lines (N = 90)
| Accession number | Gene | BC | OC | Chromosome location | Average expression ratio |
|---|---|---|---|---|---|
| AA991451 | Mammaglobin 1 | X | 11q13 | 3.45 | |
| AA864271 | mRNA from cDNA clone DKFZp586B1810 | 9 | 3.41 | ||
| AI000670 | EST | U/K | 3.28 | ||
| H59916 | CD24 | X | 6q21 | 3.23 | |
| AA454810 | Membrane component, chromosome 1, surface marker 1 | 1p32-31 | 3.22 | ||
| AA918089 | EST | U/K | 3.19 | ||
| AA504201 | mRNA from cDNA clone DKFZp586J2118 | 1 | 3.09 | ||
| H68664 | mRNA from cDNA clone DKFZp564D246 | 7 | 3.02 | ||
| AA93874 | KIAA0344 | 12 | 3.00 | ||
| AA994785 | TNF superfamily, member 10 | 3q26 | 3.00 | ||
| AA608567 | ATPase, H+ transporting, lysosomal (vacuolar proton pump), member J | U/K | 2.85 | ||
| W80724 | EST | 17 | 2.79 | ||
| AA991871 | Hepatocyte nuclear factor 3a (HNF3a) | 14q12-13 | 2.78 | ||
| AA664179 | Keratin 18 | X | 12q13 | 2.78 | |
| AI000971 | EST | U/K | 2.69 | ||
| H81115 | BAC clone | 16 | 2.66 | ||
| AA083485 | Ribosomal protein L19 | X | 17p12-q11 | 2.64 | |
| N62666 | EST | 4 | 2.63 | ||
| AA682392 | EST | 17 | 2.59 | ||
| AA487253 | Myosin, light polypeptide, regulatory, non-sarcomeric | 18 | 2.59 | ||
| AA485441 | EST | 17 | 2.57 | ||
| AA495790 | Ras homolog gene family, member B (RhoB) | 2pter-p12 | 2.54 | ||
| AA489232 | ATPase, H+ transporting, lysosomal (vacuolar proton pump) membrane sector associated M8–9 protein | X | 2.54 | ||
| AA490497 | HCG-1 | 13 | 2.50 | ||
| AA630449 | Epididymal secretory protein | 14 | 2.49 | ||
| AI299426 | EST | 11 | 2.49 | ||
| AA488658 | Heat shock protein 70 (HSP70) | X | 6p21.3 | 2.46 | |
| R28294 | Glycine cleavage system protein H | 2 | 2.45 | ||
| W86202 | EST | U/K | 2.45 | ||
| AA683102 | RAD21 | 5 | 2.44 | ||
| AA918050 | EST | U/K | 2.43 | ||
| AI005519 | Ribosomal protein S24 | 10q22-23 | 2.41 | ||
| AA453783 | KIAA0187 | U/K | 2.39 | ||
| AA182845 | TNF-α inducible cellular protein | 10 | 2.38 | ||
| AA693571 | Minichromosome maintenance deficient 3-associated protein | 21q22.3 | 2.37 | ||
| H99123 | EST | U/K | 2.37 | ||
| W73966 | EST | 5 | 2.35 | ||
| AA991856 | Ribophorin II | 20q12-13.1 | 2.34 | ||
| AA446103 | Lectin mannose-binding, 1 | 18q21.3-22 | 2.32 | ||
| AA430653 | EST | 5 | 2.31 | ||
| N91817 | EST | 9 | 2.31 | ||
| AI025126 | EST | 7 | 2.30 | ||
| AA683050 | Ribosomal protein S8 | 1p34.1-32 | 2.30 | ||
| AA932521 | FK506-binding protein 4 | 12 | 2.29 | ||
| AA459100 | Tumor protein D52 | X | 8q21 | 2.29 | |
| AA676957 | α1-Catenin | X | 5q31 | 2.28 | |
| AA495936 | Microsomal glutathione S-transferase 1 | 12 | 2.26 | ||
| AA973283 | CDW52 (CAMPATH-1 antigen) | X | 1p36 | 2.26 | |
| AA905624 | KIAA0182 | 16 | 2.25 | ||
| H05099 | EST | U/K | 2.24 | ||
| T78584 | Splice factor | U/K | 2.24 | ||
| AA418813 | EST | U/K | 2.24 | ||
| AA047338 | Proteasome subunit α6 | 14q13 | 2.24 | ||
| AA455300 | Cold shock domain protein A | 12p13.1 | 2.23 | ||
| AA040742 | Poly(A)-binding protein 2 | 14q11.2-13 | 2.23 | ||
| AA991162 | EST | U/K | 2.22 | ||
| N74131 | Trefoil factor 3 (human secretory protein P1B) | X | 21q22.3 | 2.21 | |
| AA873604 | Cysteine-rich protein 1, intestinal | 7q11.23 | 2.20 | ||
| AA975209 | Serine protease inhibitor, Kunitz type I | X | 15 | 2.19 | |
| AA488627 | H2A histone family, member Y | 5q31.1-32 | 2.19 | ||
| AA488349 | Interferon receptor 1 | X | 21q22 | 2.18 | |
| R70263 | EST | U/K | 2.18 | ||
| AA478949 | Discs (Drosophila), large homolog 5 | 10q23 | 2.15 | ||
| AA976544 | KIAA0788 | 17 | 2.13 | ||
| AI369331 | Protein tyrosine phosphatase, non-receptor type substrate 1 | 20p13 | 2.12 | ||
| AA873427 | Ferritin, light polypeptide | 19q13.3-13.4 | 2.12 | ||
| AA485959 | Keratin 7 | X | 12q12-14 | 2.09 | |
| R77432 | Mannose-P-dolichol utilization defect 1 | 17p13.1-12 | 2.09 | ||
| AI001180 | Oxidase (cytochrome c) assembly-like 1 | 14q11.2 | 2.09 | ||
| AA676460 | EST | U/K | 2.08 | ||
| AI090094 | Human factor VIII gene L1 element insertion DNA | U/K | 2.07 | ||
| AA282263 | KIAA0556 | 16 | 2.06 | ||
| AA620580 | Proteasome subunit β3 | 2q35 | 2.05 | ||
| AA485994 | DEAD/H box polypeptide | 22q13.1 | 2.05 | ||
| AA962301 | KIAA0215 | 11 | 2.05 | ||
| AA994796 | LIM and SH3 protein 1 | X | 17q11-21.3 | 2.04 | |
| AA478066 | Membrane-associated tyrosine- and threonine-specific cdc2-inhibitory kinase (PKMYT1) | U/K | 2.01 | ||
| H14805 | EST | U/K | 1.99 | ||
| AA598797 | Histone acetyltransferase | X | 2q31.2-33.1 | 1.99 | |
| AA505111 | Copine III | 8 | 1.97 | ||
| AA291069 | EST | U/K | 1.97 | ||
| H16256 | Dihydropyrimidinase-like 3 | 5q32 | 1.96 | ||
| AA668189 | Small nuclear ribonucleoprotein polypeptide F | U/K | 1.95 | ||
| AA195002 | PAC clone | U/K | 1.95 | ||
| N74574 | EST | U/K | 1.94 | ||
| AA669341 | Unactive progesterone receptor | 1 | 1.94 | ||
| H95976 | KIAA0251 | 16 | 1.94 | ||
| H67086 | Similar to S. cerevisiae SSM4 | 5p15.2 | 1.91 | ||
| AA608514 | H3 histone family, 3B | 17q25 | 1.90 | ||
| AA404619 | CD73 | X | 6q14-21 | 1.85 |
BC, breast cancer-associated gene; OC, other cancer-associated gene; U/K, unknown.
Table 2.
Down-Regulated Genes in HER2/neu-Positive Breast Cancer Cell Lines (N = 46)
| Accession number | Gene | BC | OC | Chromosome location | Average expression ratio |
|---|---|---|---|---|---|
| AA872383 | Metallothionein 1E | X | 16q13 | −3.85 | |
| N93476 | Endothelial differentiation sphingolipid G-protein-coupled receptor 1 | 1pter-qter | −3.32 | ||
| AA486321 | Vimentin | X | 10p13 | −3.31 | |
| AI022299 | High-mobility group protein 17 | 1p36.1 | −3.24 | ||
| AA634006 | Aortic-type smooth muscle α-actin gene | X | 10q22-24 | −3.11 | |
| H63077 | Annexin I | X | 9q11-22 | −2.98 | |
| AA127217 | EST | 1 | −2.78 | ||
| H79839 | EST | U/K | −2.61 | ||
| T50282 | Tissue factor pathway inhibitor (LAC1) | X | 2q13-32.1 | −2.61 | |
| AA991578 | Vitelliform macular dystrophy (bestrophin) | 11q13 | −2.55 | ||
| AI44462 | EST | U/K | −2.54 | ||
| AI017394 | EST | 12 | −2.52 | ||
| AA862465 | α2-glycoprotein 1, zinc | X | 7q22.1 | −2.48 | |
| AA427954 | EST | 12 | −2.48 | ||
| AA111865 | EST | 8 | −2.39 | ||
| R93124 | Aldo-keto reductase family 1, member C1 | X | 10p15-14 | −2.38 | |
| AA913304 | Heat shock transcription factor 2 | 6 | −2.36 | ||
| AA878089 | EST | U/K | −2.35 | ||
| AA436384 | EST | 1 | −2.31 | ||
| AI089149 | KIAA0448 | 1 | −2.28 | ||
| AA922705 | Glycogen phosphorylase isotype BB | X | 20p11.2-11.1 | −2.27 | |
| AA010360 | EST | 4 | −2.25 | ||
| AA496007 | EST | 5 | −2.20 | ||
| R97503 | EST | 3 | −2.19 | ||
| H79022 | EST | U/K | −2.19 | ||
| AA989257 | Interleukin 4 | X | 12q13 | −2.18 | |
| T71284 | Complement 1q | 1p36.1 | −2.18 | ||
| AI347695 | Mitochondrial translational release factor 1 | 13q14.1-14.3 | −2.17 | ||
| AA456063 | EST | 12 | −2.16 | ||
| AA448261 | High-mobility group protein isoforms I & Y | X | 6p21 | −2.06 | |
| AA865147 | EST | 4 | −2.06 | ||
| AI357378 | Macrophage lectin 2 | U/K | −2.04 | ||
| R48312 | EST | 1 | −2.03 | ||
| R83355 | EST | 6 | −2.00 | ||
| AA459364 | EST | 8 | −2.00 | ||
| AA259151 | EST | U/K | −1.99 | ||
| AA634028 | SB class II histocompatibility antigen α-chain | 6p21.3 | −1.98 | ||
| AI000935 | EST | 11 | −1.98 | ||
| AA862717 | Cas-Br-M (murine) ectropic retroviral transforming sequence B | 3q | −1.97 | ||
| H15570 | EST | U/K | −1.96 | ||
| AA677200 | EST | 11 | −1.95 | ||
| AA97960 | EST | 20 | −1.91 | ||
| AA961361 | Transforming acidic coiled coil containing protein 1 (TACC1) | X | 8p11 | −1.90 | |
| H50623 | MHC class II HLA-DR7-β-chain | 6p21.3 | −1.88 | ||
| AA931758 | G0S2 protein | 1q32.2-41 | −1.87 | ||
| N34316 | EST | 17 | −1.84 | ||
| AI264651 | mRNA sequence from H.sapiens clone 24649 | 19 | −1.83 |
BC, breast cancer-associated gene; OC, other cancer-associated gene; U/K, unknown.
cDNA Microarray Analysis of Differential Gene Expression in Primary Breast Carcinomas
This analysis was performed as described for the cell lines. Pooled RNA from five HER2/neu-positive breast cancers was compared against pooled RNA from five HER2/neu-negative cancers. All carcinomas were of intermediate to high grade ductal type, ER-positive and node-positive. In triplicate analysis, on average 38 genes were up- and 257 genes were down-regulated in HER2/neu overexpressing breast cancers. Figure 2 ▶ illustrates a representative comparison. Almost half of the genes appeared in only one analysis and were not further considered. 151 genes were identified as differentially expressed in two or three analyses. The 19 up-regulated genes are listed in Table 3 ▶ . Only six of these genes have known functions, and two of these have been linked to human neoplasia (Max, stanniocalcin 2). There was no overlap with the list of genes up-regulated in HER2/neu-positive breast cancer cell lines. 132 genes were consistently down-regulated, and of these, 58 genes are unidentified (Table 4) ▶ . A number of the down-regulated genes (eg, TGF-β1, KAI1) are well described in breast cancer. Other genes such as latent TGF-β binding protein 1 (LTBP1) and melanoma antigen p15 were previously found to be involved in other human malignancies. Again, most of the named genes have no known function in human neoplasia. Only four genes (GPBB, TACC1, complement 1q, EST R83355) were found to be down-regulated both in HER2/neu-positive breast cancer cell lines and in HER2/neu-overexpressing breast cancers. Interestingly, six genes were down-regulated in the carcinomas but up-regulated in vitro (RAD 21, serine protease inhibitor Kunitz type 1, factor VIII gene L1 element insertion DNA, ribophorin II, EST AI000971, one chromosome 16 BAC clone).
Figure 2.
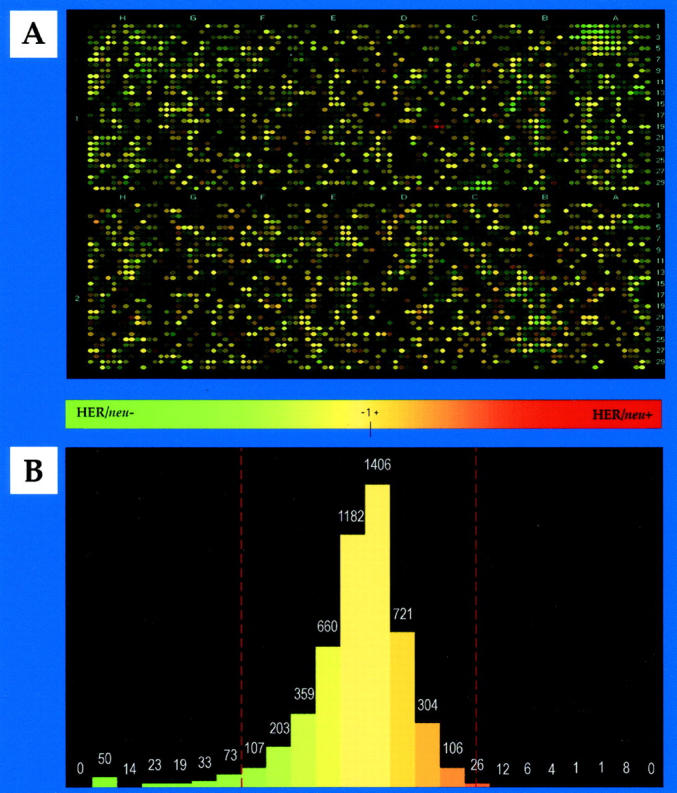
Representative comparison of gene expression profiles in pooled HER2/neu-negative and -positive breast cancers. A: Pathways generated green/red overlay. The green spots represent genes more highly expressed in pooled HER2/neu-negative breast cancers, the red spots represent genes more highly expressed in pooled HER2/neu-positive breast cancers, and the yellow spots indicate genes expressed at similar levels. B: Histogram derived from A. Cutoffs were determined by statistical analysis and are indicated by red lines. In this analysis, 40 genes (0.8%) were up-, and 219 genes (4.2%) were down-regulated in HER2/neu-overexpressing breast carcinomas.
Table 3.
Up-Regulated Genes in HER2/neu-Positive Breast Carcinomas (N = 19)
| Accession number | Gene | BC | OC | Chromosome location | Average expression ratio |
|---|---|---|---|---|---|
| AA598631 | EST | X | 4.45 | ||
| AA490477 | Smooth muscle myosin heavy chain isoform Smemb | 17 | 4.40 | ||
| R96579 | EST | U/K | 3.78 | ||
| AA026152 | Vesicle trafficking protein | 3 | 3.53 | ||
| AA677406 | EST | U/K | 3.47 | ||
| W72838 | EST | U/K | 3.22 | ||
| AA278402 | KIAA0465 | 1 | 2.67 | ||
| AA937783 | KIAA0461 | 1 | 2.66 | ||
| AA598572 | Spleen tyrosine kinase | 9q22 | 2.35 | ||
| AA903500 | EST | 20 | 2.19 | ||
| AA448660 | EST | 11 | 2.14 | ||
| AA113016 | EST | 11 | 2.11 | ||
| AA629688 | EST | U/K | 2.09 | ||
| T98503 | EST | 20 | 2.08 | ||
| N68443 | Max | X | 14q23 | 2.05 | |
| AA233901 | EST | 18 | 2.04 | ||
| AI376502 | Rab13 | 12q13 | 1.94 | ||
| AA676408 | Stanniocalcin 2 | X | 5 | 1.93 | |
| W31717 | EST | 10 | 1.92 |
BC, breast cancer-associated gene; OC, other cancer-associated gene; U/K, unknown.
Table 4.
Down-Regulated Genes in HER2/neu-Positive Breast Carcinomas (N = 132)
| Accession number | Gene | BC | OC | Chromosome location | Average expression ratio |
|---|---|---|---|---|---|
| AA644693 | Ariadne-2 (Drosophila) homolog | 3p21.2-21.3 | −34.83 | ||
| AA136125 | Spermine synthase | X | Xp22.1 | −25.05 | |
| AA22309 | KAI1 (CD82) | X | 11p11.2 | −14.53 | |
| AA975832 | EST | U/K | −12.35 | ||
| AA070226 | Selenoprotein P, plasma, 1 | X | 5q31 | −11.65 | |
| AA010400 | Ets variant gene 4 | X | 17q21 | −11.14 | |
| AA633569 | Ribosomal protein L26 | 17p | −9.57 | ||
| H26183 | CCAAT/enhancer binding protein (C/EBP), β | 20q13.1 | −8.49 | ||
| AA400476 | Mitotic centromere-associated kinesin (kinesin-like 6) | X | 1 | −7.78 | |
| AA279440 | Tafazzin | Xp28 | −5.67 | ||
| AA279941 | Zinc finger protein 42 | X | 19q13.2-13.4 | −5.55 | |
| N35050 | TNF, member 12 | 17p13.3 | −5.49 | ||
| N34048 | KIAA0691 | 19q13.4 | −5.40 | ||
| AA044390 | Uridine diphosphoglucose pyrophosphorylase | 2p14-13 | −5.07 | ||
| T90778 | EST | 19 | −4.93 | ||
| AA136710 | Lactoyl glutathione lyase (glycoxylase 1) | X | 6p21.3-21.2 | −4.74 | |
| R08932 | Golgi transport complex protein | 7q31 | −4.61 | ||
| AA968664 | Melanoma antigen p15 | X | 4 | −4.37 | |
| AA664101 | Aldehyde dehydrogenase 1 | X | 9p21 | −4.28 | |
| H39187 | EGF-like-domain, multiple 2 | 1p21 | −4.27 | ||
| W73790 | Immunoglobulin λ-like polypeptide 2 | 22q11.23 | −4.13 | ||
| AA129777 | Solute carrier family 16, member 3 | 22q12.3-13.2 | −4.10 | ||
| R59615 | EST | 18 | −4.10 | ||
| AA917766 | EST | 10 | −4.03 | ||
| AA056013 | Microfibril-associated glycoprotein-2 | 12p13.1-12.3 | −3.99 | ||
| AA454657 | Interleukin 11 receptor α | X | 9p13 | −3.97 | |
| AA878048 | Keratin 15 | 17q21.1 | −3.86 | ||
| H73586 | KIAA0262 | 12 | −3.65 | ||
| AA886199 | DEME-6 | X | U/K | −3.63 | |
| AA447770 | KIAA0409 | 11 | −3.57 | ||
| AA670422 | ADP-ribosylation factor 3 | 12q13 | −3.52 | ||
| AA465522 | EST | 11 | −3.49 | ||
| AA960842 | EST | 8 | −3.46 | ||
| H38650 | Solute carrier family 2, member 5 (GLUT5) | X | 1p36.2 | −3.40 | |
| R50337 | Solute carrier family 19, member 1 | X | 21q22.3 | −3.40 | |
| H24650 | Laminin-γ1 | X | 1q31 | −3.38 | |
| T86708 | Solute carrier family 4, member 1, anion exchanger | 17q21-22 | −3.38 | ||
| AA464856 | Inhibitor of DNA binding 4 | 6p22-21.3 | −3.25 | ||
| AA133584 | JM1 | Xp11.23 | −3.24 | ||
| AA418737 | EST | U/K | −3.21 | ||
| AA417806 | EST | U/K | −3.21 | ||
| AA885642 | H2B histone family, member B | 6p21.3 | −3.12 | ||
| AA683102 | RAD21 | 5 | −3.11 | ||
| R45254 | EST | 6 | −3.10 | ||
| AA464140 | ATP-dependent RNA helicase | 17q21.1 | −3.08 | ||
| H04202 | KIAA0635 | 4 | −3.07 | ||
| AA598621 | Signal recognition particle receptor (“docking protein”) | 11q23-24 | −3.03 | ||
| AA974805 | EST | 7 | −3.00 | ||
| AA487575 | Calcium & integrin binding protein | 15q25.3-26 | −2.99 | ||
| R36467 | TGF-β1 | X | 19p13.1 | −2.99 | |
| H74265 | Protein tyrosine phosphatase, receptor type, c | 1q31-32 | −2.99 | ||
| H51574 | Arachidonate 5-lipoxygenase | X | 10 | −2.95 | |
| W56266 | Cot oncogene | X | 10p11.2 | −2.93 | |
| H17551 | RNA (guanine-7-)-methyltransferase | 18p11.22-11.23 | −2.93 | ||
| AA989457 | EST | U/K | −2.87 | ||
| AA283023 | EST | 4 | −2.86 | ||
| AA426264 | Ki-67 | X | 10q25-ter | −2.81 | |
| AA455507 | KIAA0618 | 7 | −2.81 | ||
| AA150403 | EST | 3 | −2.81 | ||
| AA974801 | Capping protein (actin filament) muscle Z-line, α1 | 1 | −2.78 | ||
| AA417994 | EST | 16 | −2.78 | ||
| AA620527 | EST | 1 | −2.78 | ||
| AI338952 | EST | U/K | −2.76 | ||
| AA101617 | Fos-like antigen 2 | 2p23-22 | −2.75 | ||
| AI000138 | EST | U/K | −2.75 | ||
| AA418674 | Fibrillin 1 | 15q21.1 | −2.70 | ||
| AA453816 | Folate receptor 2 (fetal) | X | 11q13.3-13.5 | −2.68 | |
| AA487236 | EST | U/K | −2.67 | ||
| AA132874 | EST | 15 | −2.67 | ||
| AI337445 | Collagen I α1 | 17q21.31-22 | −2.64 | ||
| AA922705 | Glycogen phosphorylase isoform BB | X | 20p11.2-11.1 | −2.63 | |
| AA046713 | Ribosomal protein S3 | X | 11q13.3-13.5 | −2.63 | |
| AA488674 | Myeloid cell leukemia sequence 1 (Bcl-2 related) | X | 1q21 | −2.61 | |
| R73542 | EST | U/K | −2.60 | ||
| T98783 | Latent transforming growth factor β-binding protein 1 (LTBP1) | X | 2p12-q22 | −2.59 | |
| H53025 | Calumenin | 7q32 | −2.57 | ||
| AA975209 | Serine protease inhibitor, Kunitz type 1 | X | 15 | −2.57 | |
| AA504772 | S-adenosylmethionine decarboxylase 1 | X | 6q21-22 | −2.56 | |
| AA436384 | EST | 1 | −2.55 | ||
| AI000971 | KIAA0344 | 12 | −2.55 | ||
| AA872041 | EST | U/K | −2.54 | ||
| AA608548 | Template activating factor-1α | U/K | −2.52 | ||
| N50738 | EST | 12 | −2.52 | ||
| W72591 | EST | U/K | −2.52 | ||
| AI262140 | Activated p21 cdc42Hs kinase (ACK) | 3 | −2.51 | ||
| H81115 | BAC clone | 16 | −2.50 | ||
| AA915976 | EST | U/K | −2.50 | ||
| AA978328 | EST | 21 | −2.46 | ||
| H40880 | EST | 16 | −2.46 | ||
| R14855 | Structure specific recognition protein I | X | 11q12 | −2.45 | |
| AA905588 | Axin 1 | X | 16p13.3 | −2.45 | |
| AA857103 | EST | U/K | −2.45 | ||
| AI074017 | EST | U/K | −2.45 | ||
| H20676 | EST | 1 | −2.42 | ||
| R83355 | EST | 6 | −2.42 | ||
| AA521423 | EST | U/K | −2.40 | ||
| H11003 | Endothelin 1 | X | 6p24-23 | −2.39 | |
| AA479967 | EST | 3 | −2.39 | ||
| H80325 | EST | 14 | −2.39 | ||
| AA457223 | EST | 20 | −2.36 | ||
| R46218 | EST | U/K | −2.36 | ||
| W81139 | EST | U/K | −2.35 | ||
| AA877815 | KIAA0353 | 15 | −2.35 | ||
| W74337 | KIAA0684 | 1 | −2.34 | ||
| AA991889 | EST | U/K | −2.33 | ||
| AA018457 | Glutamate decarboxylase 1 (GAD1) | 2q31 | −2.31 | ||
| AA486533 | Early growth response I | X | 5q31.1 | −2.31 | |
| AA485893 | Ribonuclease, RNase A family, 1 (pancreatic) | 14 | −2.29 | ||
| AA995174 | EST | 12 | −2.29 | ||
| AA043552 | EST | 7 | −2.28 | ||
| W73810 | Epithelial membrane protein 3 | 19q13.3 | −2.27 | ||
| AA291163 | Glutaredoxin (thioltransferase) | X | 5q14 | −2.27 | |
| AA064668 | Rab8 | 19p13.2-cen | −2.22 | ||
| N48345 | EST | U/K | −2.22 | ||
| AI140997 | EST | U/K | −2.21 | ||
| AA282983 | EST | U/K | −2.21 | ||
| AA988959 | Max-interacting protein 1 | X | 10q25 | −2.21 | |
| AI090094 | Factor VIII gene L1 element insertion DNA | U/K | −2.20 | ||
| AA961361 | Transforming acidic coiled-coil containing protein 1 (TACC1) | X | 8p11 | −2.20 | |
| R54643 | EST | 3 | −2.20 | ||
| AA644679 | Dynein, cytoplasmic, light polypeptide | X | 14q24 | −2.19 | |
| AA158162 | EST | 11 | −2.16 | ||
| T71284 | Complement 1q | 1p36 | −2.16 | ||
| AA465180 | EST | 2 | −2.16 | ||
| AI369623 | Regulator of G-protein signalling 3 | 9q31-33 | −2.11 | ||
| AA479060 | EST | 6 | −2.11 | ||
| R23752 | Ribosomal protein S12 | 19q13.1 | −2.08 | ||
| AA449667 | Milk fat globule-EGF factor 8 protein | 15q25 | −2.08 | ||
| AA644191 | ADP-ribosylation factor-like 3 | 10q23.3 | −2.10 | ||
| AA121836 | EST | 15 | −2.10 | ||
| AA991856 | Ribophorin II | 20q12-13.1 | −2.01 | ||
| AA406603 | KIAA0761 | 1 | −1.94 |
BC, breast cancer-associated gene; OC, other cancer-associated gene; U/K, unknown.
Confirmatory Studies: Northern Analysis
The up-regulation of TFF3 expression in HER2/neu-positive breast cancer cell lines was confirmed by Northern analysis. In the pooled RNA samples used for microarray analysis, relatively abundant TFF3 mRNA was detected in the HER2/neu-positive but not in the HER2/neu-negative cell lines (Figure 3A) ▶ . TFF3 expression was then studied in the individual cell lines used in the microarray analysis. Two HER2/neu-negative cell lines failed to express TFF3. In contrast, positive bands were detected for HER2/neu-positive cell lines BT474 and MDA-MB-361 (Figure 3B) ▶ . Because insufficient RNA was available, TFF3 expression could not be studied in the ten breast carcinomas used in the gene expression profiling experiments. However, Northern analysis was performed on 15 breast cancers that were not controlled for histological type or grade, receptor or nodal status. In this random sample, TFF3 expression could be detected in both HER2/neu-positive (4/6) and -negative (4/9) specimens (Figure 3C) ▶ .
Figure 3.

Northern blot analysis of trefoil factor 3 (TFF3) expression in breast cancer cell lines and carcinomas. Northern blots of HER2/neu-negative (-) and -positive (+) breast cancer cell lines and carcinomas (20 μg total RNA per lane) were hybridized with TFF3 and GAPDH probes. A: Pooled RNA from three HER2/neu-negative and three -positive breast cancer cell lines. TFF3 is only expressed in the latter. B: TFF3 expression in five of the six breast cancer cell lines. TFF3 is expressed in two of the three HER2/neu-positive, but in neither of the two HER2/neu-negative lines. C: Representative TFF3 expression patterns in randomly selected HER2/neu-negative and HER2/neu-positive breast carcinomas.
Confirmatory Studies: Immunohistochemistry
IHC was used to further demonstrate the specificity of the cDNA microarray results and to confirm the differential expression of three additional genes that, like TFF3, were known to have important physiological functions and whose expression was previously found to be deregulated in human neoplasia. GPBB was one of only a few genes found to be down-regulated in HER2/neu-positive breast cancer cells both in vitro and in vivo. The differential expression could also be demonstrated at the protein level. The average immunoreactivity of the three HER2/neu-negative cell lines was more than twice than that of the three HER2/neu overexpressers (Figure 4, A and B) ▶ . Seven of the 10 cancers in the gene expression cohort could be stained for GPBB. The HER2/neu-negative carcinomas had average IHC scores that were about three times as high as those of the HER2/neu-positive tumors (Figure 4, C and D) ▶ . Immunocytochemistry for vimentin produced similar findings. The three HER2/neu-negative breast cancer cell lines stained 2.5 times more intensely than the three HER2/neu overexpressers (Figure 5, A and B) ▶ . To test whether this inverse correlation also existed in primary breast carcinomas, we stained 17 of the 25 ICRF tumors and 70 additional invasive ductal carcinomas from the pathology files of the Roswell Park Cancer Institute for vimentin. Of 87 tumors, 18 (21%) were positive, and these cases were exclusively confined to the ER-negative group (P < 0.0001, Table 5 ▶ ). Among the ER-negative carcinomas, almost all (17/18, 94%) of the vimentin-positive cases were confined to the HER2/neu-negative subgroup, and only one of 13 HER2/neu-positive cancers (8%) expressed this filament (P = 0.0019, Table 5 ▶ , Figure 5 C, D ▶ ). Lastly, among the down-regulated genes in HER2/neu-positive breast cancers, KAI1 had one of the highest expression ratios. IHC was performed on frozen sections from all ten tumors in the gene expression cohort. Extensive down-regulation of KAI1 expression was demonstrated both in the HER2/neu-positive and in the -negative carcinomas (Figure 6) ▶ .
Figure 4.
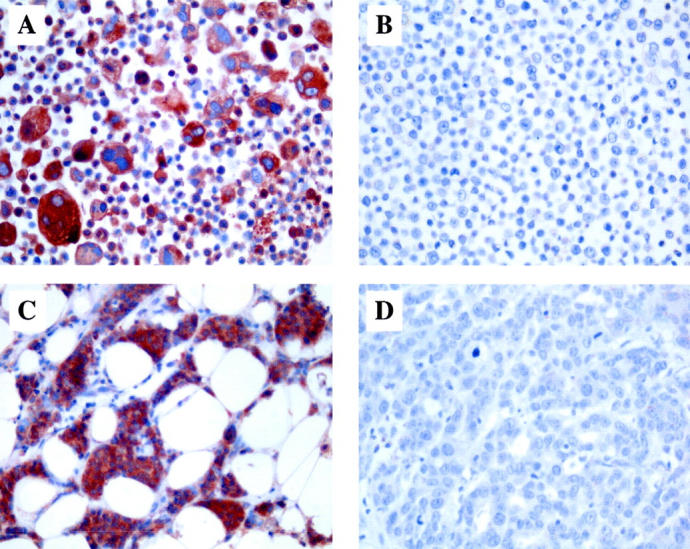
Glycogen phosphorylase BB (GPBB) expression in HER2/neu-negative and -positive breast cancer cell lines and carcinomas. Immunohistochemical stains of cell lines MDA-MB-435 (A) and MDA-MB-361 (B) as well as a HER2/neu-negative (C) and -positive (D) primary breast carcinoma. There is strong cytoplasmic reactivity in the HER2/neu-negative breast cancer cells (A, C) but almost no staining in the HER2/neu-positive specimens (B, D). Original magnifications, ×400.
Figure 5.

Vimentin expression in HER2/neu-negative and -positive breast cancer cell lines and carcinomas. Immunohistochemical stains of cell lines MDA-MB-468 (A) and SKBR3 (B) as well as a HER2/neu-negative (C) and -positive (D) primary breast carcinoma. There is strong cytoplasmic reactivity in the HER2/neu-negative breast cancer cells (A, C) but absence of reactivity in the HER2/neu-positive tumor cells (B, D). Original magnifications, ×400.
Table 5.
Vimentin Expression in Breast Carcinomas as a Function of ER and HER2/neu Status
| Vimentin | P* | |||
|---|---|---|---|---|
| Negative | Positive | |||
| All cancers (N = 87) | ||||
| Negative | 23 (26%) | 18 (21%) | ||
| ER | <0.0001 | |||
| Positive | 46 (53%) | 0 | ||
| ER-negative cancers (N = 41) | ||||
| Negative | 11 (27%) | 17 (41%) | ||
| HER2/neu | 0.0019 | |||
| Positive | 12 (29%) | 1 (2%) | ||
*Fisher’s exact test.
Figure 6.

KAI1 down-regulation in a breast carcinoma. Representative immunohistochemical stain of a frozen section of an invasive ductal carcinoma. There is complete absence of membrane staining in the neoplastic cells. Admixed endothelial and inflammatory cells act as positive internal controls. Original magnification, ×400.
Discussion
HER2/neu has become an important breast cancer biomarker because it predicts for a more aggressive clinical phenotype, and it also correlates with a tumor’s response to systemic therapy. 13-15 Although a number of genes and pathways have been identified that are downstream targets of HER2/neu, the biological basis of the increased virulence of breast cancers overexpressing this oncogene remains elusive. The principal objective of our study was to identify differentially expressed genes that may shed light on this question and that may serve as novel diagnostic, prognostic or therapeutic markers in the future.
With the recent development of cDNA microarray technology, it has become possible to study gene expression in cells and tissues of interest on a global scale. This technology has been used to arrive at a molecular classification of several tumor types including breast cancer. 9 We used it to answer a more specific question, ie, whether HER2/neu-negative and -positive breast cancer cells could be distinguished by their gene expression profiles. In an attempt to cancel out many of the random differences in gene expression that exist between individual breast cancer cell lines and tumors, respectively, and to specifically identify genes whose expression level may be linked to the HER2/neu status, we pooled RNA from p185erbB-2 overexpressing specimens and compared it to pooled RNA from HER2/neu-negative samples. An analysis of individual specimens may have revealed a large number of genes whose expression ratios are not related to HER2/neu activity. While pooling of RNAs produces an average of the expression ratios, this approach is more likely to identify genes that are linked to HER2/neu status across the pooled specimens. It is validated by our ability to identify a number of genes with a known role in mammary neoplasia and to verify the differential expression of certain genes by other methods and in an independent, expanded series of tumors. Whereas single cDNA microarray analyses may be subject to significant experimental variability, 16 the validity and reliability of our results were increased by our performing the hybridizations in duplicate and the comparisons in triplicate. We chose to use the GF225 microarray from Research Genetics, in part because it contains a large number of breast specific cDNAs. This would allow us to assess the effects of transformation on known and unknown genes involved in differentiation and proliferation. Our data complement an earlier report by Oh et al, 6 who studied the effect of HER2/neu overexpression on gene expression in breast and ovarian cancer cells by differential hybridization. In that analysis, only 19 of 16,000 cDNA clones were found to be differentially expressed. Recently, Kauraniemi et al 17 used a microarray containing 636 cDNA clones from chromosome 17 including 217 ESTs from 17q12 to identify a small number of genes that were co-amplified and co-overexpressed with HER2/neu in breast cancer. Most of these genes, including HER2/neu itself, were not represented on the GF225 array. The latter does contain cDNAs for GRB7 and MLN64, two genes that Kauraniemi et al 17 reported to be highly expressed in HER2/neu-positive BT474, SKBR3 and MDA-MB-361 cells. However, the level of expression of these genes in our three HER2/neu-negative breast cancer cell lines was not examined, and we did not find them to be significantly differentially expressed in our analysis.
A similar number of genes were found to be differentially expressed in HER2/neu overexpressing breast cancer cells in culture (N = 136 (2.6%)) and in HER2/neu-positive breast carcinomas (N = 151 (2.9%)) compared to the HER2/neu-negative specimens. However, one of the most significant findings in our study is the paucity of genes appearing in both cell lines and tumors. In vitro, twice as many genes were up- than down-regulated in HER2/neu overexpressing breast cancer cells (Figure 1) ▶ . In contrast, only 13% of the differentially expressed genes in HER2/neu-positive carcinomas were up-regulated compared to HER2/neu-negative cancers (Figure 2) ▶ . Only four genes were found to be down-regulated, and none were up-regulated in HER2/neu-positive specimens both in vitro and in vivo. In addition, a small number of genes were induced in HER2/neu-positive cell lines but repressed in the carcinomas.
The differences in the specific genes regulated in HER2/neu-positive cell lines and tumors, with so few in common, may be related to three major factors. The ten carcinomas subjected to microarray analysis were carefully controlled for histological type and grade, nodal status, and ER content, leaving HER2/neu status as the major discriminating variable. In contrast, the six cell lines selected for this study were derived from quite divergent tumors representing different stages of disease, and they showed variable aggressiveness in experimental systems. 18 Secondly, there is mounting evidence that the stroma plays a critical role in breast tumor formation, 19,20 and it is likely that the stromal compartment in HER2/neu-negative breast cancers has a gene expression profile that differs from that in tumors overexpressing the oncogene. Previous transcriptional profiling reports that included both cell lines and primary carcinomas also indicated significant differences in the gene expression patterns. 21,22 However, Perou et al 8 found good concordance of gene expression profiles in their cell lines and non-microdissected cancers. This may be due to the choice of genes on the arrays, which differ markedly in principle of selection. To evaluate the contribution to the breast carcinoma gene expression pattern of the stroma versus the malignant epithelium, separate cDNA microarray analyses of microdissected tumor tissues may need to be carried out. It will also be of interest to analyze breast cancer cell lines co-cultivated with stromal cells or in three-dimensional growth models. Indeed, the comparison of gene expression profiles between two- and three-dimensional growth would be important for understanding the relationship of gene expression in vitro and in vivo. Finally, it has been recognized that long-term growth in vitro creates significant changes in the genotype and phenotype of the cultured cells, and it is possible that the gene expression profile of an established cell line is significantly different from that of its parental cells in vivo. The role of transforming genes in switching off normal expression patterns has been poorly studied, but our results suggest that this may be a major effect of HER2/neu in vivo and may therefore have a role in producing aberrant patterns of tissue architecture and more aggressive clinical characteristics. This phenomenon may have been shown in our study because we used an array for normal breast, in contrast to oncogene enriched or selected arrays.
One of the few genes that were down-regulated in HER2/neu-positive breast cancer cells both in vitro and in vivo was GPBB. We were able to confirm the differential expression of this enzyme by immunohistochemistry (Figure 4) ▶ . Previous reports indicated up-regulation of GPBB in a high proportion of certain types of human tumors including gastric and colorectal carcinomas. 23,24 The physiological role of this enzyme in malignant tissues is poorly understood, but it has been suggested that elevated levels of GPBB may provide emergency glucose supply under anoxic conditions. 25 Our study newly implicates GPBB in breast tumorigenesis, but its mechanism of action and biological relevance remain to be demonstrated. In contrast to gastrointestinal mucosa, normal breast epithelium contains high levels of this enzyme (not shown). It is conceivable that down-regulation of GPBB is partly responsible for the higher prevalence of necrosis seen in HER2/neu-positive in situ and invasive breast cancers, possibly due to reduced glucose levels in the neoplastic cells. This marker is prototypic of a significant number of genes that we found to be down- or up-regulated in HER2/neu-positive breast cancer specimens and that had previously been reported to be involved in the development of other tumor types. This group of 26 genes also included α1-catenin, CDW52, interferon receptor 1, tissue factor pathway inhibitor, and melanoma antigen p15. Thus, cDNA microarray analysis of breast cancer cell lines and tissues can identify genes whose importance may not be confined to other tumor types.
Supporting the sensitivity of the microarray approach, our analyses revealed 32 genes that had previously been implicated in breast cancer development. These included well characterized genes such as HSP70, metallothionein 1E, glycoxylase and TGF-β1, as well as more recently described genes such as annexin 1, mitotic centromere-associated kinesin and DEME-6, whose pathobiological significance in mammary tumorigenesis needs to be further defined. One of these genes, TFF3 (intestinal trefoil factor, human secretory protein 1.B), was overexpressed in HER2/neu-positive breast cancer cells in vitro, and we confirmed this finding by Northern analysis (Figure 3A) ▶ . TFF3 was not expressed in HER2/neu-negative cell lines, but was expressed at high levels in two of three HER2/neu-positive lines (Figure 3B) ▶ . TFF3 was not found to be up-regulated in HER2/neu-positive breast carcinomas by microarray analysis. Indeed, Northern analysis of randomly selected tumors revealed a range of mRNA levels both in the HER2/neu-positive and in the –negative samples (Figure 3C) ▶ . This finding suggests that in vivo, TFF3 expression may depend not only on the HER2/neu status of the neoplastic cells but also on stromal factors. The protein is structurally related to pS2 (TFF1), and it has been best studied in the gastrointestinal tract. 12 It was also shown to be expressed by breast cancer cell lines and tumors, and the expression level was reported to be higher in ER+ cells. 26,27 Our data support the finding by May et al that TFF3 was not detectable in SKBR3 and MDA-MB-231 cells. 26 Elevated levels of TFF3 in HER2/neu-positive breast cancer specimens may induce a more aggressive phenotype by several mechanisms. Trefoil factors in general have been found to be motogenic, and it has been suggested that TFF3 levels may affect the metastatic potential of tumor cells. 12 The motogenic effect of TFF3 may be mediated by interaction of this molecule with E-cadherin, β-catenin, and associated proteins. 28 Moreover, in colorectal carcinomas, TFF3 expression may confer resistance to chemotherapy. 29 Whether this effect is also present in breast carcinomas, is unknown.
As discussed above, down-regulation of GPBB and up-regulation of TFF3 can be linked, at least in theory, to the more virulent clinical behavior of HER2/neu-positive breast cancers. Our microarray analysis revealed several other genes whose differential expression may be related to this phenotype. Tables 1 to 4 ▶ ▶ ▶ include a surprisingly small number of bona fide oncogenes and tumor suppressor genes, and this may partly reflect under-representation of these genes on the GF225 cDNA microarray. One of the few suppressors that was on the list of down-regulated genes in HER2/neu-positive breast cancers was KAI1 (CD82). This gene suppresses the invasive and metastatic properties of several tumor types such as prostate cancer and melanoma. 30,31 We previously demonstrated KAI1 down-regulation in lymphomas and squamous and colon carcinomas. 32,33 Moreover, this gene was down-regulated in a subset of breast carcinomas, 34 and transfection of the gene into breast cancer cells suppressed invasion and metastasis. 35 We confirmed the down-regulation of KAI1 in five HER2/neu-positive breast cancers by frozen section immunohistochemistry (Figure 6) ▶ . However, there was equally dramatic reduction in KAI1 expression in the five HER2/neu-negative carcinomas despite higher mRNA levels, suggesting some degree of dissociation of KAI1 mRNA and protein levels. Significantly, the microarray identified KAI1 as one important gene whose expression is deregulated in breast cancer.
p185erbB-2 overexpression in breast cancer was associated with differences in the gene expression pattern of several structural and functional pathways. These included elements of the extracellular matrix and tumor basement membrane (laminin-γ1, microfibril-associated glycoprotein 2, fibrillin 1, collagen I α1), components of the TGF-β pathway (TGF-β1, LTBP1, HNF3), stress related genes (glutathione S-transferase, HSP70, annexin I, high mobility group protein isoforms I and Y, complement 1q, stanniocalcin 2), and components of the cytoskeleton (keratins 7, 15 and 18, myosin light and heavy chains, smooth muscle actin, vimentin). In the latter three pathways, some components were up-, while others were down-regulated. In contrast, all four stromal matrix/basement membrane proteins were down-regulated, suggesting that in HER2/neu-positive tumors, the stroma may be less resistant to invasion by the neoplastic cells.
We confirmed the elevated expression of vimentin in HER2/neu-negative breast cancer cell lines by immunocytochemistry (Figure 5, A and B) ▶ . Our results are in agreement with a report by Dandachi et al 36 indicating absence of vimentin expression in SKBR3(A) and MDA-MB-361 cells and positive reactivity in the MDA-MB-231 cell line. To test whether the inverse association between vimentin expression and HER2/neu status also existed in vivo, we studied 87 invasive ductal carcinomas with previously determined ER and HER2/neu status. Aberrant vimentin expression could be demonstrated in 18 of 41 (44%) ER-negative, but in none of 46 ER-positive carcinomas, consistent with many previous reports of the inverse correlation between vimentin expression and ER status. 36-38 Significantly, all six cell lines used in our analyses were reported to be ER-negative. 18 The overall vimentin positivity rate (18/87, 21%) is similar to previously reported frequencies. 36,37 Our observation that, in ER-negative cancers, vimentin expression is almost completely limited to tumors with low p185c-erbB-2 levels, is a novel finding. We are aware of only one other study that included vimentin and HER2/neu in the same group of breast cancers. Dandachi et al 36 found no correlation between these two markers in their whole cohort of carcinomas, however, the tumors were not stratified by ER status. Previous reports linked vimentin positivity to more aggressive tumor characteristics including high grade and elevated proliferative activity, as well as to high levels of epidermal growth factor receptor (EGFR), another member of the erbB gene family. 37-39 Whether vimentin positivity adversely affects survival, is controversial. 37,38 In an experimental system, inappropriate expression of vimentin in MCF-7 cells led to increased motility, invasiveness, clonogenic potential, tumorigenicity and proliferation. 40 Thus, aberrant expression of vimentin in the neoplastic cells, with or without concomitant EGFR overexpression, may be an alternate mechanism of conferring aggressive biological characteristics on ER-negative breast cancers that do not overexpress HER2/neu. The vimentin gene is located at a chromosomal site (10p) that is amplified in a subset of breast cancers. 41 Why aberrant expression of vimentin preferentially occurs in ER- and HER2/neu-negative breast cancers, and whether this phenomenon is indeed due to gene amplification, remains to be elucidated.
In summary, our study has revealed a significant number of genes representing multiple biochemical pathways whose level of expression in breast cancer cell lines and tissues is affected by the HER2/neu status. cDNA microarray analysis is a useful screening technique for identifying novel genes not previously implicated in mammary tumorigenesis. These include genes described in other types of tumors and an even larger number of genes (N = 100) which have no previous known role in human neoplasia. Our experiments have unveiled 129 uncharacterized genes (ESTs/KIAAs), some of which showed very high expression ratios and may be important determinants of the biological and clinical behavior of HER2/neu-positive breast cancers. Some of these unknown genes that are down- or up-regulated in p185erbB-2 overexpressing cells reside at chromosomal loci commonly deleted or amplified in human breast cancer and thus may prove to be important tumor suppressor or oncogenes, respectively. Our data also demonstrate that the gene expression profiles of breast carcinoma cells in vitro and in vivo were not congruent, implying a major role for the mammary stroma.
Acknowledgments
We thank Dr. Karin Oien from the Beatson Institute in Glasgow, Scotland for providing the TFF3 probe, Dr. Donald Lombardi at the University of Texas Southwestern Medical Center in Dallas for helpful discussions on the biological function of KAI1, Dr. Andrew Graham for help in preparing the tables and figures, and Linda Summerville for typing the manuscript.
Footnotes
Address reprint requests to Dr. Joseph Geradts, Department of Pathology and Laboratory Medicine, Roswell Park Cancer Institute, Elm & Carlton Streets, Buffalo, NY 14263. E-mail: joseph.geradts@roswellpark.org.
Supported by a grant from the Oxfordshire Health Services Research Trust and by the Imperial Cancer Research Fund, and partially supported by shared resources of the Roswell Park Cancer Center Support Grant P30 CA16056.
References
- 1.Pietras RJ, Arboleda J, Reese DM, Wongvipat N, Pegram MD, Ramos L, Gorman CM, Parker MG, Sliwkowski MX, Slamon DJ: HER-2 tyrosine kinase pathway targets estrogen receptor and promotes hormone-independent growth in human breast cancer cells. Oncogene 1995, 10:2435-2446 [PubMed] [Google Scholar]
- 2.Paik S, Hazan R, Fisher ER, Sass RE, Fisher B, Redmond C, Schlessinger J, Lippman ME, King CR: Pathologic findings from the national surgical adjuvant breast and bowel project: prognostic significance of erbB-2 protein overexpression in primary breast cancer. J Clin Oncol 1990, 8:103-112 [DOI] [PubMed] [Google Scholar]
- 3.Alaoui-Jamali MA, Paterson J, Al Moustafa A-E, Yen L: The role of ErbB-2 tyrosine kinase receptor in cellular intrinsic chemoresistance: mechanisms and implications. Biochem Cell Biol 1997, 75:315-325 [PubMed] [Google Scholar]
- 4.D’souza B, Taylor-Papadimitriou J: Overexpression of ERBB2 in human mammary epithelial cells signals inhibition of transcription of the E-cadherin gene. Proc Natl Acad Sci USA 1994, 91:7202-7206 [DOI] [PMC free article] [PubMed] [Google Scholar]
- 5.Giunciuglio D, Culty M, Fassina G, Masiello L, Melchiori A, Paglialunga G, Arand G, Ciardiello F, Basolo F, Thompson EW: Invasive phenotype of MCF10A cells overexpressing c-Ha-ras and c-erbB-2 oncogenes. Int J Cancer 1995, 63:815-822 [DOI] [PubMed] [Google Scholar]
- 6.Oh JJ, Grosshans DR, Wong SG, Slamon DJ: Identification of differentially expressed genes associated with HER-2/neu overexpression in human breast cancer cells. Nucleic Acids Res 1999, 27:4008-4017 [DOI] [PMC free article] [PubMed] [Google Scholar]
- 7.Duggan DJ, Bittner M, Chen Y, Meltzer P, Trent JM: Expression profiling using cDNA microarrays. Nat Genet 1999, 21:10-14 [DOI] [PubMed] [Google Scholar]
- 8.Perou CM, Jeffrey SS, van de Rijn M, Rees CA, Eisen MB, Ross DT, Pergamenschikov A, Williams CF, Zhu SX, Lee JCF, Lashkari D, Shalon D, Browns PO, Botstein D: Distinctive gene expression patterns in human mammary epithelial cells and breast cancers. Proc Natl Acad Sci USA 1999, 96:9212-9217 [DOI] [PMC free article] [PubMed] [Google Scholar]
- 9.Perou CM, Sølie T, Elsen MB, van de Rijn M, Jeffrey SS, Rees CA, Pollack JR, Ross DT, Johnsen H, Akslen LA, Fluge Ø, Pergamenschikov A, Williams C, Zhus SX, Lønning PE, Børresen-Dale A-L, Brown PO, Botstein D: Molecular portraits of human breast tumours. Nature 2000, 406:747-752 [DOI] [PubMed] [Google Scholar]
- 10.Nacht M, Ferguson AT, Zhang W, Petroziello JM, Cook BP, Gao YH, Maguire S, Riley D, Coppola G, Landes GM, Madden SL, Sukumar S: Combining serial analysis of gene expression and array technologies to identify genes differentially expressed in breast cancer. Cancer Res 1999, 59:5464-5470 [PubMed] [Google Scholar]
- 11.Sgroi DC, Teng S, Robinson G, LeVangie R, Hudson JR, Jr, Elkahloun AG: In vivo gene expression profile analysis of human breast cancer progression. Cancer Res 1999, 59:5656-5661 [PubMed] [Google Scholar]
- 12.May FEB, Westley BR: Trefoil proteins: their role in normal and malignant cells. J Pathol 1997, 183:4-7 [DOI] [PubMed] [Google Scholar]
- 13.Gusterson BA, Gelber RD, Goldhirsch A, Price KN, Säve-Söderborgh J, Anbazhagan R, Styles J, Rudenstam C-M, Golouh R, Reed R, Martinez-Tello F, Tiltman A, Torhorst J, Grigolato P, Bettelheim R, Neville AM, Bürki K, Castiglione M, Collins J, Lindtner J, Senn H-J: Prognostic importance of c-erbB-2 expression in breast cancer. J Clin Oncol 1992, 10:1049-1056 [DOI] [PubMed] [Google Scholar]
- 14.Houston SJ, Plunkett TA, Barnes DM, Smith P, Rubens RD, Miles DW: Overexpression of c-erbB2 is an independent marker of resistance to endocrine therapy in advanced breast cancer. Br J Cancer 1999, 79:1220-1226 [DOI] [PMC free article] [PubMed] [Google Scholar]
- 15.Paik S, Park C: HER-2 and choice of adjuvant chemotherapy in breast cancer. Semin Oncol 2001, 28:332-335 [DOI] [PubMed] [Google Scholar]
- 16.Lee M-LT, Kuo FC, Whitmore GA, Sklar J: Importance of replication in microarray gene expression studies: statistical methods and evidence from repetitive cDNA hybridizations. Proc Natl Acad Sci USA 2000, 97:9834-9839 [DOI] [PMC free article] [PubMed] [Google Scholar]
- 17.Kauraniemi P, Barlund M, Monni O, Kallioniemi A: New amplified and highly expressed genes discovered in the ERBB2 amplicon in breast cancer by cDNA microarrays. Cancer Res 2001, 61:8235-8240 [PubMed] [Google Scholar]
- 18.Clarke R, Leonessa F, Brünner N, Thompson E: In vitro models of breast cancer. Harris J Hellman S Lippman M Morrow M eds. Diseases of the Breast. 1995:pp 245-261 JB Lippincott, Philadelphia
- 19.Moinfar F, Man YG, Arnould L, Bratthauer GL, Ratschek M, Tavassoli FA: Concurrent and independent genetic alterations in the stromal and epithelial cells of mammary carcinoma: implications for tumorigenesis. Cancer Res 2000, 60:2562-2566 [PubMed] [Google Scholar]
- 20.Shekhar MP, Werdell J, Santner SJ, Pauley RJ, Tait L: Breast stroma plays a dominant regulatory role in breast epithelial growth and differentiation: implications for tumor development and progression. Cancer Res 2001, 61:1320-1326 [PubMed] [Google Scholar]
- 21.Alon U, Barkai N, Notterman DA, Gish K, Ybarra S, Mack D, Levine AJ: Broad patterns of gene expression revealed by clustering analysis of tumor and normal colon tissues probed by oligonucleotide arrays. Proc Natl Acad Sci USA 1999, 96:6745-6750 [DOI] [PMC free article] [PubMed] [Google Scholar]
- 22.Ross DT, Scherf U, Eisen MB, Perou CM, Rees C, Spellman P, Iyer V, Jeffrey SS, Van de Rijn M, Waltham M, Pergamenschikov A, Lee JC, Lashkari D, Shalon D, Myers TG, Weinstein JN, Botstein D, Brown PO: Systematic variation in gene expression patterns in human cancer cell lines. Nat Genet 2000, 24:227-235 [DOI] [PubMed] [Google Scholar]
- 23.Matsuzaki H, Shimada S, Uno K, Tsuruta J, Ogawa M: Novel subtyping of intestinal metaplasia in the human stomach. Am J Clin Pathol 1998, 109:181-189 [DOI] [PubMed] [Google Scholar]
- 24.Shimada S, Tashima S, Yamaguchi K, Matsuzaki H, Ogawa M: Carcinogenesis of intestinal-type gastric cancer and colorectal cancer is commonly accompanied by expression of brain (fetal)-type glycogen phosphorylase. J Exp Clin Cancer Res 1999, 18:111-118 [PubMed] [Google Scholar]
- 25.Uno K, Shimada S, Tsuruta J, Matsuzaki H, Tashima S, Ogawa M: Nuclear localization of brain-type glycogen phosphorylase in some gastrointestinal carcinoma. Histochem J 1998, 30:553-559 [DOI] [PubMed] [Google Scholar]
- 26.May FEB, Westley BR: Expression of human intestinal trefoil factor in malignant cells and its regulation by oestrogen in breast cancer cells. J Pathol 1997, 182:404-413 [DOI] [PubMed] [Google Scholar]
- 27.Theisinger B, Seitz G, Dooley S, Welter C: A second trefoil protein, ITF/hP1 B, is transcribed in human breast cancer. Breast Cancer Res Treat 1996, 38:145-151 [DOI] [PubMed] [Google Scholar]
- 28.Efstathiou JA, Noda M, Rowan A, Dixon C, Chinery R, Jawhari A, Hattori T, Wright NA, Bodmer WF, Pignatelli M: Intestinal trefoil factor controls the expression of the adenomatous polyposis coli-catenin and the E-cadherin-catenin complexes in human colon carcinoma cells. Proc Natl Acad Sci USA 1998, 95:3122-3127 [DOI] [PMC free article] [PubMed] [Google Scholar]
- 29.Taupin DR, Kinoshita K, Podolsky DK: Intestinal trefoil factor confers colonic epithelial resistance to apoptosis. Proc Natl Acad Sci USA 2000, 97:799-804 [DOI] [PMC free article] [PubMed] [Google Scholar]
- 30.Takaoka A, Hinoda Y, Sato S, Itoh F, Adachi M, Hareyama M, Imai K: Reduced invasive and metastatic potentials of KAI1-transfected melanoma cells. Jpn J Cancer Res 1998, 89:397-404 [DOI] [PMC free article] [PubMed] [Google Scholar]
- 31.Kawana Y, Komiya A, Ueda T, Nihei N, Kuramochi H, Suzuki H, Yatani R, Imai T, Dong J-T, Imai T, Yoshie O, Barrett JC, Isaacs JT, Shimazaki J, Ito H, Ichikawa T: Location of KAI1 on the short arm of human chromosome 11 and frequency of allelic loss in advanced human prostate cancer. Prostate 1997, 32:205-213 [DOI] [PubMed] [Google Scholar]
- 32.Geradts J, Maynard R, Birrer M, Hendricks D, Abbondanzo SL, Fong KM, Barrett JC, Lombardi DP: Frequent loss of KAI1 expression in squamous and lymphoid neoplasms: an immunohistochemical study of archival tissues. Am J Pathol 1999, 154:1665-1671 [DOI] [PMC free article] [PubMed] [Google Scholar]
- 33.Lombardi DP, Geradts J, Foley JF, Chiao C, Lamb PW, Barrett JC: Loss of KAI1 expression in the progression of colorectal cancer. Cancer Res 1999, 59:5724-5731 [PubMed] [Google Scholar]
- 34.Yang X, Wei L, Tang C, Slack R, Montgomery E, Lippman M: KAI1 protein is down-regulated during the progression of human breast cancer. Clin Cancer Res 2000, 6:3424-3429 [PubMed] [Google Scholar]
- 35.Yang X, Wei LL, Tang C, Slack R, Mueller S, Lippman ME: Overexpression of KAI1 suppresses in vitro invasiveness and in vivo metastasis in breast cancer cells. Cancer Res 2001, 61:5284-5288 [PubMed] [Google Scholar]
- 36.Dandachi N, Hauser-Kronberger C, More E, Wiesener B, Hacker GW, Dietze O, Wirl G: Co-expression of tenascin-C and vimentin in human breast cancer cells indicates phenotypic transdifferentiation during tumour progression: correlation with histopathological parameters, hormone receptors, and oncoproteins. J Pathol 2001, 193:181-189 [DOI] [PubMed] [Google Scholar]
- 37.Domagala W, Lasota J, Bartkowiak J, Weber K, Osborn M: Vimentin is preferentially expressed in human breast carcinomas with low estrogen receptor and high Ki-67 growth fraction. Am J Pathol 1990, 136:219-227 [PMC free article] [PubMed] [Google Scholar]
- 38.Seshadri R, Raymond WA, Leong AS, Horsfall DJ, McCaul K: Vimentin expression is not associated with poor prognosis in breast cancer. Int J Cancer 1996, 67:353-356 [DOI] [PubMed] [Google Scholar]
- 39.Thomas PA, Kirschmann DA, Cerhan JR, Folberg R, Seftor EA, Sellers TA, Hendrix MJ: Association between keratin and vimentin expression, malignant phenotype, and survival in postmenopausal breast cancer patients. Clin Cancer Res 1999, 5:2698-2703 [PubMed] [Google Scholar]
- 40.Hendrix MJ, Seftor EA, Seftor RE, Trevor KT: Experimental co-expression of vimentin and keratin intermediate filaments in human breast cancer cells results in phenotypic interconversion and increased invasive behavior. Am J Pathol 1997, 150:483-495 [PMC free article] [PubMed] [Google Scholar]
- 41.Richard F, Pacyna-Gengelbach M, Schluns K, Fleige B, Winzer KJ, Szymas J, Dietel M, Petersen I, Schwendel A: Patterns of chromosomal imbalances in invasive breast cancer. Int J Cancer 2000, 89:305-310 [PubMed] [Google Scholar]