

Abstract
Context
The relationship between obesity and osteoporosis has been widely studied, and epidemiological evidence shows that obesity is correlated with increased bone mass. Previous analyses, however, did not control for the mechanical loading effects of total body weight on bone mass and may have generated a confounded or even biased relationship between obesity and osteoporosis.
Objective
To re-evaluate the relationship between obesity and osteoporosis by accounting for the mechanical loading effects of total body weight on bone mass.
Methods
We measured whole body fat mass, lean mass, percentage fat mass (PFM), body mass index (BMI), and bone mass in two large samples of different ethnicity: 1,988 unrelated Chinese subjects and 4,489 Caucasian subjects from 512 pedigrees. We first evaluated the Pearson correlations among different phenotypes. We then dissected the phenotypic correlations into genetic and environmental components, with bone mass unadjusted, or adjusted, for body weight. This allowed us to compare the results with and without controlling for mechanical loading effects of body weight on bone mass.
Results
In both Chinese and Caucasians, when the mechanical loading effect of body weight on bone mass was adjusted for, the phenotypic correlation (including its genetic and environmental components) between fat mass (or PFM) and bone mass was negative. Further multivariate analyses in subjects stratified by body weight confirmed the inverse relationship between bone mass and fat mass, after mechanical loading effects due to total body weight was controlled.
Conclusions
Increasing fat mass may not have a beneficial effect on bone mass.
Introduction
Obesity and osteoporosis are two common complex diseases. Both have multifactorial etiologies including genetic and environmental components, with potential interactions between them. Obesity is a condition of excessive body fat that causes or exacerbates several public health problems. Body mass index (BMI) is widely used as an index of the degree of obesity, primarily because it is easy to measure, but it cannot be used to distinguish body fat from lean mass. Consequently, more refined phenotypes have been proposed for studying obesity, such as fat mass, lean mass, and percentage fat mass. Osteoporosis is a skeletal disease characterized by a reduction in bone mass; it is typically defined in an individual with a bone mineral density (BMD) T-score that is 2.5 or more standard deviations (SD) below normal (T-score ≤ −2.5) (1).
Extensive epidemiological data show that high body weight or BMI is correlated with high bone mass, and that reductions in body weight may cause bone loss (2–4). The basic mechanisms underlying this observed obesity: bone mass correlation remain unclear, though several explanations have been proposed. It is generally accepted that a larger body mass imposes a greater mechanical loading on bone, and that bone mass increases to accommodate the greater load. Further, adipocytes are important sources of estrogen production in postmenopausal women, and estrogen is known to inhibit bone resorption by osteoclasts. It has been proposed that increases in adipose tissue, with increasing BMI in postmenopausal women, results in increased estrogen production, osteoclast suppression, and a resultant increase in bone mass (5). Finally, obesity has been associated with insulin resistance, characterized by high plasma levels of insulin. High plasma insulin levels may contribute to a variety of abnormalities, including androgen and estrogen overproduction in the ovary, and reduced production of sex hormone-binding globulin by the liver. These changes may result in elevated sex hormone levels, leading to increased bone mass due to reduced osteoclast activity and possibly increased osteoblast activity (6).
Epidemiologic correlation between obesity and bone mass may be explained, in part, by the mechanisms presented above, but further analysis reveals a much more complex relationship (7). For example, leptin, an adipocyte-secreted peptide that regulates appetite and energy expenditures, is found to have complex effects on bone. A recent study reported that leptin-deficient and leptin receptor-deficient mice had increased bone formation, and that intra-cerebroventricular infusion of leptin causes bone loss in leptin-deficient and wild-type mice (8). Based on these observations, it was proposed that leptin may inhibit bone formation (8). In contrast to these findings, however, systemic administration of leptin to leptin-deficient mice, and wild-type mice results in increased bone growth, increased skeletal mass, and increased skeletal strength (6).
Earlier epidemiologic studies investigating the relationship between obesity and osteoporosis centered on phenotypic correlations between body weight (or BMI) and bone mass, and produced the generally accepted view that increased mechanical loading, associated with increased body weight, contributes to increases in bone mass (9). One potential problem with these phenoytpic studies is that the correlation between body weight (or BMI) and bone mass may not necessarily represent a correlation between obesity per se and osteoporosis, as it is excessive fat mass, rather than total body weight, that defines obesity. Body weight is a heterogeneous phenotype consisting of fat, lean muscle, and bone mass. Fat mass accounts for ~16% and ~25% of total body weight in normal weight men and women, respectively; the majority of the remaining body composition is lean mass (10). Although several previous studies (6) have used fat mass to assess the correlation between obesity and bone mass, they generally did not adjust for the mechanical loading effects of body weight on bone mass. Thus, conclusions from these studies about the relationship between obesity and bone mass may be confounded by the mechanical loading effects of total body weight on the skeletal system. Therefore, a critical question arises: what is the correlation between obesity per se and osteoporosis? To fully investigate the relationship between obesity and bone mass, it is necessary to control for the mechanical loading effects of total body weight in the analyses.
In the present study, using both Chinese and Caucasian populations, we found that body fat mass is negatively correlated with bone mass when the mechanical loading effect of body weight is statistically removed. Our results have important clinical implications, as they suggest that interventions or treatments reducing obesity may increase bone mass, and thus protect against osteoporosis.
Research design and methods
Subjects
The study population consisted of two samples. The first sample was composed of 1,988 healthy unrelated Chinese (Han) subjects [(878 premenopausal women and 1,110 men, aged 27.2 ± 4.5 (mean ± SD), range 19.6–45.1 years)], who were recruited in P. R. China. The second sample came from USA, which consisted of 512 pedigrees with 4,489 Caucasian subjects [(2,667 females and 1,822 males, aged 47.8 ± 16.2 years (mean ± SD), ranging 19.1–90.1)]. All the subjects signed informed-consent documents before entering the studies. We adopted an exclusion criterion elaborated elsewhere (11). In brief, subjects with diseases, treatments, or conditions that would be apparent, non-genetic, causes for abnormal bone mass or fat mass were excluded.
Measurement
BMD (g/cm2) at the lumbar spine (LS) and femoral neck (FN), total body bone mineral content (TB BMC), fat mass and lean mass (both in kg) were measured by Hologic DXA scanners (Hologic Corp., Waltham, MA). Percentage fat mass (PFM) is the ratio of fat mass divided by total body weight (i.e., the sum of fat mass, lean mass, and bone mass). For the LS BMD, the quantitative phenotype used here was combined BMD of L1–L4. Weight was measured in light indoor clothing, using a calibrated balance beam scale, and height was measured using a calibrated stadiometer. BMI (kg/m2) was calculated as weight (kg) divided by height square (m2).
In this study, all the subjects completed a nurse-administered risk factor questionnaire to assess information concerning smoking, physical activity, and menopausal status, etc. The ages of starting and stopping smoking and the average packs of cigarettes smoked per day were recorded. Study subjects were classified as smokers and non-smokers (defined as those who never smoked or had stopped smoking for at least 5 years), with smokers numerically coded as 1 and non-smokers as 0. For physical activity, the number of episodes of exercise per week was recorded. The regular exercisers were defined as those who exercised at least once per week and were coded as 1; non-exercisers were coded as 0 in the data analyses. Menopause status was coded as 0 and 1 for premenopause and postmenopause, respectively, and was coded as missing for males.
Statistical Analyses
For the Caucasian sample, we first identified 1,085 unrelated subjects [(aged 62.13 ± 10.84 (mean ± SD)] from the 512 Caucasian pedigrees by selecting the founders and married-in subjects. Many factors, such as age, sex, height, menopause status, exercise, and smoking may have significant effects on both obesity-related phenotypes and bone mass. Their significances were tested and those significant factors modeled as covariates in regression models. The selection of covariates was based on whether the variable was statistically significant at the significance level of p< 0.05. Because of the mechanical loading effect of body weight on bone mass, the true relationship between bone mass and fat mass may be confounded. To address this issue, in our regression model, we incorporated total body weight as a covariate to adjust for bone mass. By adopting this model, the mechanical loading effect of body weight on bone mass is eliminated, and the relationship between bone mass and fat mass investigated here is not confounded. In genetic analyses, adjustment for significant covariates can generally increase the genetic signal-to-noise ratio by decreasing the proportion of the residual phenotypic variation attributable to random environmental factors. In our analyses, BMD and obesity-related phenotypes were adjusted for significant covariates such as age, sex, height, menopause status, exercise, and smoking in regression models. The adjusted values were used for subsequent Pearson correlation analysis and the residuals from the model were used in the data analyses. These analyses were conducted separately in Chinese samples and unrelated Caucasian samples selected from our Caucasian pedigrees.
We further dissected phenotypic correlations into genetic and environmental components by performing quantitative genetic variance decomposition analyses in the whole Caucasian sample (4,489 subjects) using the program SOLAR (available on http://www.sfbr.org/solar/). The bivariate quantitative genetic analysis is a powerful method to directly assess shared genetic and environmental effects by measuring the degree of genetic and environmental correlations between pairs of traits. It re-estimated and decomposed the total phenotypic correlation ρP into the components due to genetic correlations (ρG ) and environmental correlations (ρE ) (12) that are shared among bone mass, lean mass, and fat mass. The signs of ρG and ρE indicate the directions of action of shared genetic and environmental effects on osteoporosis and obesity. To estimate the genetic correlations ρG and environmental correlations ρE for pairs of traits, one should first model the bivariate phenotype of an individual as a linear function of the individual s trait measurements. Then the matrix of kinship coefficients is generated, expressing relationships among all pairs of individuals in the pedigree. From standard quantitative genetic theories, the phenotypic variance–covariance matrix and its genetic and environmental components are then obtained. From these matrices, ρG and ρE are estimated directly, which was detailed elsewhere (13). We tested the significance of both ρG and ρE between any pair of traits by comparing the likelihood for the restricted model, in which each of these parameters was constrained to zero, to the likelihood for the general model, in which all parameters were estimated. In this study, the significant level refers to p≤0.05 in a statistical test. In the statistical analyses, outliers that were 4 SD away from the respective averages were excluded. Natural log transformation was performed for variables that did not follow the normal distribution.
We further investigated the relationship between PFM and BMC in subgroups of 10-kg strata of body weight for the total 4,489 Caucasian subjects. A linear mixed model was used with age, height, smoking, exercise, and menopause status modeled as covariates. Family relationships were modeled in the mixed model as random effects. Least-squares mean of the TB BMC stratified by PFM in subgroups of 10-kg strata of body weight in the whole Caucasian sample was plotted. In this study, only strata with 100 persons were included for each gender to achieve maximum statistical power.
Results
Table 1 shows the basic characteristics of the study population, which was stratified into four subgroups by race and gender. The Caucasian sample has a higher average age than the Chinese sample. Weight, height, BMI, fat mass, PFM, lean mass, FN BMD and total body BMC differed significantly between groups (p < 0.001). In both Caucasian and Chinese samples, when compared to women, men had significantly higher height, weight, BMI, lean mass, LS BMD, FN BMD, and TB BMC, and lower fat mass and PFM. For the same gender, Chinese had significantly lower BMI, fat mass, PFM, LS BMD, and TB BMC than the gender-matched Caucasians. This race difference remained even after adjustment for age.
Table 1.
Descriptive Characteristics by Sex and Race (Mean ± SD) in the unrelated sample
| Caucasian | Chinese | Comparison* | |||
|---|---|---|---|---|---|
| Women (1) (n =547 ) | Men (2) (n = 538) | Women (3) (n = 878) | Men (4) (n = 1110) | ||
| Age (year) | 62.04 ± 11.37 | 62.25 ± 10.41 | 27.26 ± 4.83 | 27.16 ± 4.18 | 3,4 < 1,2 |
| Body weight (kg) | 73.64 ± 15.51 | 91.01± 15.01 | 50.74 ± 6.20 | 62.58 ± 8.58 | 3 < 4 < 1 < 2 |
| Height (m) | 1.62 ± 0.07 | 1.77 ± 0.07 | 1.58 ± 0.05 | 1.69 ± 0.05 | 3 < 1 < 4 < 2 |
| BMI (kg/m2) | 28.05± 5.64 | 29.02 ± 4.24 | 20.26 ± 2.28 | 21.81 ± 2.73 | 3 < 4 < 1 < 2 |
| Fat mass (kg) | 28.90 ± 9.72 | 24.92 ± 7.74 | 13.79 ± 3.6 | 10.52 ± 4.77 | 4 < 3 < 2 < 1 |
| Percentage fat mass (%) | 0.38 ± 0.06 | 0.27 ± 0.05 | 0.26 ± 0.05 | 0.16 ± 0.05 | 4 < 3 < 2 < 1 |
| Lean mass (kg) | 43.31 ± 6.49 | 63.06 ± 8.35 | 36.59± 3.61 | 51.27± 5.22 | 1 < 3 < 4 < 2 |
| Spine BMD (g/cm2) | 0.98 ± 0.16 | 1.08 ± 0.17 | 0.94 ± 0.10 | 0.98 ± 0.11 | 3 < 1,4 < 2 |
| Femoral neck BMD (g/cm2) | 0.74 ± 0.12 | 0.82 ± 0.14 | 0.78 ± 0.09 | 0.88 ± 0.12 | 1 < 3 < 2 < 4 |
| Total body BMC (kg) | 2.09 ± 0.36 | 2.78 ± 0.43 | 1.87 ± 0.23 | 2.27 ± 0.29 | 3 < 1 < 4 < 2 |
p < 0.001
Table 2 shows the covariates included in our model and the standardized regression coefficients and their significance. Only the significant variables were retained in the model. The adjusted, dependent variables were used for further Pearson correlation analyses.
Table 2.
The independent contribution of each confounding variable to bone mass or obesity-related phenotypes by multivariate linear regression analysis
| Chinese: | ||||||
| Standardized regression coefficient | ||||||
| Age (year) | Sex | Height (m) | Exercise | Smoking | ||
| Fat mass (kg) | 0.242*** | 0.491*** | 0.195*** | 0.028 | 0.028 | |
| Lean mass (kg) | 0.088*** | −0.517*** | 0.455*** | 0 | −0.007 | |
| Percentage fat mass (%) | 0.160*** | 0.677*** | −0.034*** | 0.018 | 0.029 | |
| Lumbar spine BMD (g/cm2) | 0.053* | 0.071* | 0.320*** | 0.019 | −0.050* | |
| Femoral neck BMD (g/cm2) | −0.073 | −0.230*** | 0.254*** | 0.024 | −0.029 | |
| Total body BMC (kg) | 0.014 | −0.087** | 0.430*** | 0.030* | −0.011 | |
| Caucasians: | ||||||
| Standardized regression coefficient | ||||||
| Age (year) | Sex | Height (m) | Exercise | Smoking | Menopause status | |
| Fat mass (kg) | 0.062 | 0.460*** | 0.285*** | −0.219*** | 0.004 | −0.027 |
| Lean mass (kg) | −0.086*** | −0.460*** | 0.446*** | −0.067** | −0.013 | −0.004 |
| Percentage fat mass (%) | 0.124*** | 0.691*** | −0.005 | −0.147*** | 0.006 | 0.007 |
| Lumbar spine BMD (g/cm2) | −0.01 | 0.164*** | 0.206*** | 0.041* | 0.055* | −0.325*** |
| Femoral neck BMD (g/cm2) | −0.290*** | 0.026 | 0.251*** | 0.026 | 0.04 | −0.147* |
| Total body BMC (kg) | −0.118*** | −0.164** | 0.511*** | 0.046* | 0.022 | −0.137** |
Note: p < 0.05,
p < 0.01,
p < 0.001
Table 3 summarizes the results of the phenotypic correlation between bone mass and obesity-related phenotypes in unrelated samples of Chinese and Caucasians, respectively. The correlation results were similar for Chinese and Caucasians. In both Chinese and Caucasians, BMI and weight were positively correlated with bone mass. The results reported here are consistent with the long held belief that subjects having larger body weight tend to have higher bone mass. When bone mass was adjusted for body weight, lean mass was consistently positively correlated with weight-adjusted bone mass (p<0.05), suggesting that the effects of lean mass on bone mass are not simply due to its weight. Most interestingly, fat mass and PFM were found to be inversely associated with weight-adjusted bone mass (p<0.01)(Table 3, results presented in brackets), suggesting that higher fat mass (or PFM) does not increase bone mass when the mechanical loading effects of overall body weight are statistically controlled.
Table 3.
The phenotypic correlation between obesity-related phenotypes and bone mass in 1,988 unrelated Chinese and 1,085 unrelated Caucasians, with bone mass unadjusted vs. adjusted for weight (in brackets)
| Chinese | |||
| Lumbar Spine BMD (g/cm2) | Femoral neck BMD (g/cm2) | Total Body BMC (kg) | |
| Fat mass (kg) | 0.09** (−0.12**) | 0.13** (−0.12**) | 0.16** (−0.23**) |
| Lean mass (kg) | 0.35**(0.15**) | 0.38**(0.16**) | 0.61**(0.29**) |
| Percentage fat mass (%) | 0.02 (−0.16**) | 0.05* (−0.15**) | 0.02 (−0.30**) |
| BMI (kg/m2) | 0.25** | 0.29** | 0.43** |
| Weight (Kg) | 0.32** | 0.34** | 0.57** |
| Caucasians | |||
| Lumbar Spine BMD (g/cm2) | Femoral neck BMD (g/cm2) | Total Body BMC (kg) | |
| Fat mass (kg) | 0.13**(−0.12**) | 0.24**(−0.13**) | 0.04(−0.48**) |
| Lean mass (kg) | 0.40**(0.10*) | 0.52**(0.09*) | 0.80**(0.36**) |
| Percentage fat mass (%) | −0.14**(−0.17**) | −0.12**(−0.18**) | −0.46**(−0.65**) |
| BMI (kg/m2) | 0.24** | 0.36** | 0.25** |
| Weight (Kg) | 0.36** | 0.51** | 0.63** |
Note: p<0.05,
p<0.01.
The values in brackets were the standardized regression coefficients when bone mass was adjusted for body weight
The results of genetic and environmental correlations between obesity-related phenotypes and weight-adjusted bone mass are summarized in Table 4. When bone mass was adjusted for body weight, both genetic (ρG ) and environmental (ρE ) correlations between lean mass and weight-adjusted bone mass were significantly positive (p<0.01). In contrast to these findings, fat mass and PFM were negatively associated with weight-adjusted bone mass, both genetically and environmentally (p<0.01). This is consistent with the results of our Pearson correlation (phenotypic correlation) analyses presented in Table 3. Our results contrast with those of previous studies suggesting that higher fat mass (i.e., higher obesity risk) contributes to an increase in bone mass. These results indicate that, under the same conditions of mechanical loading, a higher fat mass tends to decrease bone mass.
Table 4.
The genetic and environmental correlations between obesity-related phenotypes and weight-adjusted bone mass inferred from the whole sample in Caucasians
| Lumbar spine BMD (g/cm2) | Femoral neck BMD (g/cm2) | Total body BMC (kg) | ||
|---|---|---|---|---|
| Fat mass (kg) | ρG | −0.16** | −0.23** | −0.51** |
| ρE | −0.17** | −0.28** | −0.65** | |
| Lean mass (kg) | ρG | 0.33** | 0.28** | 0.70** |
| ρE | 0.21** | 0.16** | 0.56** | |
| Percentage fat mass (%) | ρG | −0.23** | −0.32** | −0.56** |
| ρE | −0.20** | −0.30** | −0.58** |
Note: p<0.01.
ρG (Genetic correlation) is the correlation due to genes shared by bone mass and obesity. ρE (Environmental correlation) is the correlation due to shared environmental factors. We calculated ρP (Phenotypic correlation) between two traits by formula using h2, ρG, and ρE .
p values were estimated by comparison with the likelihood of a nested model in which either ρG or ρE was fixed at zero (for ρG and ρE , respectively), or both were fixed at zero (for ρP ).
We further investigated the relationship of fat mass to bone mass in subjects matched by body weight. We divided the Caucasian sample into 10-kg strata of body weight. Five strata for female (50–99 kg) and four strata for male (70–109 kg) were identified, with each stratum having more than 100 subjects. For each stratum, the samples are equally divided into three subgroups according to their PFM. Figure 1 plots the least-squares means and SEs of TB BMC for the low, medium and high PFM subgroups from each of the different weight strata. Significant negative associations (p< 0.001) between PFM and TB BMC were found in all weight-strata, for both male and females.
Fig 1.
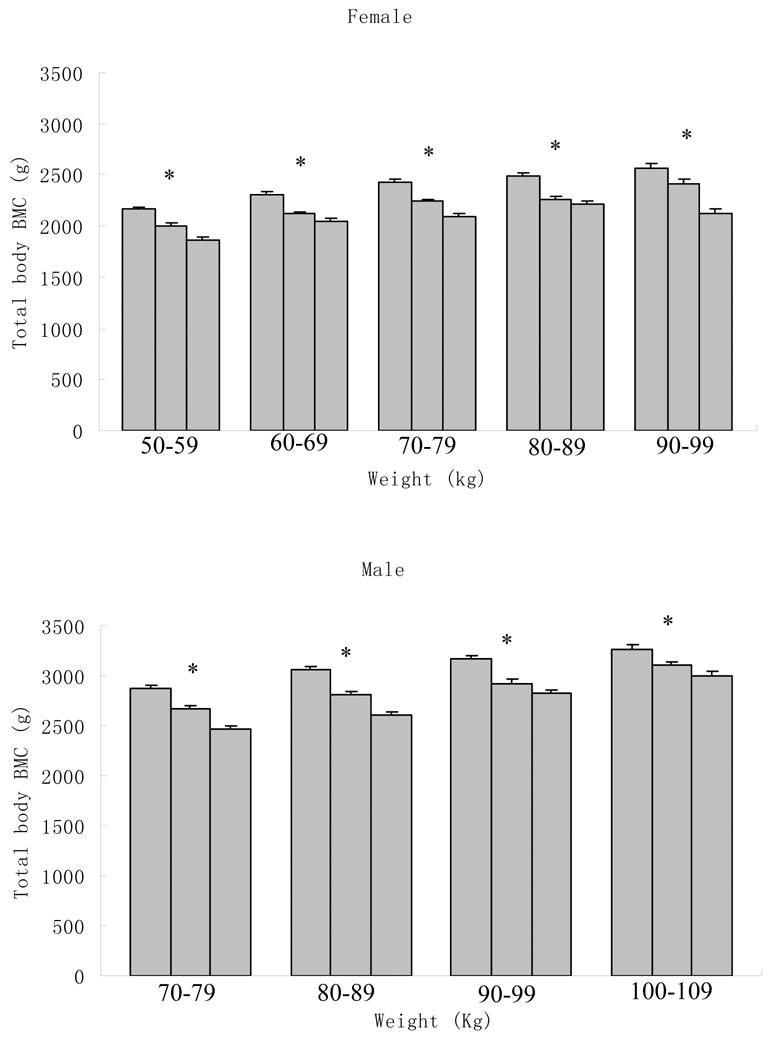
Least-squares mean (±SE) of the total body BMC stratified by percentage fat mass in 10-kg strata of body weight in 4,489 Caucasians. Each bar in each body weight stratum represents a third of the population with the lowest, middle and highest (from left to right) percentage fat mass. A linear mixed model was used with age, height, exercise, and menopause status as covariates. Familial relationships were treated as random effects in the model. * P < 0.0001.
Discussion
The key finding of this study is that fat mass (or PFM) is inversely correlated with bone mass genetically, environmentally, and phenotypically, when the mechanical loading effects of body weight on bone mass are controlled. These results suggest that: 1) body fat mass per se does not have protective effects on bone mass, and; 2) shared genetic and environmental factors may have beneficial effects on both obesity (by reducing body fat mass) and osteoporosis. We also found positive correlations between lean mass and bone mass regardless of adjustments for body weight, suggesting that the effects of lean mass on bone mass are not entirely attributable to the mechanical loading aspect of body weight. A straightforward explanation for this latter finding is that larger lean mass is related to larger muscles, which typically convey larger or more frequent mechanical loading to the skeleton. Our results thus support the well-known beneficial effects of mechanical loading on bone, but challenges current thinking that fat mass protects against osteoporosis. Indeed, some earlier studies have shown that excess adipose tissue may not protect against fracture (14–17). In a study of a large cohort of Chinese by Hsu et al. (16), given a certain body weight, a negative relationship between fat mass and bone mass was found, and the risks of osteoporosis, osteopenia, and nonspine fractures were significantly higher for subjects with higher percentage body fat, independent of body weight.
The negative genetic correlation ρG between fat mass and weight-adjusted bone mass suggests that fat and bone mass share some common genetic factors and molecular pathways, that appear to have opposite effects on fat vs. bone mass. This finding is consistent with our current understanding of the differentiation of adipose tissue and the skeleton. Adipocytes and osteoblasts originate from a common progenitor, pluripotential mesenchymal stromal cells, and their differentiation is regulated through the PPAR-γ (peroxisome proliferators activated receptor-gamma) pathway (18). Activation of PPAR-γ drives the differentiation of mesenchymal stromal cells towards adipocytes over osteoblasts (19). A set of factors common to osteogenesis and adipogenesis determine the mesenchymal stromal cells’ entry into different functional stages (20). For example, bone morphogenetic protein (BMP) and retinoic acid (RA) may cooperate to induce osteoblast differentiation of preadipocytes (21). Molecular genetic studies have also identified some candidate genes that have common effects on osteoporosis and obesity. Such genes include IGF-I, IGF-II, LEPR, NPY, VDR, ER-α, AR, TGF-β1, IL-6, TNF-α, TNFR2, ApoE, and PPAR-γ. For instance, the Pro10 allele in the TGF-β1 gene was found to reduce risk of both obesity (22) and osteoporosis (23).
Our current study also found a negative environmental correlation (ρE ) between fat mass and weight-adjusted bone mass. This implies that fat and bone mass share some environmental factors which may alleviate the risk of both obesity and osteoporosis. Several lines of evidence support our observations here. For instance, physical exercise may prevent body fat accumulation while increasing bone mass (24). Milk and tea are believed to be beneficial for the prevention of both osteoporosis and obesity (25). Milk is a good source of highly absorbable calcium, and increased milk intake may increase peak bone mass in puberty, slow bone loss, and reduce the incidence of osteoporotic fracture in the elderly (26). Studies also show that high calcium intake may promote weight or fat loss (27), although long-term trials are needed to confirm such observations.
Our results may have important clinical implications. First, a person may gain bone mass without having to gain fat mass. Second, medical interventions or lifestyle modifications may be favorable for both osteoporosis and obesity. Indeed, a few studies have suggested such effects. For instance, menopause is associated with increased bone loss, increased fat mass, and decreased lean mass. Hormone replacement therapy (HRT) has been proven to be efficient in attenuating bone loss in postmenopausal women (28) and reversing menopause-related obesity and loss of lean mass (29). Leptin, a key factor regulating appetite and body weight, has been shown to influence bone mass (30). Treatment of children with congenital leptin deficiency with recombinant leptin leads to increased bone mass (31) and a sustained reduction in weight, predominantly as a result of a loss of fat (30, 31). Ducy et al. (8) and Takeda et al. (32), however, reported that leptin may decrease bone formation via the sympathetic nervous system, indicating that the effect of leptin on bone mass is complex (33). Other medical interventions have also been shown to have adverse effects on health, leading to both osteoporosis and obesity. For example, osteoporosis and obesity are the two main side effects of treatment with GnRH agonists, agents that are used for treating nonmetastatic prostate cancer (34).
We acknowledge that our study is cross-sectional in nature instead of a longitudinal design. Therefore, in this study, the relationship between bone mass and obesity-related phenotypes is descriptive and might be confounded by cohort effects. However, the age range of our Chinese sample is narrow, which may suggest that cohort effects, if any, may be relatively small. Future longitudinal studies will be helpful in clarifying the relationship regarding changes of bone mass and fat mass.
It should also be noted that the statistically significant correlations reported here only imply an overall effect of the shared factors in determination of fat and bone mass. Some individual factors may not follow this correlation. For example, smoking is associated with low bone mass and accelerated bone loss (35), but it may also reduce BMI (36).
An additional concern with this study is that the observed negative correlation between fat mass and weight-adjusted bone mass might be an artifact caused by dual energy x-ray absorptiometry (DXA) measurement. It is likely that heterogeneous distributions of soft tissues could lead to systematic inaccuracies inherent to DXA-derived BMD measurements. Changes of fat distribution can cause alterations in bone measurement without any real change in the skeleton (37, 38). However, in this study, our results are not likely to be biased for the following reasons:
A previous analytic and quantitative simulation study indicated that decreasing fat mass by weight change always artificially led to lower BMD, and vice versa (39), which is qualitatively different from our results.
Prior studies (37, 38) showed that increasing fat thickness may spuriously decrease total body BMD. The spurious decrease in BMD, if due to DXA measurement, is attributable to the potential spurious increases in both BMC (numerator) and bone area (denominator for BMD) (37, 38). Bone area may have a relatively larger spurious increase than BMC, resulting in a potential spurious decrease of BMD (37, 38). However, in this study, we found a negative, rather than a positive, correlation between fat mass and weight-adjusted TB BMC, which indicates that increasing fat mass is associated with a smaller BMC. This result suggests that our finding is unlikely to be explained by an artifact of the DXA measurement, which leads to larger BMC with increasing fat. Moreover, we tested the relationship between fat mass and bone area in our two large samples. We found that fat mass was negatively correlated with weight-adjusted bone area (Appendix Table 1). This finding is qualitatively different from the positive correlation between spurious change of bone area and change of fat thickness due to DXA measurements as suggested in some earlier studies (38). This result further ensured the robustness of our results against the potential artificial effects of DXA measurement.
In summary, we found a negative correlation between fat mass (or PFM) and bone mass, both genetically and environmentally. In addition, we reaffirmed the beneficial effects of appropriate weight bearing and mechanical loading on a healthy skeletal system.
Acknowledgments
The investigators were partially supported by grants from NIH. The study also benefited from the Ministry of Education of P. R. China, Huo Ying Dong Education Foundation, Hunan Normal University, and 211 project funding through Xi’an Jiaotong University. We would like to thank Dr. Christopher J. Papasian for his constructive input during preparation of this manuscript.
Appendix Table 1.
Pearson correlations between fat mass and weight-adjusted bone area in 1,988 unrelated Chinese and 1,085 unrelated Caucasians.
| lumbar spine bone area | femoral neck bone area | total body bone area | ||
|---|---|---|---|---|
| Fat mass (kg) | Chinese | −0.25** | −0.16** | −0.22** |
| Caucasians | −0.17** | −0.12** | −0.15** |
Note: p<0.01.
Footnotes
This work was partially supported by grants from the NIH (K01 AR02170-01, R01 AR050496-01, and R01 GM60402-01A1). The study also benefited from the Ministry of Education of P. R. China, Huo Ying Dong Education Foundation, Hunan Normal University, and 211 project funding through Xi’an Jiaotong University.
References
- 1.Kanis JA, Melton LJ, III, Christiansen C, Johnston CC, Khaltaev N. The diagnosis of osteoporosis. J Bone Miner Res. 1994;9:1137–1141. doi: 10.1002/jbmr.5650090802. [DOI] [PubMed] [Google Scholar]
- 2.Guney E, Kisakol G, Ozgen G, Yilmaz C, Yilmaz R, Kabalak T. Effect of weight loss on bone metabolism: comparison of vertical banded gastroplasty and medical intervention. Obes Surg. 2003;13:383–388. doi: 10.1381/096089203765887705. [DOI] [PubMed] [Google Scholar]
- 3.Radak TL. Caloric restriction and calcium’s effect on bone metabolism and body composition in overweight and obese premenopausal women. Nutr Rev. 2004;62:468–481. doi: 10.1111/j.1753-4887.2004.tb00019.x. [DOI] [PubMed] [Google Scholar]
- 4.Wardlaw GM. Putting body weight and osteoporosis into perspective. Am J Clin Nutr. 1996;63:433S–436S. doi: 10.1093/ajcn/63.3.433. [DOI] [PubMed] [Google Scholar]
- 5.Kameda T, Mano H, Yuasa T, Mori Y, Miyazawa K, Shiokawa M, Nakamaru Y, Hiroi E, Hiura K, Kameda A, Yang NN, Hakeda Y, Kumegawa M. Estrogen inhibits bone resorption by directly inducing apoptosis of the bone-resorbing osteoclasts. J Exp Med. 1997;186:489–495. doi: 10.1084/jem.186.4.489. [DOI] [PMC free article] [PubMed] [Google Scholar]
- 6.Reid IR. Relationships among body mass, its components, and bone. Bone. 2002;31:547–555. doi: 10.1016/s8756-3282(02)00864-5. [DOI] [PubMed] [Google Scholar]
- 7.Rosen CJMB. Mechanisms of Disease: is osteoporosis the obesity of bone? Nat Clin Pract Rheumatol. 2006;2:35–43. doi: 10.1038/ncprheum0070. [DOI] [PubMed] [Google Scholar]
- 8.Ducy P, Amling M, Takeda S, Priemel M, Schilling AF, Beil FT, Shen J, Vinson C, Rueger JM, Karsenty G. Leptin inhibits bone formation through a hypothalamic relay: a central control of bone mass. Cell. 2000;100:197–207. doi: 10.1016/s0092-8674(00)81558-5. [DOI] [PubMed] [Google Scholar]
- 9.Skerry TM, Suva LJ. Investigation of the regulation of bone mass by mechanical loading: from quantitative cytochemistry to gene array. Cell Biochem Funct. 2003;21:223–229. doi: 10.1002/cbf.1077. [DOI] [PubMed] [Google Scholar]
- 10.Abernathy RP, Black DR. Healthy body weights: an alternative perspective. Am J Clin Nutr. 1996;63:448S–451S. doi: 10.1093/ajcn/63.3.448. [DOI] [PubMed] [Google Scholar]
- 11.Deng HW, Shen H, Xu FH, Deng HY, Conway T, Zhang HT, Recker RR. Tests of linkage and/or association of genes for vitamin D receptor, osteocalcin, and parathyroid hormone with bone mineral density. J Bone MinerRes. 2002;17:678–686. doi: 10.1359/jbmr.2002.17.4.678. [DOI] [PubMed] [Google Scholar]
- 12.Lynch M, Walsh B. Genetics and analysis of quantitative traits. 1. Sunderland, MA: Sinauer associatiates, Inc; 1998. [Google Scholar]
- 13.Williams JT, Van Eerdewegh P, Almasy L, Blangero J. Joint multipoint linkage analysis of multivariate qualitative and quantitative traits. I. Likelihood formulation and simulation results. Am J Hum Genet. 1999;65:1134–1147. doi: 10.1086/302570. [DOI] [PMC free article] [PubMed] [Google Scholar]
- 14.De Laet C, Kanis JA, Oden A, Johanson H, Johnell O, Delmas P, Eisman JA, Kroger H, Fujiwara S, Garnero P, McCloskey EV, Mellstrom D, Melton LJ, III, Meunier PJ, Pols HA, Reeve J, Silman A, Tenenhouse A. Body mass index as a predictor of fracture risk: A meta-analysis. Osteoporos Int. 2005;16:1330–1338. doi: 10.1007/s00198-005-1863-y. [DOI] [PubMed] [Google Scholar]
- 15.Goulding A, Jones IE, Taylor RW, Williams SM, Manning PJ. Bone mineral density and body composition in boys with distal forearm fractures: a dual-energy x-ray absorptiometry study. J Pediatr. 2001;139:509–515. doi: 10.1067/mpd.2001.116297. [DOI] [PubMed] [Google Scholar]
- 16.Hsu YH, Venners SA, Terwedow HA, Feng Y, Niu T, Li Z, Laird N, Brain JD, Cummings SR, Bouxsein ML, Rosen CJ, Xu X. Relation of body composition, fat mass, and serum lipids to osteoporotic fractures and bone mineral density in Chinese men and women. Am J Clin Nutr. 2006;83:146–154. doi: 10.1093/ajcn/83.1.146. [DOI] [PubMed] [Google Scholar]
- 17.Blum M, Harris SS, Must A, Naumova EN, Phillips SM, Rand WM, Dawson-Hughes B. Leptin, body composition and bone mineral density in premenopausal women. Calcif Tissue Int. 2003;73:27–32. doi: 10.1007/s00223-002-1019-4. [DOI] [PubMed] [Google Scholar]
- 18.Akune T, Ohba S, Kamekura S, Yamaguchi M, Chung UI, Kubota N, Terauchi Y, Harada Y, Azuma Y, Nakamura K, Kadowaki T, Kawaguchi H. PPARgamma insufficiency enhances osteogenesis through osteoblast formation from bone marrow progenitors. J Clin Invest. 2004;113:846–855. doi: 10.1172/JCI19900. [DOI] [PMC free article] [PubMed] [Google Scholar]
- 19.Pei L, Tontonoz P. Fat’s loss is bone’s gain. J Clin Invest. 2004;113:805–806. doi: 10.1172/JCI21311. [DOI] [PMC free article] [PubMed] [Google Scholar]
- 20.Gordeladze JO, Reseland JE, Drevon CA. Pharmacological interference with transcriptional control of osteoblasts: a possible role for leptin and fatty acids in maintaining bone strength and body lean mass. Curr Pharm Des. 2001;7:275–290. doi: 10.2174/1381612013398167. [DOI] [PubMed] [Google Scholar]
- 21.Skillington J, Choy L, Derynck R. Bone morphogenetic protein and retinoic acid signaling cooperate to induce osteoblast differentiation of preadipocytes. J Cell Biol. 2002;159:135–146. doi: 10.1083/jcb.200204060. [DOI] [PMC free article] [PubMed] [Google Scholar]
- 22.Rosmond R, Chagnon M, Bouchard C, Bjorntorp P. Increased abdominal obesity, insulin and glucose levels in nondiabetic subjects with a T29C polymorphism of the transforming growth factor-beta1 gene. Horm Res. 2003;59:191–194. doi: 10.1159/000069323. [DOI] [PubMed] [Google Scholar]
- 23.Yamada Y, Harada A, Hosoi T, Miyauchi A, Ikeda K, Ohta H, Shiraki M. Association of transforming growth factor beta1 genotype with therapeutic response to active vitamin D for postmenopausal osteoporosis. J Bone Miner Res. 2000;15:415–420. doi: 10.1359/jbmr.2000.15.3.415. [DOI] [PubMed] [Google Scholar]
- 24.Reid IR, Legge M, Stapleton JP, Evans MC, Grey AB. Regular exercise dissociates fat mass and bone density in premenopausal women. J Clin Endocrinol Metab. 1995;80:1764–1768. doi: 10.1210/jcem.80.6.7775619. [DOI] [PubMed] [Google Scholar]
- 25.St Onge MP. Dietary fats, teas, dairy, and nuts: potential functional foods for weight control? Am J Clin Nutr. 2005;81:7–15. doi: 10.1093/ajcn/81.1.7. [DOI] [PubMed] [Google Scholar]
- 26.Reid IR. Therapy of osteoporosis: calcium, vitamin D, and exercise. Am J Med Sci. 1996;312:278–286. doi: 10.1097/00000441-199612000-00006. [DOI] [PubMed] [Google Scholar]
- 27.Zemel MB. Role of calcium and dairy products in energy partitioning and weight management. Am J Clin Nutr. 2004;79:907S–912S. doi: 10.1093/ajcn/79.5.907S. [DOI] [PubMed] [Google Scholar]
- 28.Manson JE, Martin KA. Postmenopausal hormone-replacement therapy. N Engl J Med. 2001;345:34–40. doi: 10.1056/NEJM200107053450106. [DOI] [PubMed] [Google Scholar]
- 29.Sorensen MB, Rosenfalck AM, Hojgaard L, Ottesen B. Obesity and sarcopenia after menopause are reversed by sex hormone replacement therapy. Obes Res. 2001;9:622–626. doi: 10.1038/oby.2001.81. [DOI] [PubMed] [Google Scholar]
- 30.Farooqi IS, Matarese G, Lord GM, Keogh JM, Lawrence E, Agwu C, Sanna V, Jebb SA, Perna F, Fontana S, Lechler RI, DePaoli AM, O’Rahilly S. Beneficial effects of leptin on obesity, T cell hyporesponsiveness, and neuroendocrine/metabolic dysfunction of human congenital leptin deficiency. J Clin Invest. 2002;110:1093–1103. doi: 10.1172/JCI15693. [DOI] [PMC free article] [PubMed] [Google Scholar]
- 31.Farooqi IS, Jebb SA, Langmack G, Lawrence E, Cheetham CH, Prentice AM, Hughes IA, McCamish MA, O’Rahilly S. Effects of recombinant leptin therapy in a child with congenital leptin deficiency. N Engl J Med. 1999;341:879–884. doi: 10.1056/NEJM199909163411204. [DOI] [PubMed] [Google Scholar]
- 32.Takeda S, Elefteriou F, Levasseur R, Liu X, Zhao L, Parker KL, Armstrong D, Ducy P, Karsenty G. Leptin regulates bone formation via the sympathetic nervous system. Cell. 2002;111:305–317. doi: 10.1016/s0092-8674(02)01049-8. [DOI] [PubMed] [Google Scholar]
- 33.Thomas T. The complex effects of leptin on bone metabolism through multiple pathways. Curr Opin Pharmacol. 2004;4:295–300. doi: 10.1016/j.coph.2004.01.009. [DOI] [PubMed] [Google Scholar]
- 34.Smith MR. Osteoporosis and obesity in men receiving hormone therapy for prostate cancer. J Urol. 2004;172:S52–S56. doi: 10.1097/01.ju.0000141820.17959.2f. [DOI] [PubMed] [Google Scholar]
- 35.Gourlay ML, Brown SA. Clinical considerations in premenopausal osteoporosis. Arch Intern Med. 2004;164:603–614. doi: 10.1001/archinte.164.6.603. [DOI] [PubMed] [Google Scholar]
- 36.Grunberg NE. Smoking cessation and weight gain. N Engl J Med. 1991;324:768–769. doi: 10.1056/NEJM199103143241111. [DOI] [PubMed] [Google Scholar]
- 37.Tothill P. Dual-energy x-ray absorptiometry measurements of total-body bone mineral during weight change. J Clin Densitom. 2005;8:31–38. doi: 10.1385/jcd:8:1:031. [DOI] [PubMed] [Google Scholar]
- 38.Tothill P, Hannan WJ, Cowen S, Freeman CP. Anomalies in the measurement of changes in total-body bone mineral by dual-energy X-ray absorptiometry during weight change. J Bone Miner Res. 1997;12:1908–1921. doi: 10.1359/jbmr.1997.12.11.1908. [DOI] [PubMed] [Google Scholar]
- 39.Bolotin HH. A new perspective on the causal influence of soft tissue composition on DXA-measured in vivo bone mineral density. J Bone Miner Res. 1998;13:1739–1746. doi: 10.1359/jbmr.1998.13.11.1739. [DOI] [PubMed] [Google Scholar]