Abstract
Malignant brain tumors exhibit distinct metabolic characteristics. Despite high levels of lactate, the intracellular pH of brain tumors is more alkaline than normal brain. Additionally, with increasing malignancy, brain tumors display intratumoral hypoxia. Carbonic anhydrase (CA) IX and XII are transmembrane isoenzymes that are induced by tissue hypoxia. They participate in regulation of pH homeostasis by catalyzing the reversible hydration of carbon dioxide. The aim of our study was to investigate whether brain tumors of different histology and grade of malignancy express elevated levels of CA IX and XII as compared to normal brain. We analyzed 120 tissue specimens from brain tumors (primary and metastatic) and normal brain for CA IX and XII expression by immunohistochemistry, Western blot, and in situ hybridization. Whereas normal brain tissue showed minimal levels of CA IX and XII expression, expression in tumors was found to be upregulated with increased level of malignancy. Hemangioblastomas, from patients with von Hippel–Lindau disease, also displayed high levels of CA IX and XII expression. Comparison of CA IX and XII staining with HIF-1α staining revealed a similar microanatomical distribution, indicating hypoxia as a major, but not the only, induction factor. The extent of CA IX and XII staining correlated with cell proliferation, as indicated by Ki67 labeling. The results demonstrate that CA IX and XII are upregulated in intrinsic and metastatic brain tumors as compared to normal brain tissue. This may contribute to the management of tumor-specific acid load and provide a therapeutic target.
Keywords: pH regulation, carbonic anhydrase, glioma, hypoxia
Malignant gliomas are the most frequent intrinsic brain tumors in adults (Davis et al., 1999). They are histologically characterized as pleomorphic, infiltrative tumors with microvascular proliferation and a high mitotic rate (Burger et al., 1985). Metabolically, these tumors display a distinct pattern. They show a high glucose utilization rate (Di Chiro et al., 1982), combined with excessive lactate production (Herholz et al., 1992), which is probably due to aerobic glycolysis (Imaya, 1994). Surprisingly, the intracellular pH of gliomas is significantly more alkaline than that of normal brain (Arnold et al., 1985; Cadoux-Hudson et al., 1989; Rottenberg et al., 1985). However, the extracellular space of tumors displays an acidic pH, as demonstrated by in vivo studies using pH microelectrodes (Jahde et al., 1982). Thus, the tumor cells maintain an intra/extracellular pH gradient, although the mechanisms underlying this phenomenon remain unclear (Mangiardi and Yodice, 1990). Finally, that gliomas become increasingly hypoxic is demonstrated by polarographic measurements in vivo (Collingridge et al., 1999) as well as by PET studies using 18F-misonidazole as a hypoxia-specific tracer (Valk et al., 1992).
Carbonic anhydrase (CA)2 IX and XII are recently discovered isoenzymes of the α-carbonic anhydrase family (Chegwidden and Carter, 2000). These enzymes regulate pH by the reversible hydration of CO2 to form HCO3− and protons (Ulmasov et al., 2000; Wingo et al., 2001). As a consequence of this reaction, the cytosolic pH becomes more alkaline because of the increased intracellular HCO3−. Simultaneously, H+ ions are transferred out of the cell and cause acidification of the extracellular milieu, which may facilitate tumor invasion by the activation of proteolytic enzymes in an acidic extracellular pH (Webb et al., 1999). In addition to CA XIV, CA IX and XII are the only enzymes of the α-carbonic anhydrase family that show a transmembranous location (Breton, 2001). Because these isoenzymes exhibit the pH-regulating actions on the cell membrane, they could contribute to the intra/extracellular pH gradient observed in brain tumors. Whereas CA IX and XII are expressed at a very low level in normal tissue, both enzymes are over-expressed in a variety of human tumors (Ivanov et al., 2001; Liao and Stanbridge, 2000; Liao et al., 1997; Saarnio et al., 1998a; Wykoff et al., 2000), which suggests a pathophysiological role in tumors. The main mechanism of induction of CA IX and CA XII is hypoxia (Ivanov et al., 2001; Olive et al., 2001; Stewart et al., 2002; Wykoff et al., 2000). Correspondingly, further studies of the CA IX promoter revealed a response element to hypoxia-inducible factor-1α (HIF-1α) (Wykoff et al., 2000). Therefore, we hypothesized that CA IX and XII are overexpressed in malignant brain tumors as a result of intratumoral hypoxia. Induction of these enzymes in brain tumors might contribute to an aggressive phenotype by mediating cell proliferation, enhanced invasion of the normal brain, and improved acid tolerance.
Materials and Methods
Tissue Processing
All tissue samples were obtained in accordance with the applicable guidelines of the National Institutes of Health, USA, or the University of Regensburg, Germany. A total of 112 tumor samples were collected from surgical specimens and quick-frozen in isopentane precooled on dry ice, embedded in optimal cutting temperature compound, and stored at −70°C. Eight normal brain tissue specimens for control studies were obtained from autopsy material from patients without CNS disease. The brains were obtained maximally 6 to 10 h postmortem and were handled by a procedure identical to that used for handling the tumor specimens. Histologic diagnosis of the tumor samples was performed by an independent pathologist. The histology and grade of malignancy of the examined samples are described in Table 1. All patients with hemangioblastomas had a known germline mutation of the von Hippel–Lindau (VHL) gene.
Table 1.
Tissue samples of normal brain and different brain tumors analyzed for CA IX and XII expression by immunohistochemistry
| Histology | n |
|---|---|
| Normal brain | 8 |
| Pilocytic astrocytoma WHO grade I | 3 |
| Low-grade astrocytoma WHO grade II | 14 |
| Anaplastic astrocytoma WHO grade III | 9 |
| Glioblastoma multiforme WHO grade IV | 29 |
| Meningiomas WHO grade I | 14 |
| Metastases | 29 |
| Primitive neuroectodermal tumors (PNET) | 4 |
| Hemangioblastomas | 10 |
Immunohistochemistry
Cryosections of 14-μm thickness were collected on silanated slides (Digene Diagnostics, Beltsville, Md.). Immunohistochemistry was performed as described previously (Papavassiliou et al., 1997). In brief, sections were fixed by using 1X Histochoice (Amresco, Solon, Ohio) containing 0.1% Triton X-100 (Sigma, St. Louis, Mo.) for 12 min. After washing three times in 1× phosphate-buffered saline (PBS), endogenous peroxidase was quenched with 0.5% hydrogen peroxide in methanol for 20 min. Nonspecific binding was blocked by incubating the sections in PBS containing 2% bovine serum albumin and either 2% horse or 2% goat serum, according to the primary antibody detection system. All incubations in the primary antibodies were performed overnight at 4°C in a humidified chamber. CA IX staining was performed by using a monoclonal mouse anti-human CA IX antibody at a 1:20,000 dilution as described previously (Liao et al., 1994). For CA XII staining, we used a polyclonal rabbit anti-human CA XII antibody (provided by William S. Sly, St. Louis University) at a 1:500 dilution. For HIF-1α staining, a polyclonal rabbit anti-human HIF-1α antibody (Santa Cruz Biotechnology, Santa Cruz, Calif.) was used. As a control, sections on the same slide were incubated with non-immune mouse IgG at identical protein concentrations (CMG100, Cedarlane Laboratories Ltd., Hornby, Ont., Canada) or rabbit serum. Ki67 labeling was performed by incubating the sections with a polyclonal rabbit anti–human Ki67 antibody (NCL-Ki67p, Novocastra Laboratories Ltd., Newcastle upon Tyne, UK) at a concentration of 1:1000. Detection of primary antibody binding was performed by using a biotinylated secondary antibody (BA-1000 and BA-2000) followed by the avidin-biotin complex method according to the supplier’s directions (Vector Laboratories, Burlingame, Calif.). Ki67 labeling was performed on all samples of all histologies.
Grading of Immunohistochemical Staining and Statistical Analyses
The extent of CA IX and XII staining was graded semi-quantitatively by three observers who were blinded to the histologic diagnosis. First, the sections were scanned at low magnification (50×) in order to localize the areas with the strongest staining within the tissue section. In this area, CA IX- and XII-positive cells were counted in three high-power fields (200×) and expressed as percent of the total number of cells per field. The rating of the immunohistochemical staining was performed by using a four-grade, semiquantitative scale (1, no cells positive; 2, 1%–10% positive; 3, 10%–30% positive; 4, more than 30% positive). Samples from the diseased brains (segregated by histology) were compared to the normal brains. Statistical analysis was performed by using the Wilcoxon rank sum test; P values were adjusted for multiple comparisons by using the Bonferroni inequality. In contrast, the Ki67 labeling index was expressed as percent of Ki67-positive cells per vision field. The statistical analysis of the CA IX and XII staining scores versus the Ki67 labeling index was performed by using a Spearman rank–based correlation analysis (SigmaStat, SPSS Inc., Chicago, Ill.).
In Situ Hybridization Studies
The human cDNA encoding for CA IX and XII (Ivanov et al., 2001) was cloned into an SK2 Bluescript plasmid (Stratagene, La Jolla, Calif.) by using Apa I and EcoRI as restriction sites for the CA IX, which had a size of 618 bp. CA XII was cloned by using Bam HI and EcoRI as restriction sites, with the resulting probe size of 1000 bp. The probes were transcribed in sense and antisense direction with 35S-UTP using T7 and SP6 RNA polymerase. Tissue preparation and in situ hybridization were performed as described in detail (Wilkinson, 1992). In brief, tissue samples were fixed in 4% paraformaldehyde for 10 min. After the sections were washed in diethylpyrocarbonatetreated 1× PBS, they were acetylated with 0.25% acetic anhydride in 0.1 M triethanolamine-HCl, pH 8.0. Following dehydration with ethanol and delipidation with chloroform, radiolabeled RNA probes were applied to the sections at approximately 750,000 counts per minute. After overnight incubation at 55°C, slides were incubated in RNase A solution (20 mg/ml) for 30 min and then washed once in 2× saline sodium citrate and two times in 0.2× saline sodium citrate for an hour each at increasing temperatures. Finally, the slides were dehydrated by using increasing ethanol concentrations and air-dried. To study the microanatomical distribution of CA IX and XII expression, sections were dipped into nuclear track emulsion (NTB-2, Kodak, Rochester, N.Y.), exposed for six weeks, developed (D19, Kodak, Rochester, N.Y.) for 2 min at 16°C, and counterstained with cresyl violet.
Protein Extraction and Western Blotting
From representative samples, frozen tissue was homogenized in a rapid immunoprecipitation assay buffer solution containing a protease inhibitor cocktail consisting of sodium orthovanadate (100 mM), aprotinin (1.5 mg/ml), and phenylmethylsulfonyl fluoride (10 mg/ml). Total protein assays were done by a modified Lowry method. A 40-μg sample of each protein extract was separated by electrophoresis on a 12% sodium dodecyl sulfate–polyacrylamide gel electrophoresis gel and transferred to a nitrocellulose membrane. The blot was blocked for 1 h in 5% nonfat dry milk and subsequently incubated in the anti-CA IX antibody at a 1:20,000 concentration and in the anti-CA XII antibody at a 1:5,000 concentration. After the blot was washed in Tris-buffered saline three times for 10 min, horseradish peroxidase–linked secondary antibodies were applied at a concentration of 1:5,000 for 1 h (Cedarlane Laboratories Ltd., Hornby, Ont., Canada). Following three washes in Tris-buffered saline for 10 min each, visualization was performed using a chemiluminescence detection system (Pierce SuperSignal, Rockford, Ill.). Equal loading of the lanes is indicated by reprobing for β-actin.
Results
CA IX and XII Immunohistochemistry and Semiquantitative Scoring
Normal Brain and Gliomas
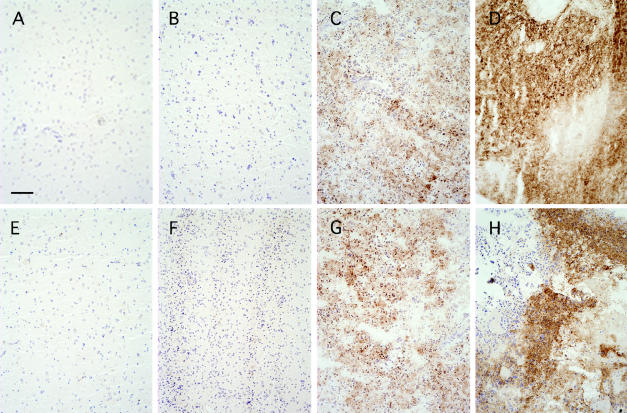
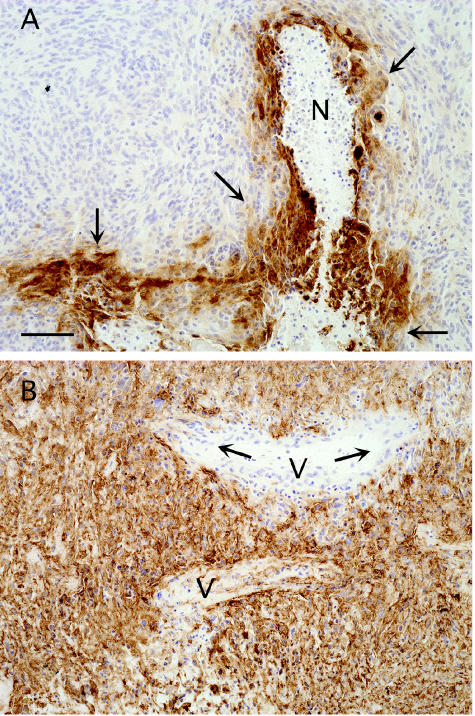
No CA IX expression was detected in any of the normal brain tissue specimens (Fig. 1A). Very limited staining in a few scattered cells was detected in some low-grade astrocytomas, but most of these samples did not show any positive staining (Fig. 1B). In the anaplastic astrocytomas, CA IX staining was readily observed in several specimens (Fig. 1C). However, one of these specimens did not show any staining, and three samples (33%) showed only weak to moderate staining. Most of the CA IX–positive cells were clustered around specific areas within the tissue section. The strongest and most consistent staining of all glioma samples was observed in the glioblastomas (Fig. 1D). In almost all of the samples (96.6%) CA IX expression was detected. Furthermore, 48.3% of samples showed expression in more than 30% of all cells within the vision field. In the majority of the samples, staining was detected around necrotic areas (Fig. 2A). However, four samples (13.8%) showed a more overall diffuse staining pattern without any association to areas of obvious necrosis. The expression was found in almost all tumor cells, including those near blood vessels, which suggests that hypoxia is not the only mechanism of induction (Fig. 2B). Analogous to the CA IX results in gliomas, the CA XII staining showed a marked increase of the CA XII expression with increasing grade of malignancy (Figs. 1E–H). In contrast to the CA IX results, two of the normal brain samples (25%) showed weak CA XII staining, which appeared to be associated for the most part with small capillaries. The CA XII staining of the malignant glioma samples was typically more homogenous throughout the tumor sections compared to that of CA IX, but was also increased around areas of micronecrosis (Fig. 1G).
Fig. 1.
Immunohistochemical detection of CA IX and XII in normal brain and gliomas. Sections of normal brain and gliomas of increasing grades of malignancy were analyzed by immunohistochemistry using antibodies against CA IX (A–D) or CA XII (E–H). Staining of normal brain sections (A and E) did not show any CA IX and XII expression. In the low-grade gliomas (B and F), only weak and occasional staining was observed. Anaplastic astrocytomas (C and G) showed distinct patches of increased staining. The strongest staining was observed in the glioblastoma multiforme samples (D and H) and was most evident in perinecrotic areas. Bar = 100 μm.
Fig. 2.
Patterns of CA IX expression in glioblastomas. A. Increased CA IX expression (arrows) around areas of micronecrosis (N) was consistently observed in glioblastoma specimens. B. In some glioblastoma specimens, a less intense but more widespread staining, in which almost all of the cells stained positively for CA IX, was detected throughout the entire section. Note the vessels (V) in the middle of the section, which suggests that hypoxic induction is unlikely in this case. The capillary endothelial cells (arrows) are not stained, indicating a tumor-cell-specific expression of CA IX. Bar = 100 μm.
Metastases
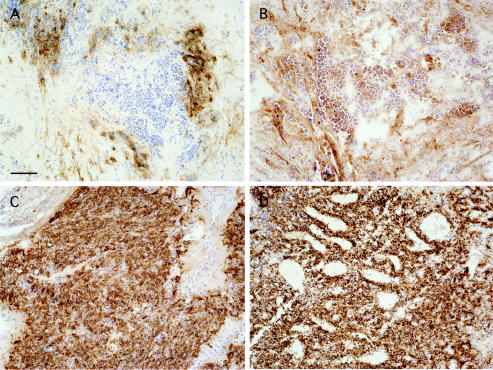
The cerebral metastases of malignant non-CNS tumors also showed strong CA IX and XII staining (Figs. 3A and B, respectively). Most of the staining was observed around areas of micronecrosis. Metastatic tumors examined included lung, breast, kidney, and melanoma. There was no significant difference in the staining scores for the different types of primary tumors, although the sample number within each group was not sufficient to generate statistical power.
Fig. 3.
Immunohistochemical detection of CA IX and XII in brain metastases and hemangioblastomas. Specimens from a brain metastasis (non-small-cell carcinoma of the lung, panels A and B) and a capillary hemangioblastoma from a patient with VHL disease (panels C and D), stained positively for both CA IX (A and C) and CA XII (B and D). Note the perinecrotic pattern observed in the metastatic tumor (A). In the VHL-associated hemangioblastoma, positive staining is observed consistently throughout the sections, even in the absence of necrosis. Bar = 100 μm.
Hemangioblastomas
The most widespread CA IX and XII staining of all tumors was found in the hemangioblastoma samples (Figs. 3C and D, respectively). Sixty percent of all samples were scored with the highest grade by all of the observers. Positive staining was distributed throughout the entire sections (Figs. 3C and D). No areas of necrosis were present in the hemangioblastomas, and staining of cells in a clustered pattern (as observed around necroses) was not observed.
Meningiomas
In the meningiomas, we consistently found an increased CA IX and XII expression in comparison to the normal brain. The staining was diffuse and evenly distributed throughout the tissue sections. Since none of the meningiomas displayed areas of necrosis, the clustered enhancement of the CA IX and XII staining as observed in the high-grade gliomas and metastases was not found in the meningioma sections.
Semiquantitative Scoring
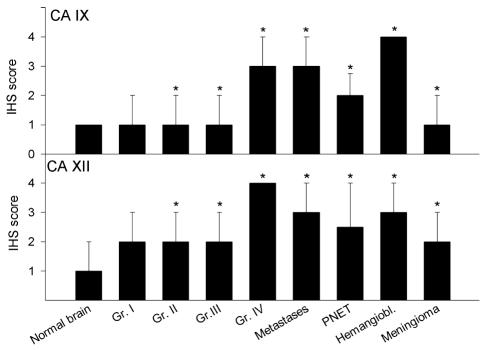
The overall grades of the staining were comparable for CA IX and CA XII. However, the distribution of scores within the groups was wider in the CA XII scoring. Both isoenzymes showed a significant (P < 0.05) increase in comparison to normal brain in all of the tumor groups except the grade I astrocytoma samples (Fig. 4). However, this tumor group had a very low sample size (n = 3), which is not sufficient to detect a significant difference. An additional analysis examining the correlation of CA IX and CA XII expression and tumor grade in intrinsic brain tumors (glioma grades I–IV) was also performed by using the rank-based correlation described in Materials and Methods. A significant correlation between CA IX and XII expression and increasing grade of malignancy in primary brain tumors was observed (CA IX vs. tumor grade: correlation coefficient = 0.464, P < 0.01; CA XII vs. tumor grade: correlation coefficient = 0.409, P < 0.01).
Fig. 4.
Semiquantitative analysis of CA staining and tumor type. Immunohistochemical staining (IHS) scores of the CA IX (upper panel) and CA XII (lower panel) sections were ranked according to the semiquantitative rating scale described in Materials and Methods. Histologic classification is indicated on the x-axis (Gr. = glioma grade). The graph depicts the median values of the scoring data, and the bars indicate the 75th percentile of the data distribution. Statistical analysis (as described in Materials and Methods) revealed that CA IX and XII expression differed significantly from normal brain in all but the grade I gliomas. *P < 0.05 in comparison to normal brain.
Correlation of Ki67 Labeling and CA IX and XII Expression
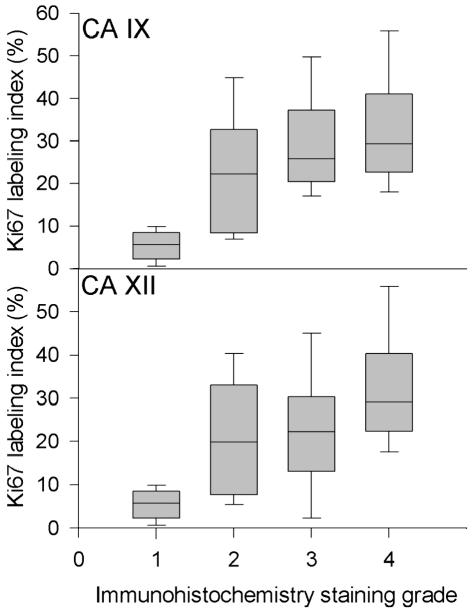
Tumor samples were also analyzed for Ki67-positive cells to determine if there was a correlation between the extent of CA-positive and Ki67-positive (actively dividing) cells. To examine the correlation between CA IX and XII expression and cell proliferation as shown by Ki67 labeling index, we performed a rank-based correlation analysis and found that both CA IX and CA XII expression correlated significantly with the Ki67 labeling index (CA IX vs. Ki67: correlation coefficient = 0.751, P < 0.01; CA XII vs. Ki67: correlation coefficient = 0.532, P < 0.01) (Fig. 5).
Fig. 5.
Analysis of CA IX and CA XII staining and cell proliferation rate. Ki67-positive cells were counted in a high-power (200×) vision field and are expressed as percentage of the total number of cells per vision field. All histologies were included in this analysis. The Ki67 data were calculated for each CA IX (upper) or XII (lower) staining score group (x-axis). The line within the box depicts the median, and the upper boundary of the box indicates the 75th percentile, the lower boundary the 25th percentile. Whiskers above and below show the 90th and 10th percentiles, respectively. Using a rank-based correlation analysis as described in Materials and Methods, we determined that both CA IX and CA XII correlate with the Ki67 labeling index (CA IX vs. Ki67: correlation coefficient = 0.751, P < 0.01; CA XII vs. Ki67: correlation coefficient = 0.532, P < 0.01).
HIF-1α Immunohistochemistry
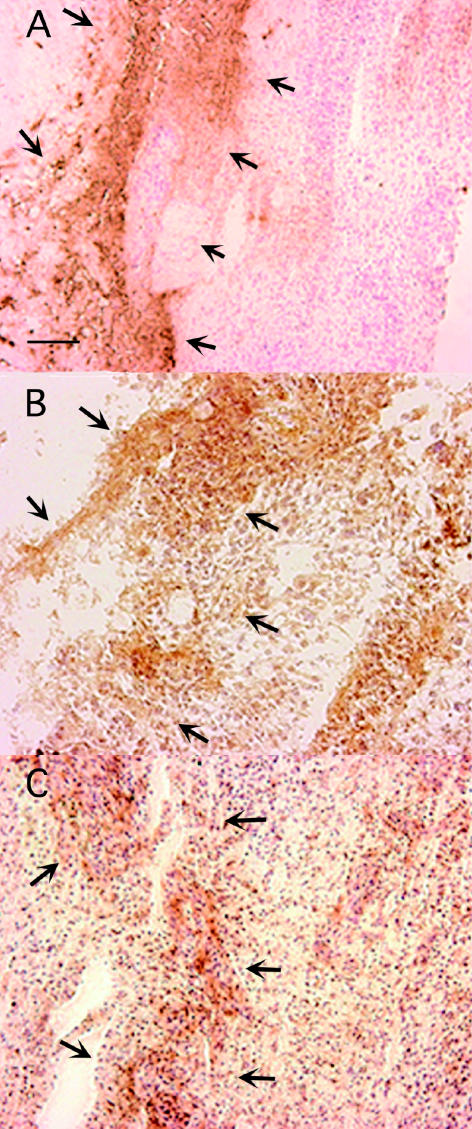
Adjacent sections were stained for HIF-1α to examine the association between CA IX and XII expression and tissue hypoxia. HIF-1α staining was much weaker than the CA IX and XII labeling, but the microanatomical distribution of HIF-1α, CA IX, and CAXII staining within the section was similar (Figs. 6A–C). However, both the CA IX staining and the CA XII staining also showed a much larger area of distribution than the HIF-1α staining. The HIF-1α staining appeared to be more nuclear in contrast to the CA IX and XII staining, which for the most part was located on the cell membrane.
Fig. 6.
Coincidence of CA IX, CA XII, and HIF-1α in a glioblastoma specimen. Patterns of immunohistochemical staining of CA IX (A), CA XII (B), and HIF-1α (C) in adjacent sections were compared. The HIF-1α is weaker and more nuclear compared to CA IX and XII. The distribution shows a partial overlay among the three molecules. The region of greatest coincidence is indicated by the arrows. Bar = 100 μm.
Western Blotting Experiments
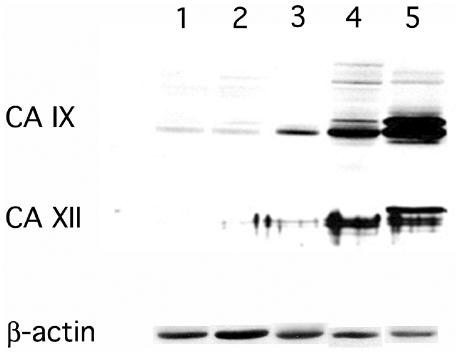
Western blotting for CA IX and XII from representative samples revealed a very weak signal in the normal brain and low-grade glioma samples. In contrast, the anaplastic astrocytoma samples showed markedly increased expression. The strongest upregulation of CA IX and XII protein expression was observed in glioblastoma samples (Fig. 7). Thus, the results of the CA IX and the CA XII Western blot were in agreement with the immunohistochemistry scoring, showing increased expression of both CA IX and XII with higher grades of malignancy. Although the increased expression pattern of CA IX and XII proteins in the malignant gliomas was similar, the extent of upregulation was generally higher for CA IX than CA XII.
Fig. 7.
Western blot analysis of CA IX and XII in specimens of increasing malignancy. Protein extracts (40 μg) of representative samples from normal brain (lanes 1 and 2), low-grade astrocytoma (lane 3), anaplastic astrocytoma (lane 4), and glioblastoma multiforme (lane 5) were separated and transferred to a nitrocellulose membrane. Western blotting for CA IX and CA XII was performed as described in the Materials and Methods section on five samples of each tissue class (normal brain, low-grade astrocytoma, anaplastic astrocytoma, and glioblastoma). Representative results show increased expression for both CA IX and XII in gliomas with higher grade of malignancy, although the extent of CA IX upregulation appears stronger than that of CA XII. Note that the 54/58-kd double band in the CA IX results and the 43/44-kd doublet in the CA XII results occur only in the samples with higher expression (lanes 4 and 5). Relative protein loading is shown by reprobing with an antibody to β-actin.
In Situ Hybridization for CA IX and XII
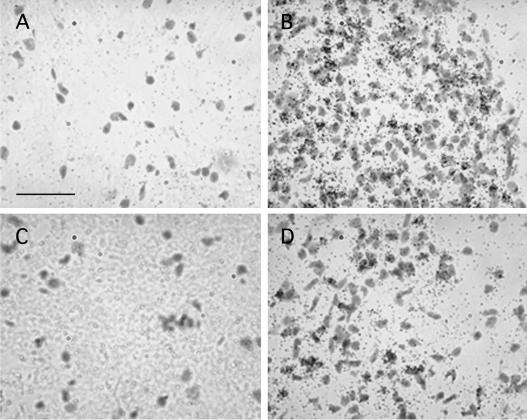
Corresponding to the immunohistochemical staining, in situ hybridization studies of adjacent tissue sections revealed a strong induction of the CA IX mRNA in glioblastoma sections compared to the normal brain sections (Figs. 8A and B). Similar results were found in the CA XII in situ hybridization (Figs. 8C and D), although the intensity of CA XII mRNA expression in the glioblastomas was generally lower and the distribution less focal in comparison to the CA IX mRNA expression. Control sections hybridized with the corresponding sense probe did not show any hybridization signal (data not shown).
Fig. 8.
Analysis of CA IX and CA XII mRNA expression by in situ hybridization. 35S-radiolabeled riboprobes complementary (antisense) to CA IX (A and B) and CA XII (C and D) were hybridized to normal brain (A and C) and glioblastoma multiforme (B and D) sections. After emulsion autoradiography and counterstaining in cresyl violet, bright field photographs of representative sections were taken. A significant upregulation of CA IX and XII mRNA in the glioblastoma samples was observed. Representative results from eight normal brains and 20 glioblastoma specimens are shown. In accordance with the Western blot results, the extent of CA IX induction appeared to be significantly higher than that of CA XII. Bar = 100 μm.
Discussion
We demonstrate that both CA IX and XII are overexpressed in primary and metastatic brain tumors as compared to their expression in normal brain. The extent of CA IX and XII expression increased with the grade of malignancy, which suggests that these molecules contribute to the increasingly malignant phenotype of the tumor.
In 1930, Otto Warburg demonstrated that tumors preferentially convert glucose into lactic acid, even under normoxic conditions (Warburg, 1931). This metabolic abnormality has been confirmed for gliomas in vitro (Imaya, 1994) and in vivo (Herholz et al., 1992). This circumstance creates a tumor-specific acid load, which should cause intracellular acidosis in brain tumors. Surprisingly, PET studies (Rottenberg et al., 1984) as well as MR spectroscopy data (Cadoux-Hudson et al., 1989) indicate that the intracellular pH of gliomas is alkaline compared to that of normal brain. Carbonic anhydrases are powerful pH regulators, potentially catalyzing more than one million reactions per second (Sly and Hu, 1995). Upregulation of CA IX and XII in brain tumors may buffer the acidic pH caused by the accumulation of lactic acid. Hypoxia has been shown to be a common environmental change in malignant tumors (Vaupel et al., 2001). Hypoxia normally causes apoptotic cell death via stabilization and accumulation of p53 (An et al., 1998). However, this mechanism of apoptosis requires hypoxic acidosis and is rescued by enhanced buffering, which might be provided by CA IX and XII, enzymes that are upregulated in hypoxic regions (Schmaltz et al., 1998). Thus, CA IX and XII may rescue the tumor cells from apoptotic cell death by the uncoupling of hypoxia and acidosis. Therefore, inhibition of CA IX and XII could be an effective treatment strategy for malignant brain tumors. In fact, Supuran et al. have shown that aromatic sulfonamide CA inhibitors act as efficient growth inhibitors for glioma cells in vitro (Supuran et al., 2001).
During the reversible hydration of CO2 catalyzed by CAs, bicarbonate is formed and H+ ions are transferred to the extracellular space. This in turn causes acidification of the extracellular milieu with activation of proteolytic enzymes and enhanced tumor invasiveness (Martinez-Zaguilan et al., 1996; Webb et al., 1999). In accordance with this hypothesis, in vitro studies using a Matrigel invasion assay (BD Biosciences) showed that inhibition of CA activity leads to a reduced invasion rate of renal cancer cells (Parkkila et al., 2000). Therefore, CA IX and XII expression might contribute to invasion of tumor cells into the normal brain, one of the most fundamental challenges in the management of brain tumors.
CA IX is considered to be a chimeric gene, assembled by gene shuffling (Opavsky et al., 1996). It not only contains the enzymatic portion of the CA domain but also displays an additional portion that might contribute to brain tumor progression. The extracellular portion of CA IX contains a proteoglycan domain with homology to the keratan sulfate attachment domain of a large aggregating proteoglycan, termed aggrecan (Tashian et al., 2000). It has been shown that these molecules mediate adhesion and spreading of neuronal and glial cells by binding to extracellular matrix proteins like tenascin or to cell surface receptors such as N-CAM and Ng-CAM (Barnea et al., 1994; Peles et al., 1995). Subsequently, Zavada et al. (2000) demonstrated that purified CA IX enhances cell adhesion, spreading, and survival in vitro. Additionally, the biological consequences of transfection with CA IX cDNA into normal cells are quite striking. The cells exhibit a significantly increased growth rate, enhanced DNA synthesis, and diminished contact inhibition (Pastorek et al., 1994). A number of studies suggest a relationship between CA IX expression and cell proliferation (Saarnio et al., 1998a, b; Vermylen et al., 1999), although other studies fail to demonstrate a clear-cut correlation between CA IX expression and cell proliferation (Giatromanolaki et al., 2001; Wykoff et al., 2001). We have found a significant correlation between CA IX and XII expression and the Ki67 labeling index. The strong upregulation of CA IX and CA XII may assist the cell in maintaining a proliferative state despite the presence of tissue hypoxia, which would normally cause growth arrest (Hockel and Vaupel, 2001).
Studies using a range of different tumor cells (Ivanov et al., 2001; Wykoff et al., 2000) show that both CA IX and CA XII are strongly induced by hypoxia. Accordingly, a number of studies (Giatromanolaki et al., 2001; Ivanov et al., 2001; Koukourakis et al., 2001; Loncaster et al., 2001) show a significant association of CA IX upregulation with areas of tumor necrosis. Olive et al. (2001) demonstrated, by co-labeling with the hypoxia marker pimonidazole and CA IX immunoreactivity, that cells expressing the most CA IX are located in hypoxic areas of cervical carcinomas. We also observed in a majority of the brain tumor specimens a CA IX staining pattern clustered around areas of necrosis. CA XII was found to be expressed more diffusely but was further increased around hypoxic/necrotic regions, which confirms the findings of Wykoff et al. (2001). However, Wykhoff et al. (2000) also showed CA IX expression distant from areas of necrosis. In another study analyzing cervical carcinoma specimens (Liao et al., 1994), a diffuse CA IX expression pattern was found in which 80% of the tumor cells were positively stained without any association with areas of necrosis. In a subset of our specimens, we also found intense CA IX and XII expression distributed throughout the section and unrelated to areas of necrosis. Although we found a similar distribution pattern of CA IX, CA XII, and HIF-1α expression, the extent of positive staining was much higher for CA IX and XII as compared to HIF-1α. This might be related to technical issues such as the purely intranuclear localization of HIF-1α, which might reduce the accessibility to the antibody. Moreover, HIF-1α is known to have a short half-life (Pugh and Ratcliffe, 2003), which might reduce the staining intensity even further. However, it is also possible that CA IX and XII might be induced without significant accumulation of HIF-1α and without any association to tissue necrosis. Recent reports have demonstrated that CA IX expression can be induced at moderate levels of hypoxia mediated by phosphatidylinositol 3′-kinase without accumulation of HIF-1α (Kaluz et al., 2002). Mutation of genes regulating expression of CA IX and XII could also underlie the diffuse overall expression within the tumor independent from necrotic areas. Normal p53 downregulates CA IX expression (Kaluzova et al., 2000). Mutations of the p53 gene are one of the most frequent genetic alterations in gliomas (Maher et al., 2001). The increased CA IX expression in malignant brain tumors might be caused by a loss of expression control due to a p53 mutation. CA IX and XII are under control of the VHL tumor suppressor gene (Ivanov et al., 1998). Loss of the VHL protein results in upregulation of HIF-1α in affected cells. Thus, the most widespread and consistent upregulation of CA IX and XII occurs in the hemangioblastomas. Interestingly, this gene locus also displays a loss of heterozygosity in up to 40% of all low-grade gliomas, although somatic mutations of the gene in gliomas are rare (Kanno et al., 1997).
CA IX and XII might be attractive targets for adjuvant brain tumor therapy. Inhibition of the pH-regulating function could restore susceptibility to an acid load resulting from lactate accumulation and to hypoxia-induced apoptosis. Concurrently, the activation of proteolytic enzymes caused by acidification of the extracellular environment would be reduced. Absence of CA IX expression in normal brain, but strong expression in almost all (96.6%) of the glioblastomas, suggests that CA IX may be a tumor-specific, cell-membrane-associated marker. Using CA IX as a target for active immunotherapy could be explored in this setting. In fact, a similar study with kidney cancer cells in vitro using this approach produced a remarkable antitumor response (Tso et al., 2001).
In conclusion, CA IX and XII are overexpressed in primary and metastatic brain tumors in comparison to the expression in normal brain. The extent of expression increases with the grade of malignancy. The major mechanism of induction appears to be hypoxia, although alternative pathways also seem to be important. Because of the observational nature of our study, we cannot conclude whether CA IX and XII upregulation is merely a reaction to the hypoxia that occurs with aggressive tumor growth, or whether this upregulation also contributes to the aggressive phenotype. In fact, both possibilities may be true. Regardless of the function of these molecules in this setting, CA IX and XII might be attractive targets for adjuvant brain tumor therapy.
Acknowledgments
The authors thank William Sly for the generous gift of CA XII antibody and Nancy Edwards for assistance in preparation of the figures and manuscript.
Footnotes
Abbreviations used are as follows: CA, carbonic anhydrase; HIF, hypoxia-inducible factor; PBS, phosphate-buffered saline; VHL, von Hippel–Lindau.
References
- An WG, Kanekal M, Simon MC, Maltepe E, Blagosklonny MV, Neckers LM. Stabilization of wild-type p53 by hypoxia-inducible factor 1alpha. Nature. 1998;392:405–408. doi: 10.1038/32925. [DOI] [PubMed] [Google Scholar]
- Arnold JB, Junck L, Rottenberg DA. In vivo measurement of regional brain and tumor pH using [14C]dimethyloxazolidinedione and quantitative autoradiography. J Cereb Blood Flow Metab. 1985;5:369–375. doi: 10.1038/jcbfm.1985.51. [DOI] [PubMed] [Google Scholar]
- Barnea G, Grumet M, Sap J, Margolis RU, Schlessinger J. Close similarity between receptor-linked tyrosine phosphatase and rat brain proteoglycan. Cell. 1994;76:205. doi: 10.1016/0092-8674(94)90328-x. [DOI] [PubMed] [Google Scholar]
- Breton S. The cellular physiology of carbonic anhydrases. J Pancreas. 2001;2(suppl):159–164. [PubMed] [Google Scholar]
- Burger PC, Vogel FS, Green SB, Strike TA. Glioblastoma multiforme and anaplastic astrocytoma. Pathologic criteria and prognostic implications. Cancer. 1985;56:1106–1111. doi: 10.1002/1097-0142(19850901)56:5<1106::aid-cncr2820560525>3.0.co;2-2. [DOI] [PubMed] [Google Scholar]
- Cadoux-Hudson TA, Blackledge MJ, Rajagopalan B, Taylor DJ, Radda GK. Human primary brain tumour metabolism in vivo: A phosphorus magnetic resonance spectroscopy study. Br J Cancer. 1989;60:430–436. doi: 10.1038/bjc.1989.300. [DOI] [PMC free article] [PubMed] [Google Scholar]
- Chegwidden WR, Carter ND. Introduction to the carbonic anhydrases. EXS. 2000;90:14–28. [PubMed] [Google Scholar]
- Collingridge DR, Piepmeier JM, Rockwell S, Knisely JP. Polarographic measurements of oxygen tension in human glioma and surrounding peritumoural brain tissue. Radiother Oncol. 1999;53:127–131. doi: 10.1016/s0167-8140(99)00121-8. [DOI] [PubMed] [Google Scholar]
- Davis FG, McCarthy B, Jukich P. The descriptive epidemiology of brain tumors. Neuroimaging Clin N Am. 1999;9:581–594. [PubMed] [Google Scholar]
- Di Chiro G, DeLaPaz RL, Brooks RA, Sokoloff L, Kornblith PL, Smith BH, Patronas NJ, Kufta CV, Kessler RM, Johnston GS, Manning RG, Wolf AP. Glucose utilization of cerebral gliomas measured by [18F] fluorodeoxyglucose and positron emission tomography. Neurology. 1982;32:1323–1329. doi: 10.1212/wnl.32.12.1323. [DOI] [PubMed] [Google Scholar]
- Giatromanolaki A, Koukourakis MI, Sivridis E, Pastorek J, Wykoff CC, Gatter KC, Harris AL. Expression of hypoxia-inducible carbonic anhydrase-9 relates to angiogenic pathways and independently to poor outcome in non-small cell lung cancer. Cancer Res. 2001;61:7992–7998. [PubMed] [Google Scholar]
- Herholz K, Heindel W, Luyten PR, denHollander JA, Pietrzyk U, Voges J, Kugel H, Friedmann G, Heiss W-D. In vivo imaging of glucose consumption and lactate concentration in human gliomas. Ann Neurol. 1992;31:319–327. doi: 10.1002/ana.410310315. [DOI] [PubMed] [Google Scholar]
- Hockel M, Vaupel P. Biological consequences of tumor hypoxia. Semin Oncol. 2001;28(suppl):36–41. [PubMed] [Google Scholar]
- Imaya H. Lactate metabolism conducted by rat C6-glioma in the cells culture. J Neurosurg Sci. 1994;38:223–227. [PubMed] [Google Scholar]
- Ivanov SV, Kuzmin I, Wei MH, Pack S, Geil L, Johnson BE, Stanbridge EJ, Lerman MI. Down-regulation of transmembrane carbonic anhydrases in renal cell carcinoma cell lines by wild-type von Hippel-Lindau transgenes. Proc Natl Acad Sci USA. 1998;95:12596–12601. doi: 10.1073/pnas.95.21.12596. [DOI] [PMC free article] [PubMed] [Google Scholar]
- Ivanov S, Liao SY, Ivanova A, Danilkovitch-Miagkova A, Tarasova N, Weirich G, Merrill MJ, Proescholdt MA, Oldfield EH, Lee J, Zavada J, Waheed A, Sly W, Lerman MI, Stanbridge EJ. Expression of hypoxia-inducible cell-surface transmembrane carbonic anhydrases in human cancer. Am J Pathol. 2001;158:905–919. doi: 10.1016/S0002-9440(10)64038-2. [DOI] [PMC free article] [PubMed] [Google Scholar]
- Jahde E, Rajewsky MF, Baumgartl H. pH distributions in transplanted neural tumors and normal tissues of BDIX rats as measured with pH microelectrodes. Cancer Res. 1982;42:1498–1504. [PubMed] [Google Scholar]
- Kaluz S, Kaluzova M, Chrastina A, Olive PL, Pastorekova S, Pastorek J, Lerman MI, Stanbridge EJ. Lowered oxygen tension induces expression of the hypoxia marker MN/carbonic anhydrase IX in the absence of hypoxia-inducible factor 1 alpha stabilization: A role for phosphatidylinositol 3′-kinase. Cancer Res. 2002;62:4469–4477. [PubMed] [Google Scholar]
- Kaluzova M, Pastorekova S, Pastorek J, Kaluz S. P53 tumour suppressor modulates transcription of the TATA-less gene coding for the tumour-associated carbonic anhydrase MN/CA IX in MaTu cells. Biochim Biophys Acta. 2000;1491:20–26. doi: 10.1016/s0167-4781(00)00015-4. [DOI] [PubMed] [Google Scholar]
- Kanno H, Shuin T, Kondo K, Yamamoto I, Ito S, Shinonaga M, Yoshida M, Yao M. Somatic mutations of the von Hippel–Lindau tumor suppressor gene and loss of heterozygosity on chromosome 3p in human glial tumors. Cancer Res. 1997;57:1035–1038. [PubMed] [Google Scholar]
- Koukourakis MI, Giatromanolaki A, Sivridis E, Simopoulos K, Pastorek J, Wykoff CC, Gatter KC, Harris AL. Hypoxia-regulated carbonic anhydrase-9 (CA9) relates to poor vascularization and resistance of squamous cell head and neck cancer to chemoradiotherapy. Clin Cancer Res. 2001;7:3399–3403. [PubMed] [Google Scholar]
- Liao SY, Stanbridge EJ. Expression of MN/CA9 protein in Papanicolaou smears containing atypical glandular cells of undetermined significance is a diagnostic biomarker of cervical dysplasia and neoplasia. Cancer. 2000;88:1108–1121. doi: 10.1002/(sici)1097-0142(20000301)88:5<1108::aid-cncr23>3.0.co;2-d. [DOI] [PubMed] [Google Scholar]
- Liao SY, Brewer C, Zavada J, Pastorek J, Pastorekova S, Manetta A, Berman ML, DiSaia PJ, Stanbridge EJ. Identification of the MN antigen as a diagnostic biomarker of cervical intraepithelial squamous and glandular neoplasia and cervical carcinomas. Am J Pathol. 1994;145:598–609. [PMC free article] [PubMed] [Google Scholar]
- Liao SY, Aurelio ON, Jan K, Zavada J, Stanbridge EJ. Identification of the MN/CA9 protein as a reliable diagnostic biomarker of clear cell carcinoma of the kidney. Cancer Res. 1997;57:2827–2831. [PubMed] [Google Scholar]
- Loncaster JA, Harris AL, Davidson SE, Logue JP, Hunter RD, Wycoff CC, Pastorek J, Ratcliffe PJ, Stratford IJ, West CM. Carbonic anhydrase (CA IX) expression, a potential new intrinsic marker of hypoxia: Correlations with tumor oxygen measurements and prognosis in locally advanced carcinoma of the cervix. Cancer Res. 2001;61:6394–6399. [PubMed] [Google Scholar]
- Maher EA, Furnari FB, Bachoo RM, Rowitch DH, Louis DN, Cavenee WK, DePinho RA. Malignant glioma: Genetics and biology of a grave matter. Genes Dev. 2001;15:1311–1333. doi: 10.1101/gad.891601. [DOI] [PubMed] [Google Scholar]
- Mangiardi JR, Yodice P. Metabolism of malignant astrocytoma. Neurosurgery. 1990;26:1–19. doi: 10.1097/00006123-199001000-00001. [DOI] [PubMed] [Google Scholar]
- Martinez-Zaguilan R, Seftor EA, Seftor RE, Chu YW, Gillies RJ, Hendrix MJ. Acidic pH enhances the invasive behavior of human melanoma cells. Clin Exp Metastasis. 1996;14:176–186. doi: 10.1007/BF00121214. [DOI] [PubMed] [Google Scholar]
- Olive PL, Aquino-Parsons C, MacPhail SH, Liao SY, Raleigh JA, Lerman MI, Stanbridge EJ. Carbonic anhydrase 9 as an endogenous marker for hypoxic cells in cervical cancer. Cancer Res. 2001;61:8924–8929. [PubMed] [Google Scholar]
- Opavsky R, Pastorekova S, Zelnik V, Gibadulinova A, Stanbridge EJ, Zavada J, Kettmann R, Pastorek J. Human MN/CA9 gene, a novel member of the carbonic anhydrase family: Structure and exon to protein domain relationships. Genomics. 1996;33:480–487. doi: 10.1006/geno.1996.0223. [DOI] [PubMed] [Google Scholar]
- Papavassiliou E, Gogate N, Proescholdt M, Heiss JD, Walbridge S, Edwards NA, Oldfield EH, Merrill MJ. Vascular endothelial growth factor (vascular permeability factor) expression in injured rat brain. J Neurosci Res. 1997;49:451–460. doi: 10.1002/(sici)1097-4547(19970815)49:4<451::aid-jnr6>3.0.co;2-7. [DOI] [PubMed] [Google Scholar]
- Parkkila S, Rajaniemi H, Parkkila AK, Kivela J, Waheed A, Pastorekova S, Pastorek J, Sly WS. Carbonic anhydrase inhibitor suppresses invasion of renal cancer cells in vitro. Proc Natl Acad Sci USA. 2000;97:2220–2224. doi: 10.1073/pnas.040554897. [DOI] [PMC free article] [PubMed] [Google Scholar]
- Pastorek J, Pastorekova S, Callebaut I, Mornon JP, Zelnik V, Opavsky R, Zat’ovicova M, Liao S, Portetelle D, Stanbridge EJ, Zavada J, Burny A, Kettmann R. Cloning and characterization of MN, a human tumor-associated protein with a domain homologous to carbonic anhydrase and a putative helix-loop-helix DNA binding segment. Oncogene. 1994;9:2877–2888. [PubMed] [Google Scholar]
- Peles E, Nativ M, Campbell PL, Sakurai T, Martinez R, Lev S, Clary DO, Schilling J, Barnea G, Plowman GD, Grumet M, Schlessinger J. The carbonic anhydrase domain of receptor tyrosine phosphatase beta is a functional ligand for the axonal cell recognition molecule contactin. Cell. 1995;82:251–260. doi: 10.1016/0092-8674(95)90312-7. [DOI] [PubMed] [Google Scholar]
- Pugh CW, Ratcliffe PJ. The von Hippel-Lindau tumor suppressor, hypoxia-inducible factor-1 (HIF-1) degradation, and cancer pathogenesis. Semin Cancer Biol. 2003;13:83–89. doi: 10.1016/s1044-579x(02)00103-7. [DOI] [PubMed] [Google Scholar]
- Rottenberg DA, Ginos JZ, Kearfott KJ, Junck L, Bigner DD. In vivo measurement of regional brain tissue pH using positron emission tomography. Ann Neurol. 1984;15(suppl):S98–S102. doi: 10.1002/ana.410150718. [DOI] [PubMed] [Google Scholar]
- Rottenberg DA, Ginos JZ, Kearfott KJ, Junck L, Dhawan V, Jarden JO. In vivo measurement of brain tumor pH using [11C]DMO and positron emission tomography. Ann Neurol. 1985;17:70–79. doi: 10.1002/ana.410170116. [DOI] [PubMed] [Google Scholar]
- Saarnio J, Parkkila S, Parkkila AK, Haukipuro K, Pastorekova S, Pastorek J, Kairaluoma MI, Karttunen TJ. Immunohistochemical study of colorectal tumors for expression of a novel transmembrane carbonic anhydrase, MN/CA IX, with potential value as a marker of cell proliferation. Am J Pathol. 1998a;153:279–285. doi: 10.1016/S0002-9440(10)65569-1. [DOI] [PMC free article] [PubMed] [Google Scholar]
- Saarnio J, Parkkila S, Parkkila AK, Waheed A, Casey MC, Zhou XY, Pastorekova S, Pastorek J, Karttunen T, Haukipuro K, Kairaluoma MI, Sly WS. Immunohistochemistry of carbonic anhydrase isozyme IX (MN/CA IX) in human gut reveals polarized expression in the epithelial cells with the highest proliferative capacity. J Histochem Cytochem. 1998b;46:497–504. doi: 10.1177/002215549804600409. [DOI] [PubMed] [Google Scholar]
- Schmaltz C, Hardenbergh PH, Wells A, Fisher DE. Regulation of proliferation-survival decisions during tumor cell hypoxia. Mol Cell Biol. 1998;18:2845–2854. doi: 10.1128/mcb.18.5.2845. [DOI] [PMC free article] [PubMed] [Google Scholar]
- Sly WS, Hu PY. Human carbonic anhydrases and carbonic anhydrase deficiencies. Annu Rev Biochem. 1995;64:375–401. doi: 10.1146/annurev.bi.64.070195.002111. [DOI] [PubMed] [Google Scholar]
- Stewart M, Talks K, Leek R, Turley H, Pezzella F, Harris A, Gatter K. Expression of angiogenic factors and hypoxia inducible factors HIF 1, HIF 2 and CA IX in non-Hodgkin’s lymphoma. Histopathology. 2002;40:253–260. doi: 10.1046/j.1365-2559.2002.01357.x. [DOI] [PubMed] [Google Scholar]
- Supuran CT, Briganti F, Tilli S, Chegwidden WR, Scozzafava A. Carbonic anhydrase inhibitors: Sulfonamides as antitumor agents? Bioorg Med Chem. 2001;9:703–714. doi: 10.1016/s0968-0896(00)00288-1. [DOI] [PubMed] [Google Scholar]
- Tashian RE, Hewett-Emmett D, Carter N, Bergenhem NC. Carbonic anhydrase (CA)-related proteins (CA-RPs), and transmembrane proteins with CA or CA-RP domains. EXS. 2000;90:105–120. doi: 10.1007/978-3-0348-8446-4_6. [DOI] [PubMed] [Google Scholar]
- Tso CL, Zisman A, Pantuck A, Calilliw R, Hernandez JM, Paik S, Nguyen D, Gitlitz B, Shintaku PI, de Kernion J, Figlin R, Belldegrun A. Induction of G250-targeted and T-cell-mediated antitumor activity against renal cell carcinoma using a chimeric fusion protein consisting of G250 and granulocyte/monocytecolony stimulating factor. Cancer Res. 2001;61:7925–7933. [PubMed] [Google Scholar]
- Ulmasov B, Waheed A, Shah GN, Grubb JH, Sly WS, Tu C, Silverman DN. Purification and kinetic analysis of recombinant CA XII, a membrane carbonic anhydrase overexpressed in certain cancers. Proc Natl Acad Sci USA. 2000;97:14212–14217. doi: 10.1073/pnas.97.26.14212. [DOI] [PMC free article] [PubMed] [Google Scholar]
- Valk PE, Mathis CA, Prados MD, Gilbert JC, Budinger TF. Hypoxia in human gliomas: Demonstration by PET with fluorine-18-fluoromisonidazole. J Nucl Med. 1992;33:2133–2137. [PubMed] [Google Scholar]
- Vaupel P, Kelleher DK, Hockel M. Oxygen status of malignant tumors: Pathogenesis of hypoxia and significance for tumor therapy. Semin Oncol. 2001;28(suppl):29–35. doi: 10.1016/s0093-7754(01)90210-6. [DOI] [PubMed] [Google Scholar]
- Vermylen P, Roufosse C, Burny A, Verhest A, Bosschaerts T, Pastorekova S, Ninane V, Sculier JP. Carbonic anhydrase IX antigen differentiates between preneoplastic malignant lesions in non-small cell lung carcinoma. Eur Respir J. 1999;14:806–811. doi: 10.1034/j.1399-3003.1999.14d14.x. [DOI] [PubMed] [Google Scholar]
- Warburg, O. (1931) The metabolism of the carcinoma cell. In: Warburg, O. (Ed.), The metabolism of tumours: Investigations from the Kaiser Wilhelm Institute for Biology, Berlin-Dahlem New York: Richard R. Smith, pp. 129–169.
- Webb SD, Sherratt JA, Fish RG. Alterations in proteolytic activity at low pH and its association with invasion: A theoretical model. Clin Exp Metastasis. 1999;17:397–407. doi: 10.1023/a:1006667303583. [DOI] [PubMed] [Google Scholar]
- Wilkinson, D.G. (1992) The theory and practice of in situ hybridization. In: Wilkinson, D.G. (Ed.), In Situ Hybridization: A Practical Approach Oxford: Oxford University Press, 1–13.
- Wingo T, Tu C, Laipis PJ, Silverman DN. The catalytic properties of human carbonic anhydrase IX. Biochem Biophys Res Commun. 2001;288:666–669. doi: 10.1006/bbrc.2001.5824. [DOI] [PubMed] [Google Scholar]
- Wykoff CC, Beasley NJ, Watson PH, Turner KJ, Pastorek J, Sibtain A, Wilson GD, Turley H, Talks KL, Maxwell PH, Pugh CW, Ratcliffe PJ, Harris AL. Hypoxia-inducible expression of tumor-associated carbonic anhydrases. Cancer Res. 2000;60:7075–7083. [PubMed] [Google Scholar]
- Wykoff CC, Beasley N, Watson PH, Campo L, Chia SK, English R, Pastorek J, Sly WS, Ratcliffe P, Harris AL. Expression of the hypoxia-inducible and tumor-associated carbonic anhydrases in ductal carcinoma in situ of the breast. Am J Pathol. 2001;158:1011–1019. doi: 10.1016/S0002-9440(10)64048-5. [DOI] [PMC free article] [PubMed] [Google Scholar]
- Zavada J, Zavadova Z, Pastorek J, Biesova Z, Jezek J, Velek J. Human tumour-associated cell adhesion protein MN/CA IX: Identification of M75 epitope and of the region mediating cell adhesion. Br J Cancer. 2000;82:1808–1813. doi: 10.1054/bjoc.2000.1111. [DOI] [PMC free article] [PubMed] [Google Scholar]


