Abstract
Combinatorial regulation is an important feature of eukaryotic transcription. However, only a limited number of studies have characterized this aspect on a whole-genome level. We have conducted a genome-wide computational survey to identify cis-regulatory motif pairs that co-occur in a significantly high number of promoters in the S. cerevisiae genome. A pair of novel motifs, mRRPE and PAC, co-occur most highly in the genome, primarily in the promoters of genes involved in rRNA transcription and processing. The two motifs show significant positional and orientational bias with mRRPE being closer to the ATG than PAC in most promoters. Two additional rRNA-related motifs, mRRSE3 and mRRSE10, also co-occur with mRRPE and PAC. mRRPE and PAC are the primary determinants of expression profiles while mRRSE3 and mRRSE10 modulate these patterns. We describe a new computational approach for studying the functional significance of the physical locations of promoter elements that combine analyses of genome sequence and microarray data. Applying this methodology to the regulatory cassette containing the four rRNA motifs demonstrates that the relative promoter locations of these elements have a profound effect on the expression patterns of the downstream genes. These findings provide a function for these novel motifs and insight into the mechanism by which they regulate gene expression. The methodology introduced here should prove particularly useful for analyzing transcriptional regulation in more complex genomes.
The development of whole-genome microarrays has enabled global studies of the control of gene expression. The current approach for analyzing genome-wide transcriptional regulation uses motif-finding algorithms to discover transcriptional regulatory motifs in the promoters of coregulated genes (Spellman et al. 1998; Tavazoie et al. 1999). Coregulated genes have been identified using clustering algorithms to group together genes with similar expression profiles in microarray data (Sherlock 2000) or by grouping genes with similar cellular functions (Mewes et al. 2000). Analyzing the promoters of such gene sets has uncovered both previously known and new cis-regulatory motifs (Gasch et al. 2000; Hughes et al. 2000; Jelinsky et al. 2000).
While this computational approach has been extremely successful in identifying new promoter motifs, it does not address the effect of motif combinations on gene expression, an important mode of transcriptional regulation in eukaryotes (Kel et al. 1995; Quandt et al. 1996; Wagner 1997; Wagner 1999; Frith et al. 2001; GuhaThakurta and Stormo 2001). We have previously conducted an extensive computational search for synergistic motif pairs by analyzing microarray expression data (Pilpel et al. 2001). An alternative approach to discovering biologically significant motif combinations is described here, which assumes that motif pairs may be identified if they occur together at significantly high number of promoters.
Previous studies (Arnone and Davidson 1997; Kel et al. 1999; Berman et al. 2002; Halfon et al. 2002) have shown that individual regulatory motifs in promoters obey positional constraints whereby the number, order, and sometimes the distances between the motifs are important for determining the particular expression pattern. Given the abundance of genome sequences, such constraints could be used to identify the promoters most likely regulated by the motif combination, i.e., the promoters would contain the motifs with the correct positional preferences. Genes whose promoters do not exhibit such preferences could be excluded from analysis. The availability of genome-wide expression data gives us the opportunity to study the positional constraints on motif combinations on a genomic scale and test this hypothesis.
In this study, we have discovered several regulatory motif pairs that show significant co-occurrence in the promoters of Saccharomyces cerevisiae. The most significantly co-occurring motif pair, mRRPE (rRNA processing element) (Hughes et al. 2000)-PAC (polymerase A and C) (Dequard-Chablat et al. 1991) seems to control the expression of rRNA transcription and processing genes. The two motifs are found in close proximity at a significant number of promoters and also demonstrate significant orientational bias i.e., one motif (mRRPE) tends to be closer to the translational start site (the ATG) than the other. These biases in relative positions of mRRPE-PAC are associated with similar expression profiles suggesting that they are responsible for controlling the particular expression pattern. We have also identified two additional motifs, MIPS rRNA Synthesis Element 3 (mRRSE3) and MIPS rRNA Synthesis Element 10 (mRRSE10), that are closely associated with mRRPE-PAC at several promoters. Analysis of expression profiles of genes containing combinations of the rRNA-related motifs suggests that each additional motif contributes to a more coherent expression pattern during sporulation. These findings suggest a hierarchy in the role of these novel motifs in controlling gene expression patterns.
RESULTS
Co-occurring Motif Pairs
We had previously established a database containing 356 known and putative regulatory motifs as well as all the promoters containing each motif (Pilpel et al. 2001). To identify motifs that occur together in a significantly large number of promoters, we calculated the co-occurrence rate (i.e., the number of promoters that contain both motifs), for all possible motif pairs in the database. We used a cumulative hypergeometric model to calculate the probability of obtaining the observed or higher rate of co-occurrence for each motif pair given the rate of occurrence of each single motif (see Methods).
Among the 37 well-characterized motifs in our database, 20 motifs are members of 13 motif pairs that co-occur in a significantly large number of promoters in the S. cerevisiae genome (Table 1A). Several motifs that control the transcription of genes involved in the cell cycle such as the motifs for Mcm1, SFF, MCB, SCB, and ECB co-occur significantly with each other. Our data reveal that Mcm1 co-occurs significantly with three cell-cycle motifs (Table 1A). The Mcm1 motif is known to be involved in combinatorial transcription as its function is modulated by the transcriptional activators or repressors that bind adjacent to it (Shore and Sharrocks 1995). Thus, our analysis predicts a novel set of functional partners for the Mcm1 motif. Among these motif pairs, Mcm1-ECB co-occurs most significantly (Table 1A). We noticed that the two motifs have a high degree of sequence similarity (CompareACE score = 0.83 [Hughes et al. 2000]), which agrees with the observation that the ECB motif contains an Mcm1 binding site (McInerny et al. 1997). The ECB-containing promoters constitute a subset of Mcm1-dependent promoters (Mai et al. 2002). While Mcm1 is important for the transcription of genes involved in diverse pathways such as pheromone response and replication (Shore and Sharrocks 1995), the ECB box is necessary for the transcription of genes at the M/G1 boundary of the cell cycle (Mai et al. 2002). Thus, the ECB motif seems to be a variant of Mcm1-dependent sites. To assess the level of co-occurrence accurately, we had to eliminate promoters where both motifs map to the same site. Thus, co-occurrence statistics were applied solely to promoters where the two motifs were separated by a distance of 10 bp or more. The motifs co-occur significantly in the 45 promoters satisfying this criterion (Table 1) suggesting that the transcriptional regulation of downstream genes may require multiple Mcm1-containing sites.
Among the other well-characterized motifs, Abf1 and Rpn4 co-occur significantly in the S. cerevisiae genome. These results are consistent with previous evidence that the two factors are involved in the nuclear excision repair response (Jelinsky et al. 2000). In addition, we have recently shown that genes containing binding sites for the two factors have highly similar expression profiles compared to genes containing each individual motif (Pilpel et al. 2001).
Combinatorial Control of the Expression of rRNA Transcription and Processing Genes
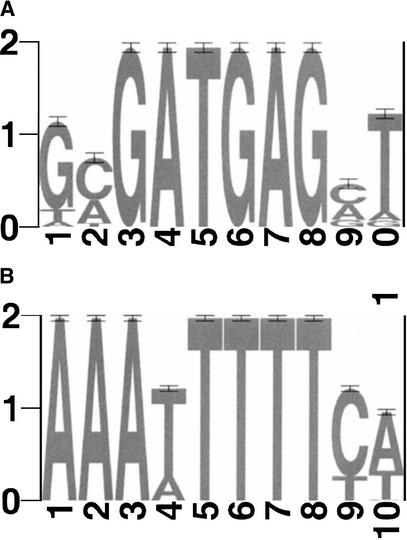
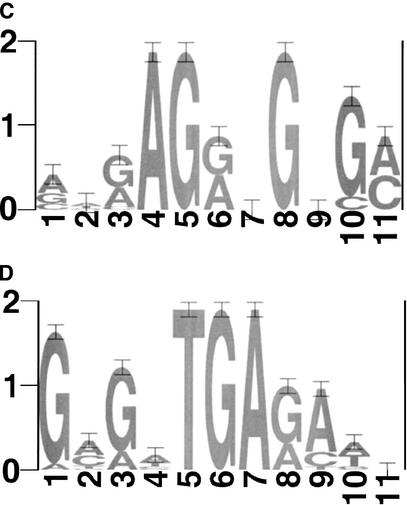
The motif pairs with the most significant rates of co-occurrence in S. cerevisiae involve novel regulatory motifs (Table 1B). We focused on a particularly interesting set of four motifs (mRRPE, PAC, mRRSE3, and mRRSE10) (Fig. 1). These motifs had been previously identified by running the motif-finding algorithm, AlignACE (Hughes et al. 2000) on the genes in the rRNA processing, transcription, and synthesis functional categories in the MIPS database (Mewes et al. 2000) and by analyzing gene expression clusters (Tavazoie et al. 1999; Gasch et al. 2000). mRRPE-PAC is the most highly co-occurring motif pair in the genome (Table 1B), occurring together in 79 promoters upstream of 121 genes (includes divergently transcribed genes). This rate of co-occurrence is highly significant as, given the individual rates of occurrence of PAC (253 promoters) and mRRPE (276 promoters) each, the probability that the observed or higher rate of co-occurrence may be obtained by chance is 10−38. Other motif pairs in this set, notably mRRSE3-PAC (P = 10−32), mRRPE-mRRSE3 (P = 10−11), and mRRSE10-PAC (P = 10−8) also co-occur significantly (Table 1B).
Figure 1.
Sequence logos for (A) PAC, (B) mRRPE, (C) mRRSE10, and (D) mRRSE10, produced with the World Wide Web service at http://www.bio.cam.ac.uk/cgi-bin/seqlogo/logo.cgi. The height of each letter is proportional to its frequency of occurrence in the binding site matrix times the information content at each position.
We noticed that mRRPE and PAC tend to co-occur in the promoters of genes involved in rRNA-related activities. Genes containing both motifs or either motif alone were analyzed for enrichment for the rRNA transcription functional category using published methods (Hughes et al. 2000; Jensen and Knudsen 2000). Genes containing PAC alone or mRRPE alone show poor enrichment for this functional category whereas genes containing both motifs are highly enriched rRNA-transcription genes (Table 1C). The functional bias in mRRPE-PAC co-occurrence suggests that this motif pair has a role in regulating genes involved in rRNA transcription. In addition, our results suggest a way to annotate the function of other genes that have the two motifs in their promoters.
Our earlier studies on combinatorial transcription suggested that mRRPE and PAC control gene expression patterns (Pilpel et al. 2001). Given the co-occurrence of mRRPE-PAC in genes involved in rRNA transcription, we wanted to investigate the role of mRRPE-PAC in regulating the expression of these genes (Table 2). We calculated the expression coherence scores of rRNA-related genes containing each motif alone, both motifs, or neither motif in several microarray experiments including the cell cycle (Cho et al. 1998), sporulation (Chu et al. 1998), diauxic shift (DeRisi et al. 1997), pheromone response (Roberts et al. 2000), and treatment with DNA-damaging agents (Jelinsky et al. 2000) (Table 2). The expression coherence score measures the overall similarity between the expression profiles of genes containing a particular motif or motif pair in their promoters (Pilpel et al. 2001). rRNA-related genes containing both mRRPE and PAC are significantly more coherent than genes containing each motif alone in all the conditions studied, with the exception of sporulation, suggesting that the mRRPE-PAC combination is important for the particular expression patterns observed in these experiments. During sporulation, genes containing mRRPE alone show good expression coherence as compared to genes containing both motifs. These results suggest that mRRPE plays a significant role in controlling expression profiles while the addition of PAC results in a small increase in expression coherence. Finally, rRNA transcription genes lacking both motifs show poor expression coherence in all the datasets indicating that not all these genes have high expression coherence in these conditions (Table 2). These results suggest that the high coherence of rRNA-related genes containing mRRPE-PAC may be ascribed to the presence of these motifs in their promoters. Thus, the high rate of co-occurrence of mRRPE and PAC in genes involved in rRNA transcription and processing seems to have functional consequences on gene expression in several diverse conditions.
Table 2.
Expression Coherence* of rRNA Transcription Genes Containing mRRPE and PAC in Their Promoters in Different Microarray Experiments
| Number of genes | Cell cycle | Sporulation | Diauxic shift | Pheromone response | DNA damage | |
|---|---|---|---|---|---|---|
| PAC alone | 18 | 0.05 | 0.09 | 0.11 | 0.16 | 0.14 |
| mRRPE alone | 15 | 0.09 | 0.22 | 0.19 | 0.09 | 0.24 |
| mRRPE-PAC | 20 | 0.25 | 0.29 | 0.43 | 0.31 | 0.35 |
| None** | 43 | 0.05 | 0.06 | 0.07 | 0.05 | 0.15 |
A description of the expression coherence score is presented in Pilpel et al. (2001).
rRNA transcription genes that do not contain mRRPE or PAC in their promoters.
Physical Arrangement of mRRPE-PAC Affects Gene Expression
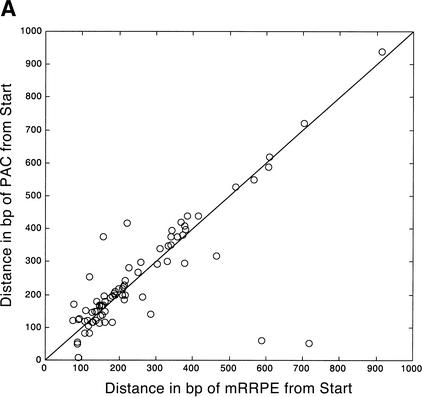
To explore the physical parameters governing the co-occurrence of mRRPE-PAC, we analyzed the distance of mRRPE and PAC from the translational start site (ATG) in promoters containing a single copy of each motif (Fig. 2A). Like many motifs in S. cerevisiae, both mRRPE and PAC are found within 100–200 bp from the ATG in most promoters containing the two motifs (Tavazoie et al. 1999). Therefore, it is not surprising that the two motifs are found close to each other within 200 bp from the ATG. However, mRRPE and PAC tend to occur next to each other even when they lie further away from the ATG (Fig. 2A). The two motifs are found within 50 bp of each other in 63 of the 79 promoters containing single copies of mRRPE and PAC. This tendency for the two motifs to be close to each other is highly significant (P<.0001; see Methods) given their individual preferred locations relative to the ATG. Such preferences may be important for their regulation of downstream genes.
Figure 2.
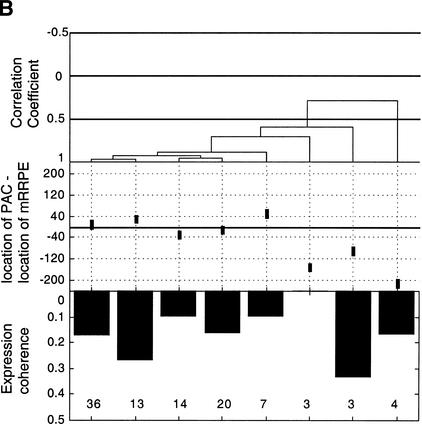
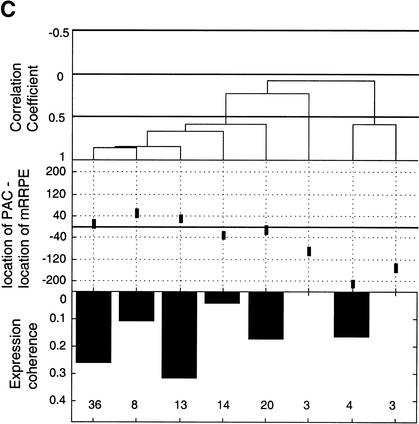
Position vs. expression coherence and expression profile similarity. (A) Scatter plot showing the positional and orientational bias in mRRPE and polymerase A and C (PAC) co-occurring pairs. All distances of mRRPE and PAC are relative to the translational start site (ATG). Most of the points fall near the diagonal indicating that mRRPE and PAC are in close proximity within promoters. The orientational bias is demonstrated by points that fall above the diagonal indicating that mRRPE is closer to the ATG. (B, C) Modified Combinogram of the sporulation (B) and DNA damage (B) datasets analyzing the expression coherence and similarity of genes containing mRRPE and polymerase A and C (PAC) at different relative positions and orientations in their promoters. The middle section shows the range of distances between the mRRPE and PAC sites in 20-bp increments. Each vertical column represents a single gene set containing mRRPE and PAC within a particular distance range and orientation. The distances were generated by subtracting the distance of PAC from the ATG in b.p. from the distance of mRRPE from the ATG in b.p. Thus, positive differences indicate that mRRPE is closer to the ATG and negative differences indicate that PAC is closer. The top section of the figure shows the dendrogram analysis that assesses the similarity in expression profiles of each gene set using Pearson correlation coefficients (C.C.) between the average expression profile of the genes in the set as a measure of distance. The bottom section of the graph shows the expression coherence scores for each gene set. The numbers at the bottom of the expression coherence bars indicate the number of genes containing the motifs in the given distance range.
In addition to a bias in the distance between mRRPE and PAC, we have previously noted that mRRPE-PAC show an orientation bias, that is, mRRPE is closer to the translational start site (ATG) than PAC in a significant number of promoters (Pilpel et al. 2001). To investigate if the preference for particular positions and orientations influences the function of mRRPE-PAC, we used the Combinogram workbench (Pilpel et al. 2001) to analyze the effect of different locations and orientations of mRRPE-PAC on the expression of downstream genes in different conditions (Fig. 2B,C). The Combinogram workbench is a set of computational tools for assessing the effect of each motif in a combination on the expression of genes containing a defined set of motifs (see legend for Fig. 2 and Pilpel et al. [2001] for detailed descriptions of Combinograms). The Combinogram was modified to analyze genes containing mRRPE-PAC at particular distances and orientations. The set of genes containing mRRPE-PAC in their promoters was grouped based on the distance between the two motifs (in increments of 20 bp) and the orientation of the motif pair. The expression coherence as well as the similarity between the average expression profile of each group was evaluated. Figure 2B shows that, during sporulation, regardless of the orientation of mRRPE-PAC, genes containing mRRPE and PAC within 40 bp of each other have a high degree of expression coherence (>0.1). In addition, the level of expression coherence increases as the distance between the two motifs decreases suggesting that mRRPE-PAC exert greater control over the pattern of expression when in close proximity to each other.
The dendrogram section of the modified Combinogram (Fig. 2B) also reveals that genes containing mRRPE-PAC at short distances from each other have very similar expression patterns. Genes in the first five sets of the modified Combinogram have both mRRPE and PAC within 60 bp of each other. Irrespective of the orientation of the motif pair, the average expression profiles of these gene sets are very similar and cluster together in the same branch of the dendrogram (Fig. 2B). Among these five sets, there is some additional grouping of expression profiles that correlates with the orientation of mRRPE-PAC, as the genes containing mRRPE closer to the ATG are clustered together (the first two gene sets from the left). However, the expression profiles of all five sets are so similar that this additional clustering may not be significant.
The effect of different orientations of mRRPE-PAC on expression profiles can be seen in the modified Combinogram analysis of the DNA damage dataset (Jelinsky et al. 2000). Genes containing mRRPE closer to the ATG cluster together (the first three gene sets from the left) suggesting that this orientation of mRRPE-PAC is important for determining the particular expression pattern (Fig. 2C). The distance between mRRPE and PAC seems to have little effect on expression profiles in this condition. Thus, the positional and orientational biases in mRRPE-PAC locations affect the pattern of gene expression of downstream genes though the degree to which they influence transcription varies according to the condition.
Regulatory Cassettes of rRNA-Related Motifs
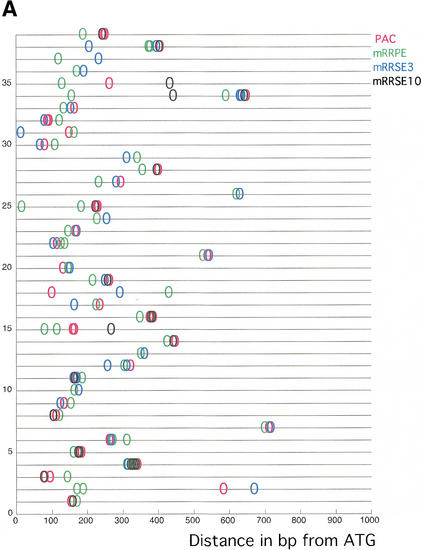
Two additional motifs, mRRSE3 and mRRSE10, show significantly high levels of pair-wise co-occurrence with mRRPE and PAC (Table 1B). These two motifs were also derived from an rRNA-related functional category, specifically the category consisting of genes involved in rRNA synthesis (Hughes et al. 2000). Because all four motifs were derived from the promoters of similar sets of genes, it is expected that the motifs may co-occur in combinations containing more than two motifs. Thirty-nine promoters contain copies of all four motifs or the motif triplet consisting of both mRRPE and PAC and either mRRSE3 or mRRSE10. Consistent with the previous results with mRRPE-PAC, all copies of the rRNA-related motifs are found in close proximity to each other in most of the 39 promoters (Fig. 3A). In 25 of the 39 promoters, all copies of the above motif combinations occur within a window of 50 bp. This is highly significant (P<.001; see Methods) and suggests that mRRPE, PAC, mRRSE3, and mRRSE10 may work together to regulate the expression of downstream genes. In addition, in 19 of the 39 promoters containing the cassette, mRRPE is closest to the ATG. The above positional and orientational biases suggest that the putative factors binding to these sites may physically interact and that the particular orientation of mRRPE within this set may be important for the function of this putative regulatory cassette.
Figure 3.
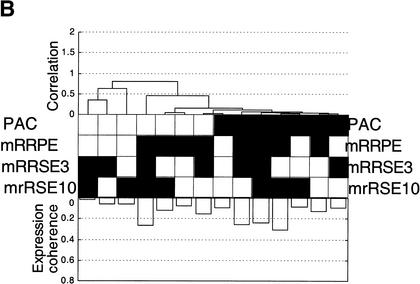
(A) The physical arrangement of four rRNA-related motifs: rRNA processing element (mRRPE), polymerase A and C (PAC), mRRSE3, and mRRSE10. The 39 promoters containing all four sites or the motif triplet consisting of mRRPE, PAC, and either mRRSE3 or mRRSE10 are displayed. Each promoter is represented by a line and each circle represents a single copy of each motif. The distance of each motif in b.p. from the translational start site is displayed by the axis at the bottom of the figure. (B) Combinogram of the rRNA motif cassette during sporulation. The middle section of the Combinogram depicts the motif composition of each gene set. Each vertical column represents a single gene set. A black square indicates that the particular motif is present in the promoters of all the genes in that set. A white square indicates that none of the genes in the set contain the particular motif. The top and bottom sections of the Combinogram are as described in the legend for Figure 2B. All the genes in the genome containing each motif combination in their promoters were included in the Combinogram.
As mRRPE and PAC have been implicated in controlling gene expression, we wanted to study the influence of mRRSE3 and mRRSE10 on the expression patterns of genes containing all possible combinations of the four rRNA-related motifs. The Combinogram workbench (Pilpel et al. 2001) was used to analyze the effect of the rRNA motifs on gene expression during sporulation (Fig. 3B). The expression coherence of genes defined by each motif combination as well as the similarity between the expression patterns of each gene set was measured. While gene sets defined by each motif pair, with the exception of mRRSE3-mRRSE10, show relatively good expression coherence, any combination of three motifs or the quadruplet set has high levels of expression coherence. Thus, the presence of each additional motif results in an increasingly well-defined gene expression pattern.
The dendrogram section of the Combinogram (Fig. 3B) reveals that PAC-containing genes cluster together suggesting that PAC may be the primary determinant for that particular expression pattern. The fact that the set of genes containing PAC alone is also a member of this cluster suggests that PAC is sufficient for conferring this pattern. Gene sets containing mRRPE motif combinations but lacking PAC form a less well-defined cluster indicating that mRRPE can also influence the gene expression profiles. The additional presence of mRRSE3 and mRRSE10 in promoters containing mRRPE and/or PAC enhances the expression coherence but has a relatively minor effect on the average expression of each set (Fig. 3B). Thus, mRRPE and especially PAC seem to be the most important motifs in this putative regulatory cassette for defining expression patterns while mRRSE3 and mRRSE10 appear to fine-tune the particular profile.
DISCUSSION
Studies have established that transcriptional regulation, particularly in higher eukaryotes, is carried out through promoter modules. While these modules are usually relatively small (spanning a few hundred base pairs), they contain a high density of cis-regulatory sites for multiple transcription factors suggesting cooperative interactions between the factors (Arnone and Davidson 1997). Thus, several studies have searched more complex eukaryotic genomes for high densities of cis-regulatory sites in an effort to identify putative promoter modules (Lavorgna et al. 1998; Wasserman and Fickett 1998; Berman et al. 2002; Halfon et al. 2002; Markstein et al. 2002). Some recent studies have also used gene expression data to confirm their computational predictions (Berman et al. 2002; Halfon et al. 2002; Markstein et al. 2002).
Unlike the situation in higher eukaryotes, very few studies have addressed the combinatorial aspect of transcriptional regulation in S. cerevisiae. While there have been some genome-wide analyses of motif combinations using other strategies (Bussemaker et al. 2001; Pilpel et al. 2001), only a limited number of studies have searched for coclustering of transcription-factor binding sites. These studies have focused on a small number of known transcription factors and have been conducted either on small sets of coregulated genes (GuhaThakurta and Stormo 2001) or on the entire genome (using the Mcm1-Ste12 pair) (Wagner 1997, 1999).We have used a similar though simpler strategy to do an extensive genome-wide analysis on a large set of cis-regulatory motifs, including known as well as putative motifs, to identify those combinations that co-occur in a significantly high number of promoters. We focused on identifying heterotypic combinations as only a few such combinations are known in S. cerevisiae. However, it is clear that homotypic interactions are equally important in transcriptional regulation (Arnone and Davidson 1997). Our results with the closely related Mcm1 and ECB sites (Table 1A) also suggest that similar sites can co-occur in a significantly high number of promoters. More extensive analysis of such homotypic motif pairs is being carried out in our laboratory to see if they have significant effects on expression coherence and are biologically relevant.
The search for significant co-occurrence may also miss motif combinations that control the expression of small networks including some of the well-known motif combinations in S. cerevisiae. However, it should be useful for identifying motif combinations that control the expression of large networks, that is, large groups of genes whose expression has to be coregulated in response to environmental or cellular changes. For example, combinations controlling the expression of genes involved in the assembly of large complexes such as the ribosome (e.g., mRRPE-PAC) may be identified by this method.
We have identified several new motif combinations that co-occur significantly in S. cerevisiae including combinations involving four rRNA-related motifs (mRRPE, PAC, mRRSE3, and mRRSE10). While these motifs are not well characterized, our studies suggest that mRRPE-PAC regulate the expression of genes involved in rRNA transcription and processing. It may seem surprising that genes containing either PAC or mRRPE alone (Table 1C) show low functional enrichment for rRNA-transcription genes as both PAC and mRRPE were derived from rRNA-related functional groups (Hughes et al. 2000). However, previous studies of functional enrichment for rRNA-related categories (Hughes et al. 2000) were performed on gene sets containing PAC without specifically excluding mRRPE and vice versa. Given the high degree of co-occurrence between these motifs especially in rRNA-transcription genes, it is highly likely that those gene sets contained the other motif as well. Thus, our results suggest that studying the functional enrichment of mRRPE and PAC for rRNA-related functional categories is not circular. Our functional enrichment results are consistent with data from the Function Junction server at Stanford, which provides annotation for open reading frames (ORFs) using a variety of in silico and experimental data (P. Sudarsanam, Y. Pilpel, and G.M. Church, unpubl. observations). Besides uncovering the role of these novel motifs in transcriptional regulation, our results are consistent with previous mammalian studies (Fessele et al. 2002) suggesting that analyzing motif combinations may be useful in annotating the function of genes containing a particular set of motifs in their promoters.
In addition to identifying genes under the control of mRRPE-PAC, our studies have also provided insight into the mechanism of gene regulation by the four rRNA motifs, mRRPE, PAC, mRRSE3, and mRRSE10. All four rRNA-related motifs lie in close proximity to each other and mRRPE-PAC, in particular, shows significant orientational bias. Our analyses suggest that the factors binding these sites have the potential for close physical as well as functional interactions and that such interactions are important for the expression of downstream genes. Our results are consistent with experimental studies in S. cerevisiae that demonstrate that changing the spacing between transcription factor binding sites abolishes their synergistic effect on gene expression, for example, Gcr1-Rap1 (Lopez et al. 1998) and Mcm1-alpha1 (Inokuchi and Nakayama 1991). Through computational analysis of more complex eukaryotic promoters, similar constraints have been discovered on the relative distance and orientation of binding sites in sets of coregulated genes (Kel et al. 1999; Fessele et al. 2002). Thus, our results provide strong predictions for future experiments studying the effect of changes in spacing between these sites (e.g., if both motifs are found on the same or opposite face of the DNA helix on gene expression).
Given the availability of genome sequence and high-throughput technologies for studying cellular mechanisms, analyzing genome-wide combinatorial transcription is now extremely feasible. This study integrates in silico genome analyses with experimental microarray data to provide several predictions worthy of further experimental verification. Such methods should be extremely useful in more complex eukaryotes where combinatorial transcriptional regulation is the norm.
METHODS
A Dataset of Known and Putative Yeast Regulatory Motifs
Three hundred fifty-six DNA motifs, including 37 known motifs, were used in this analysis. The methods used for selecting the motifs and assigning them to promoters have been described earlier (Pilpel et al. 2001). All the motif alignments as well as the files containing the promoter assignments are available at http://genetics.med.harvard.edu/∼tpilpel/MotCoOc/MotCoOc.html.
Statistics of Motif Co-occurrence
The cumulative hypergeometric distribution has been previously used to assess the functional significance of computationally derived motifs (Hughes et al. 2000; Jensen and Knudsen 2000). To assess the statistical significance of the rate of co-occurrence of pairs of motifs, we used the cumulative hypergeometric distribution to calculate the probability of obtaining a rate of co-occurrence, C, equal to or higher than the observed rate of co-occurrence, c‘, by chance:
 |
where m1 and m2 are the number of promoters containing each of the two motifs, N is the total number of promoters in the genome (4483 in S. cerevisiae), and i is the summation index.
A motif pair was considered to co-occur significantly if the hypergeometric P-value was less than the reciprocal of the total number of motif pairs tested, that is, if P(C>c‘)<1/MP, where MP is the total number of motif pairs tested in this analysis, that is, 356*355*0.5 = 63,190. In the special case of calculating the co-occurrence rates among known motifs, the co-occurrence rate of a motif pair was considered significantly high if P(C>c‘)<1/KMP, where KMP is the total number of known motif pairs tested in this analysis, that is, 37*36*0.5 = 666. The sequence of motifs in each significantly co-occurring motif pair were also compared to ensure that they were not similar to each other (CompareACE score <0.5 on a scale from −1 to 1 [Hughes et al. 2000]) as similar motifs may have high co-occurrence rates.
Combinogram Analyses
Detailed descriptions of Combinograms are presented in Pilpel et. (2001).
Determining the Significance of the Positions of mRRPE-PAC and the Quadruplet rRNA Motif Cassette
The following method was used to test if the observation that the rRNA motifs lie close to each other is more significant than their tendency to occur at similar distances from the start site (as S. cerevisiae motifs usually occur within 100–200 bp of the ATG). We observed that mRRPE and PAC are found within 50 bp of each other in 63 out of the 79 promoters containing single copies of each motif. Further, in promoters containing all four rRNA-related motifs or the motif triplet consisting of mRRPE, PAC, and either mRRSE3 or mRRSE10, the rRNA motifs are found within 50 bp of each other in 25 out of 39 promoters. Given the total number of promoters containing each motif, N, the number of promoters where the sites are found within 50 bp of each other is defined as P. One copy of each motif was picked at random (to generate a motif pair or triplet as described above) from the set of N promoters to generate an artificial promoter. The position of the motifs relative to each other was noted. The procedure was repeated N times to generate N artificial promoters containing the motifs. The number of promoters, M, (out of a total of these N promoters) in which the motifs occur within a 50-bp window was calculated. The entire selection procedure was repeated 10,000 times. The shuffling procedure was performed separately for the promoter sets containing the mRRPE-PAC motif pair as well as the set containing the four rRNA motifs. We checked if the actual number of promoters containing the motifs within a 50-bp window was higher than the maximal number obtained in the 10,000 randomizations. In such cases, a lower bound on the significance of the hypothesis that the motifs show a tendency to occur in close proximity (unexplained by a preference for a given distance from the ATG) can be estimated as 1/10,000.
WEB SITE REFERENCES
http://genetics.med.harvard.edu/∼tpilpel/MotCoOc/MotCoOc.html; site contains all the motif data analyzed in this paper.
http://www.bio.cam.ac.uk/cgi-bin/seqlogo/logo.cgi; generates Sequence logos automatically for input multiple alignments.
Table 1A.
Co-occurrence of Well-Characterized cis-Regulatory Motifs
| Motif1 | Motif2 | P-value |
|---|---|---|
| Matalpha1 | Matalpha2 | 1.7E-17** |
| STRE | Mig1 | 1.3E-12** |
| Rpn4 | Abf1 | 2.5E-07** |
| Pdr | Gal4 | 2.0E-04 |
| Gcn4 | Leu3 | 3.2E-04 |
| Mcm1* | ECB* | 3.3E-04 |
| Bas1 | CSRE | 6.5E-04 |
| Mcm1 | SCB | 7.9E-04 |
| Rpn4 | Ume6 | 8.0E-04 |
| SFF | SCB | 1.3E-03 |
| Mcm1 | MCB | 1.4E-03 |
| STRE | CSRE | 1.4E-03 |
Only those promoters containing the Mcm1 and ECB motifs separated by a distance of 8 bp or more were considered.
Pairs having P-value < 7.50e-05 (i.e., 0.05/666), a corrected P-value that may be taken if a false-positive rate of 0.05 is assumed.
Table 1B.
Co-occurrence of Novel cis-Regulatory Motifs
| Motif1* | Motif2* | P-value |
|---|---|---|
| PAC | mRRPE | 3.7E-38** |
| PAC | mRRSE3 | 7.7E-32** |
| mCDE22 | mPTE18 | 8.5E-27** |
| mMERE8 | mMERE4 | 4.2E-23** |
| mGCE11 | mPTE18 | 2.6E-21** |
| mMERE8 | mRLFIBE12 | 5.1E-21** |
| mRLFIBE12 | mCDE22 | 6.0E-20** |
| mPOE3 | OAF1 | 1.2E-19** |
| mOTFE10 | mNSME29 | 4.2E-19** |
| mMERE8 | mITE11 | 2.2E-18** |
| mRRPE | mRRSE3 | 2.6E-11** |
| PAC | mRRSE10 | 8.5E-08** |
Names of motifs begin with ‘m’ to indicate that they were derived by running AlignACE (Hughes et al. 2000) on the genes from the following functional categories in the MIPS database: mRRPE, rRNA processing element; mRRSE, rRNA synthesis element; mCDE, cell death element; mPTE, phosphate transport element; mRLFIBE, regulation of lipid fatty acid and isoprenoid biosynthesis element; mPOE, peroxisomal organization element; mOTFE, other transport facilitators element; mNSME, nitrogen and sulfur metabolism element; mITE, ion transporters element.
Pairs having P-value < 7.9E-07 (i.e., 0.05/63190), a corrected P-value that may be taken if a false positive rate of 0.05 is assumed.
Table 1C.
Functional Enrichment of rRNA Transcription Genes Containing Only PAC, or Only mRRPE, or Both Motifs
| PAC & mRRPE | PAC but not mRRPE | MRRPE but not PAC | |
|---|---|---|---|
| Number of genes in the genome | 121 | 246 | 261 |
| Number of rRNA transcription genes | 21 | 18 | 13 |
| P-value | 7.7E-13 | 1.4E-2 | 3.3E-05 |
The functional enrichment score, reported as a P-value, was calculated as a cumulative hypergeometric distribution (Hughes et al. 2000; Jensen and Knudsen 2000) given 3560 functionally annotated genes in the genome. We considered genes containing both PAC and mRRPE in their promoters, genes containing PAC but not mRRPE, and genes containing mRRPE but not PAC. The first row of Table 1C shows the number of genes in the genome in each set. The second row indicates the number of genes out of the total number shown in the first row that overlap with the 91 annotated rRNA transcription-related genes.
Acknowledgments
We are grateful to our anonymous reviewers for bringing relevant publications to our attention. We thank Jason Hughes for providing most of the motifs used in the present analysis and Uri Keich for assistance with the statistical analyses. We are grateful to John Aach, Barak Cohen, Aimee Dudley, Rob Mitra, and Fritz Roth for advice and suggestions. Y.P. was a scholar of the Fulbright program. We are grateful to the DOE, NSF, and the Lipper Foundation for grant support.
The publication costs of this article were defrayed in part by payment of page charges. This article must therefore be hereby marked “advertisement” in accordance with 18 USC section 1734 solely to indicate this fact.
Footnotes
E-MAIL church@arep.med.harvard.edu; FAX (617) 432-7266
Article and publication are at http://www.genome.org/cgi/doi/10.1101/gr.301202.
REFERENCES
- Arnone MI, Davidson EH. The hardwiring of development: Organization and function of genomic regulatory systems. Development. 1997;124:1851–1864. doi: 10.1242/dev.124.10.1851. [DOI] [PubMed] [Google Scholar]
- Berman BP, Nibu Y, Pfeiffer BD, Tomancak P, Celniker SE, Levine M, Rubin GM, Eisen MB. Exploiting transcription factor binding site clustering to identify cis-regulatory modules involved in pattern formation in the Drosophila genome. Proc Natl Acad Sci. 2002;99:757–762. doi: 10.1073/pnas.231608898. [DOI] [PMC free article] [PubMed] [Google Scholar]
- Bussemaker HJ, Li H, Siggia ED. Regulatory element detection using correlation with expression. Nat Genet. 2001;27:167–171. doi: 10.1038/84792. [DOI] [PubMed] [Google Scholar]
- Cho RJ, Campbell MJ, Winzeler EA, Steinmetz L, Conway A, Wodicka L, Wolfsberg TG, Gabrielian AE, Landsman D, Lockhart DJ, et al. A genome-wide transcriptional analysis of the mitotic cell cycle. Mol Cell. 1998;2:65–73. doi: 10.1016/s1097-2765(00)80114-8. [DOI] [PubMed] [Google Scholar]
- Chu S, DeRisi J, Eisen M, Mulholland J, Botstein D, Brown PO, Herskowitz I. The transcriptional program of sporulation in budding yeast. Science. 1998;282:699–705. doi: 10.1126/science.282.5389.699. [DOI] [PubMed] [Google Scholar]
- Dequard-Chablat M, Riva M, Carles C, Sentenac A. RPC19, the gene for a subunit common to yeast RNA polymerases A (I) and C (III) J Biol Chem. 1991;266:15300–15307. [PubMed] [Google Scholar]
- DeRisi JL, Iyer VR, Brown PO. Exploring the metabolic and genetic control of gene expression on a genomic scale. Science. 1997;278:680–686. doi: 10.1126/science.278.5338.680. [DOI] [PubMed] [Google Scholar]
- Fessele S, Maier H, Zischek C, Nelson PJ, Werner T. Regulatory context is a crucial part of gene function. Trends Genet. 2002;18:60–63. doi: 10.1016/s0168-9525(02)02591-x. [DOI] [PubMed] [Google Scholar]
- Frith MC, Hansen U, Weng Z. Detection of cis-element clusters in higher eukaryotic DNA. Bioinformatics. 2001;17:878–889. doi: 10.1093/bioinformatics/17.10.878. [DOI] [PubMed] [Google Scholar]
- Gasch AP, Spellman PT, Kao CM, Carmel-Harel O, Eisen MB, Storz G, Botstein D, Brown PO. Genomic expression programs in the response of yeast cells to environmental changes. Mol Biol Cell. 2000;11:4241–4257. doi: 10.1091/mbc.11.12.4241. [DOI] [PMC free article] [PubMed] [Google Scholar]
- GuhaThakurta D, Stormo GD. Identifying target sites for cooperatively binding factors. Bioinformatics. 2001;17:608–621. doi: 10.1093/bioinformatics/17.7.608. [DOI] [PubMed] [Google Scholar]
- Halfon MS, Grad Y, Church GM, Michelson AM. Computation-based discovery of related transcriptional regulatory modules and motifs using an experimentally validated combinatorial model. Genome Res. 2002;12:1019–1028. doi: 10.1101/gr.228902. [DOI] [PMC free article] [PubMed] [Google Scholar]
- Hughes JD, Estep PW, Tavazoie S, Church GM. Computational identification of cis-regulatory elements associated with groups of functionally related genes in Saccharomyces cerevisiae. J Mol Biol. 2000;296:1205–1214. doi: 10.1006/jmbi.2000.3519. [DOI] [PubMed] [Google Scholar]
- Inokuchi K, Nakayama A. Lack of a requirement for strict rotational alignment among transcription factor binding sites in yeast. Nucleic Acids Res. 1991;19:3099–3103. doi: 10.1093/nar/19.11.3099. [DOI] [PMC free article] [PubMed] [Google Scholar]
- Jelinsky SA, Estep P, Church GM, Samson LD. Regulatory networks revealed by transcriptional profiling of damaged Saccharomyces cerevisiae cells: Rpn4 links base excision repair with proteasomes. Mol Cell Biol. 2000;20:8157–8167. doi: 10.1128/mcb.20.21.8157-8167.2000. [DOI] [PMC free article] [PubMed] [Google Scholar]
- Jensen LJ, Knudsen S. Automatic discovery of regulatory patterns in promoter regions based on whole cell expression data and functional annotation. Bioinformatics. 2000;16:326–333. doi: 10.1093/bioinformatics/16.4.326. [DOI] [PubMed] [Google Scholar]
- Kel A, Kel-Margoulis O, Babenko V, Wingender E. Recognition of NFATp/AP-1 composite elements within genes induced upon the activation of immune cells. J Mol Biol. 1999;288:353–376. doi: 10.1006/jmbi.1999.2684. [DOI] [PubMed] [Google Scholar]
- Kel OV, Romaschenko AG, Kel AE, Wingender E, Kolchanov NA. A compilation of composite regulatory elements affecting gene transcription in vertebrates. Nucleic Acids Res. 1995;23:4097–4103. doi: 10.1093/nar/23.20.4097. [DOI] [PMC free article] [PubMed] [Google Scholar]
- Lavorgna G, Boncinelli E, Wagner A, Werner T. Detection of potential target genes in silico? Trends Genet. 1998;14:375–376. doi: 10.1016/s0168-9525(98)01551-0. [DOI] [PubMed] [Google Scholar]
- Lopez MC, Smerage JB, Baker HV. Multiple domains of repressor activator protein 1 contribute to facilitated binding of glycolysis regulatory protein 1. Proc Natl Acad Sci. 1998;95:14112–14117. doi: 10.1073/pnas.95.24.14112. [DOI] [PMC free article] [PubMed] [Google Scholar]
- Mai B, Miles S, Breeden LL. Characterization of the ECB binding complex responsible for the M/G(1)-specific transcription of CLN3 and SWI4. Mol Cell Biol. 2002;22:430–441. doi: 10.1128/MCB.22.2.430-441.2002. [DOI] [PMC free article] [PubMed] [Google Scholar]
- Markstein M, Markstein P, Markstein V, Levine MS. Genome-wide analysis of clustered dorsal binding sites identifies putative target genes in the Drosophila embryo. Proc Natl Acad Sci. 2002;99:763–768. doi: 10.1073/pnas.012591199. [DOI] [PMC free article] [PubMed] [Google Scholar]
- McInerny CJ, Partridge JF, Mikesell GE, Creemer DP, Breeden LL. A novel Mcm1-dependent element in the SWI4, CLN3, CDC6, and CDC47 promoters activates M/G1-specific transcription. Genes Dev. 1997;11:1277–1288. doi: 10.1101/gad.11.10.1277. [DOI] [PubMed] [Google Scholar]
- Mewes HW, Frishman D, Gruber C, Geier B, Haase D, Kaps A, Lemcke K, Mannhaupt G, Pfeiffer F, Schuller C, et al. MIPS: A database for genomes and protein sequences. Nucleic Acids Res. 2000;28:37–40. doi: 10.1093/nar/28.1.37. [DOI] [PMC free article] [PubMed] [Google Scholar]
- Pilpel Y, Sudarsanam P, Church GM. Identifying regulatory networks by combinatorial analysis of promoter elements. Nat Genet. 2001;29:153–159. doi: 10.1038/ng724. [DOI] [PubMed] [Google Scholar]
- Quandt K, Grote K, Werner T. GenomeInspector: Basic software tools for analysis of spatial correlations between genomic structures within megabase sequences. Genomics. 1996;33:301–304. doi: 10.1006/geno.1996.0197. [DOI] [PubMed] [Google Scholar]
- Roberts CJ, Nelson B, Marton MJ, Stoughton R, Meyer MR, Bennett HA, He YD, Dai H, Walker WL, Hughes TR, et al. Signaling and circuitry of multiple MAPK pathways revealed by a matrix of global gene expression profiles. Science. 2000;287:873–880. doi: 10.1126/science.287.5454.873. [DOI] [PubMed] [Google Scholar]
- Sherlock G. Analysis of large-scale gene expression data. Curr Opin Immunol. 2000;12:201–205. doi: 10.1016/s0952-7915(99)00074-6. [DOI] [PubMed] [Google Scholar]
- Shore P, Sharrocks AD. The MADS-box family of transcription factors. Eur J Biochem. 1995;229:1–13. doi: 10.1111/j.1432-1033.1995.tb20430.x. [DOI] [PubMed] [Google Scholar]
- Spellman PT, Sherlock G, Zhang MQ, Iyer VR, Anders K, Eisen MB, Brown PO, Botstein D, Futcher B. Comprehensive identification of cell cycle-regulated genes of the yeast Saccharomyces cerevisiae by microarray hybridization. Mol Biol Cell. 1998;9:3273–3297. doi: 10.1091/mbc.9.12.3273. [DOI] [PMC free article] [PubMed] [Google Scholar]
- Tavazoie S, Hughes JD, Campbell MJ, Cho RJ, Church GM. Systematic determination of genetic network architecture. Nat Genet. 1999;22:281–285. doi: 10.1038/10343. [DOI] [PubMed] [Google Scholar]
- Wagner A. A computational genomics approach to the identification of gene networks. Nucleic Acids Res. 1997;25:3594–3604. doi: 10.1093/nar/25.18.3594. [DOI] [PMC free article] [PubMed] [Google Scholar]
- Wagner A. Genes regulated cooperatively by one or more transcription factors and their identification in whole eukaryotic genomes. Bioinformatics. 1999;15:776–784. doi: 10.1093/bioinformatics/15.10.776. [DOI] [PubMed] [Google Scholar]
- Wasserman WW, Fickett JW. Identification of regulatory regions which confer muscle-specific gene expression. J Mol Biol. 1998;278:167–181. doi: 10.1006/jmbi.1998.1700. [DOI] [PubMed] [Google Scholar]


