Abstract
Impaired survival signaling may represent a central mechanism in neurodegeneration. 6-Hydroxydopamine (6-OHDA) is an oxidative neurotoxin used to injure catecholaminergic cells of the central and peripheral nervous systems. Although 6-OHDA elicits phosphorylation of several kinases, downstream transcriptional effects that influence neuronal cell death are less defined. The cAMP response element (CRE) is present in the promoter sequences of several important neuronal survival factors. Treatment of catecholaminergic neuronal cell lines (B65 and SH-SY5Y) with 6-OHDA resulted in repression of basal CRE transactivation. Message levels of CRE-driven genes such as brain-derived neurotrophic factor and the survival factor Bcl-2 were decreased in 6-OHDA-treated cells, but message levels of genes lacking CRE sequences were not affected. Repression of CRE could be reversed by delayed treatment with cAMP several hours after initiation of 6-OHDA injury. Furthermore, restoration of CRE-driven transcription was associated with significant neuroprotection. In contrast to observations in other model systems, the mechanism of CRE repression did not involve decreased phosphorylation of its binding protein CREB. Instead, total CREB and phospho-CREB (pCREB) were increased in the cytoplasm and decreased in the nucleus of 6-OHDA-treated cells. 6-OHDA also decreased nuclear pCREB in dopaminergic neurons of primary mouse midbrain cultures. Co-treatment with cAMP promoted/restored nuclear localization of pCREB in both immortalized and primary culture systems. Increased cytoplasmic pCREB was observed in degenerating human Parkinson/Lewy body disease substantia nigra neurons but not in age-matched controls. Notably, cytoplasmic accumulation of activated upstream CREB kinases has been observed previously in both 6-OHDA-treated cells and degenerating human neurons, supporting a potential role for impaired nuclear import of phosphorylated signaling proteins.
Oxidative stress has been implicated in aging and a variety of pathological processes. In particular, oxidative mechanisms have been strongly linked to the pathogenesis of age-related neurodegenerative diseases (1). Neurons may be particularly susceptible to oxidants because of high metabolic activity and relatively low levels of endogenous antioxidants in the brain. Indeed, markers for lipid peroxidation and protein nitration are increased in affected brain areas in Alzheimer disease, Parkinson disease, and amyotrophic lateral sclerosis (2–4), and antioxidants provide protection in their respective animal and culture models (5–9). However, the mechanism(s) by which reactive oxygen species influence cell survival and death decisions are incompletely defined (10, 11). Given the progressive nature of neurodegenerative diseases, a better understanding of mechanisms that could impair adaptive responses to injury would be particularly pertinent.
6-Hydroxydopamine (6-OHDA)2 is a redox active analog of catecholamine neurotransmitters, which has been used to lesion the nigrostriatal system that degenerates in Parkinson and related diseases, to ablate the sympathetic nervous system, and as a chemotherapeutic agent for catecholaminergic neoplasms (12, 13). Spontaneous autoxidation of 6-OHDA results in production of reactive oxygen species such as hydrogen peroxide, superoxide and hydroxyl radical (14). 6-OHDA treatment elicits activation of several kinases including extracellular signal regulated protein kinases (ERK) (15, 16), glycogen synthase kinase-3β (17), and stress-activated kinases (18, 19). Both in vivo and in vitro studies implicate intracellular oxidative stress in 6-OHDA neurotoxicity (7, 20, 21), and only antioxidants that can affect intracellular reactive oxygen species act to inhibit 6-OHDA-mediated ERK activation (22). Although recent gene profiling studies indicate increases in both death-associated and neuroprotective genes (23), transcriptional mechanisms by which 6-OHDA modulates cell survival/death decisions remain incompletely defined.
Cyclic AMP response element-binding protein (CREB) is a transcription factor that plays an important role in neuronal survival, in part by controlling the transcription of neuroprotective genes (24). The promoter regions of the genes for brain-derived neurotrophic factor (BDNF) and the pro-survival protein Bcl-2 contain cAMP response elements (CREs) (25). Studies show that cAMP, a potent activator of CREB, acts as a trophic or protective signal for several populations of catecholaminergic neurons (Reviewed in Refs. 26 and 27). Additionally, cAMP has been shown to enhance the protective effects of noradrenaline (28) and glial cell line derived neurotrophic factor (29), further emphasizing the important role that the CREB pathway plays in controlling neuronal fate. Taken together, these results suggest that a loss of CREB function could contribute to neuronal dysfunction.
The potential role of the CREB pathway in neuronal cell responses to 6-hydroxydopamine was investigated in this study. The results indicate that suppression of CRE transactivation contributes to 6-OHDA-induced toxicity and that this loss of function is not due to decreased phosphorylation of CREB. Instead, phospho-CREB accumulates in the cytoplasm and is decreased in the nucleus of 6-OHDA-treated cells, and CRE-controlled genes such as BCL-2 and BDNF are down-regulated. Reversal of CRE repression by cAMP treatment confers significant protection from 6-OHDA toxicity, even when the cAMP is added 4 h after initiation of injury. These results demonstrate a transcriptional mechanism for oxidative stress-induced neurotoxicity with potential relevance to neurodegenerative mechanisms.
EXPERIMENTAL PROCEDURES
Cell Culture
B65 cells (ECACC 85042305) were the gift of Dr. David Schubert of the Salk Institute, La Jolla, CA. SH-SY5Y cells were purchased from ATCC (Manassas, VA). Cells were maintained in Dulbecco’s modified Eagle’s medium supplemented with 10% heat-inactivated fetal calf serum, 2 mM L-glutamine, and 10 mM HEPES. Low serum medium consisted of Dulbecco’s modified Eagle’s medium supplemented with 0.5% heat-inactivated fetal calf serum, 2 mM L-glutamine, and 10 mM HEPES. Cell culture reagents were purchased from BioWhittaker (Walkersville, MD) unless otherwise indicated. Cells were plated at a density of 3 × 10⁵ cells/well for 6-well plates, 1 × 10⁴ cells/well in 96-well plates, or 1 × 10⁶ cells/well in 100-mm dishes. For all experiments, cells were cultured in a humidified incubator with 5% CO2 at 37 °C.
Primary Midbrain Cultures
Primary midbrain neuronal cultures were derived from 15-day C57BL/6 mouse embryos as described previously (30). Glial proliferation was inhibited using cytosine arabinoside (2 μM), and cultures were treated at 7 days in vitro with 50 μM 6-OHDA, which kills 50–65% of midbrain TH+ neurons (31). After 3 h, the chamber slides were processed for immunofluorescence as described below.
Transcription Assays
The CRE reporter vector from the Mercury Pathway Profiling System (Clontech, Palo Alto, CA) was cloned and purified using endotoxin-free Maxi-Prep kits (Qiagen, Valencia, CA). Cells were plated in 6-well plates and grown overnight. For each well, 1 μg of plasmid DNA was prepared in 500 μl of Opti-MEM medium, combined with 10 μl of Lipofectamine 2000 (Invitrogen, Carlsbad, CA) in 500 μl of Opti-MEM, and incubated for 20 min before being applied to plated cells. After 8 h, the cells were switched to low serum medium for 24 h prior to the experiment. For calcium phosphate transfections using the CalPhos mammalian transfection kit (Clontech), 1 μg of plasmid DNA was combined with water and calcium phosphate reagent, allowed to incubate for 20 min at room temperature, and then added dropwise to cells. Transfections were allowed to proceed overnight before switching to low serum medium for 24 h prior to use. Parallel experiments were performed using either Lipofectamine 2000 or calcium phosphate with similar results.
Luciferase Assay
Cells were assayed for CRE reporter activity using a luciferase reporter assay kit (Clontech). Briefly, cells were washed with phosphate-buffered saline (PBS) (without calcium and magnesium) and then lysed with gentle agitation for 20 min. After centrifugation, supernatants were assayed for luciferase activity within 20 min or frozen at −70 °C and assayed within 3 weeks. Equal volumes of lysate and luciferin substrate were combined (200 μl final volume) followed by a 20 s measurement of emitted light using a Lumat LB 9507 tube luminometer (Berthold Technologies, Oak Ridge, TN). Luciferase, expressed in response to CRE transactivation, catalyzes the oxidation of luciferin, resulting in photon production. Light output is directly proportional to the amount of luciferase, and thus transcriptional activity that is driven by CRE in the cells.
Toxicity Assays
For each assay, 6-OHDA (Sigma) was prepared in ice cold 0.5% (w/v) ascorbate or sterile water immediately before use. Equivalent results were obtained with either vehicle system. Dibutyryl cyclic AMP (Bt2cAMP; Sigma) was prepared in sterile water. Toxicity was measured using a lactate dehydrogenase (LDH) release assay (Sigma 340-UV LDH detection system). Briefly, cells were grown in 96-well plate format and exposed to the LD50 concentration of 6-OHDA (500 μM for B65 cells; 150 μM for SH-SY5Y cells) or to vehicle for 18–20 h. Cells were pre- or post-treated with Bt2cAMP (250 μM) as indicated in the figure legends. The level of LDH released into the culture medium was expressed as percent of total LDH in the wells, as described previously (15). The fluorogenic substrate Z-DEVD-AFC (Calbiochem) was used to measure caspase-3 activity. Lysate (15 μg of protein) was prepared in 200 μl of reaction buffer (0.1% CHAPS buffer containing 20 mM PIPES, 100 mM NaCl, 10 mM dithiothreitol, 1 mM EDTA, 10% sucrose) and mixed with 20 μM Z-DEVD-AFC. The fluorescence of the cleavage product was measured kinetically at 37 °C in a microplate spectrofluorometer (Molecular Devices; excitation wavelength 400 nm, emission 505 nm). Proteolytic activity was expressed as relative fluorescence units normalized to control cultures.
Immunoblotting
Cell lysates were obtained as described previously (15) using a Triton X-100-based lysis buffer in the presence of protease and phosphatase inhibitors. For separation of nuclear and cytoplasmic protein fractions, the NePUR Kit (Pierce) was used as directed by the manufacturer. Protein concentration was determined using the Coomassie Plus protein assay (Pierce). Purity of the fractions was assessed by immunoblotting for cytoplasmic and nuclear markers. Equal amounts of protein were electrophoresed through 5–15% SDS-polyacrylamide gels, transferred to Immobilon-P membranes (Millipore, Bedford, MA), and blocked in 5% nonfat dry milk in PBS-T (20 mM potassium phosphate, 150 mM potassium chloride, and 3% (w/v) Tween 20, pH 7.4) for 1–2 h at room temperature. Blots were probed overnight at 4 °C with the following antibodies and dilutions: total CREB, 1:1000 (Cell Signaling Technology, Danvers, MA); phospho-CREB, 1:1000 (Cell Signaling Technology); β-actin, 1:10,000 (Sigma); lamin A/C, 1:1000 (Cell Signaling Technology). CREB control extracts (Cell Signaling Technology) were used as positive control. After washing, blots were developed using a horseradish peroxidase-conjugated IgG secondary antibody and a chemiluminescence detection kit (Amersham Biosciences). Blots were stripped and reprobed as indicated in the figure legends. After use, blots were stained with Coomassie Blue to confirm equal protein loading and transfer.
Isolation of RNA and RT-PCR
Total RNA was isolated from treated B65 cells using Qiagen RNeasy kits (Qiagen). RNA was quantified by spectrophotometry, and 1 μg of RNA was used for each PCR reaction. Primers were designed using the on-line Primer 3 software (68) unless otherwise stated. The sequences of forward and reverse primers were: 5′-ATACCTGGGCCCAAGTG-3′ and 5′-TGATTTGACCATTTGCCTGA-3′ for Bcl-2; 5′-GTGACAGTATTAGCGAGTGGG-3′ and 5′-GGGTAGTTCGGCATTGC-3′ for BDNF (69); and 5′TGTTTGAGACCTTCAACACC-3′ and 5′-TAGGAGCCAGGGCAGTAATC-3′ for β-actin. Samples were amplified in a PTC-100 programmable thermal controller (Bio-Rad), using the GeneAmp EZ rTth RNA PCR kit (PerkinElmer Life Sciences/Roche Applied Science) following the manufacturer’s instructions. Reaction products were electrophoresed through 1% agarose gels and stained with ethidium bromide.
Quantitative RT-PCR was performed using a LightCycler instrument (Roche Applied Science) and the LightCycler-RNA amplification kit SYBR Green I (Roche Applied Science) to measure RNA in a one-step RT-PCR reaction in real time (32). Melting curves and gel electrophoresis of the products were used to ensure specificity of amplification products.
Electrophoretic Mobility Shift Assay (EMSA
EMSA was performed as described on double-stranded oligonucleotides by hybridizing complementary denatured single-stranded oligonucleotides with 10× annealing buffer (200 mM Tris-HCl, pH 8.0, 100 mM MgCl2, 500 mM NaCl) (33, 34). A palindromic CRE promoter sequence (5′-AGAGATTGCCTGACGTCAGAGAGC-3′) (35) was used for the probe. The CRE probe (32P end-labeled; 20,000 cpm/lane) was incubated with 30 μg of nuclear protein extract in 5× binding buffer (50 mM Tris-HCl, pH 8.0, 62.5% glycerol, 2.5 mM EDTA, 750 mM KCl) in a 30 μl total reaction volume for 15–20 min at 25 °C. Specificity was assessed by competition with unlabeled CRE probe. Poly(dI-dC) (15 ng) was used as a nonspecific competitor. For supershift assays, a mixture of antibodies to CREB and pCREB (Cell Signaling Technology; 4 μl each) was added 15 min prior to the addition of labeled CRE probe. Protein-DNA complexes were resolved on 1× Tris borate-EDTA/10% polyacrylamide gels and detected by autoradiography.
Immunofluorescence
Cells were plated on glass coverslips in 12-well plates at a density of 1.5 × 10⁵ cells/well, treated with 6-OHDA or Bt2cAMP as indicated in the figure legends, and then washed with PBS and fixed in ice-cold 4% paraformaldehyde for 15 min (30). Cells were permeabilized with 0.1% Triton X-100/PBS and then blocked in 5% normal donkey serum. To visualize phosphorylated CREB, a pCREB monoclonal antibody (1:1000, overnight at 4 °C, Cell Signaling Technology) was used. Coverslips were then washed with PBS and incubated with fluorescent secondary antibodies (1:200, Jackson ImmunoResearch Laboratories) for 1 h at room temperature. Nuclei were counter-stained with 4,6-diamidino-2-phenylindole (DAPI, Molecular Probes). Coverslips were mounted in gelvatol, and cells were visualized and photographed using a Nikon Eclipse II microscope. Paraffin-embedded human midbrain sections, from a previously characterized set of parkinsonian and control brains (7, 36, 37), were stained for pCREB (36). The red 3-amino,9-ethyl-carbazole (AEC) chromogen was used with hematoxylin counterstain. Equivalent results were obtained using avidin-biotin or tyramide amplification.
RESULTS
6-OHDA Represses the CRE Promoter
The luciferase reporter transcription assay was used to monitor induction of the CRE in B65 cells treated with medium, vehicle, or 6-OHDA. Luciferase activity from six independent experiments were normalized to the untreated control of each experiment and averaged (Fig. 1A). There was a significant repression in the basal activity of the CRE promoter after 6-OHDA treatment.
FIGURE 1. 6-OHDA treatment causes repression of the CRE promoter.
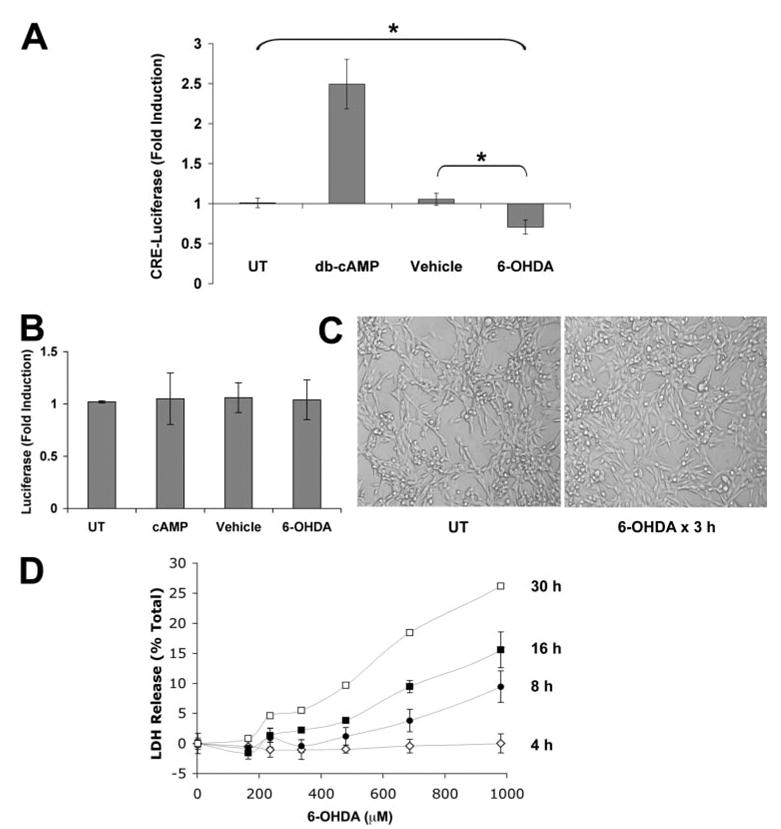
A, the CRE-luciferase reporter vector was used to monitor induction of the CRE element. Cells were transfected with pCRE-luc and then stimulated with medium alone (UT, untreated), Bt2cAMP, 6-OHDA, or ascorbate vehicle for 3 h and assayed for luciferase activity as described under “Experimental Procedures.” Data are expressed as the -fold induction of luciferase activity normalized to the untreated control group and represent the mean of six independent experiments ± S.D. *, p < 0.05 (ANOVA followed by Student’s t test with Bonferroni correction). B, cells were transfected with a control luciferase construct lacking CRE enhancer elements as described under “Experimental Procedures,” treated as in A, and assayed for luciferase activity. There were no significant effects of any treatment condition on basal levels of cellular transcription. C, representative phase contrast images of the cell cultures obtained at 3 h, immediately prior to cell lysis for luciferase assays. No morphologic evidence of cell injury or death was observed at this time point. D, cells were treated with a range of 6-OHDA concentrations for different amounts of time. Cell injury was assayed using the LDH release assay. Data represent the average of triplicate wells ± S.D. There was no evidence of cell death until 8 h after 6-OHDA exposure.
To verify that the observed repression was not due to cell death, several measures of cell viability and the transcription of control luciferase constructs lacking CRE elements (Fig. 1B) were examined. At the time points used for transcriptional assays (30 min to 3 h of 6-OHDA exposure) no morphological changes of cell death are apparent (Fig. 1C). Moreover, there is no evidence of LDH release until 8 h after 6-OHDA exposure (Fig. 1D). Control experiments were conducted using the pTAL plasmid, which lacks CRE sequences but is otherwise identical to the TATA-like promoter-containing CRE reporter vector. 6-OHDA treatment had no effect on pTAL-driven luciferase expression (Fig. 1B), indicating that 6-OHDA does not cause a general disruption in transcriptional responses. Therefore it is likely that the observed transcriptional repression is due to disrupted CRE transactivation and not to general defects in transcription or cell viability.
Disruption in CREB Function Contributes to 6-OHDA-induced Cell Death
Next, the potential ability of cAMP treatment to reverse the repressive effects of 6-OHDA on the CRE promoter was examined. Cells were treated with a cell-permeable form of cAMP 10 min prior to exposure to 6-OHDA. The results demonstrate that Bt2cAMP pretreatment prevented the 6-OHDA-induced repression of CRE activity (Fig. 2A). Treatment of B65 cells with Bt2cAMP in the presence of 6-OHDA not only restored CRE activity but also resulted in CRE activity levels that were higher than those elicited by treatment with the same concentration of Bt2cAMP alone.
FIGURE 2. cAMP reverses 6-OHDA-induced CRE repression and cell death.
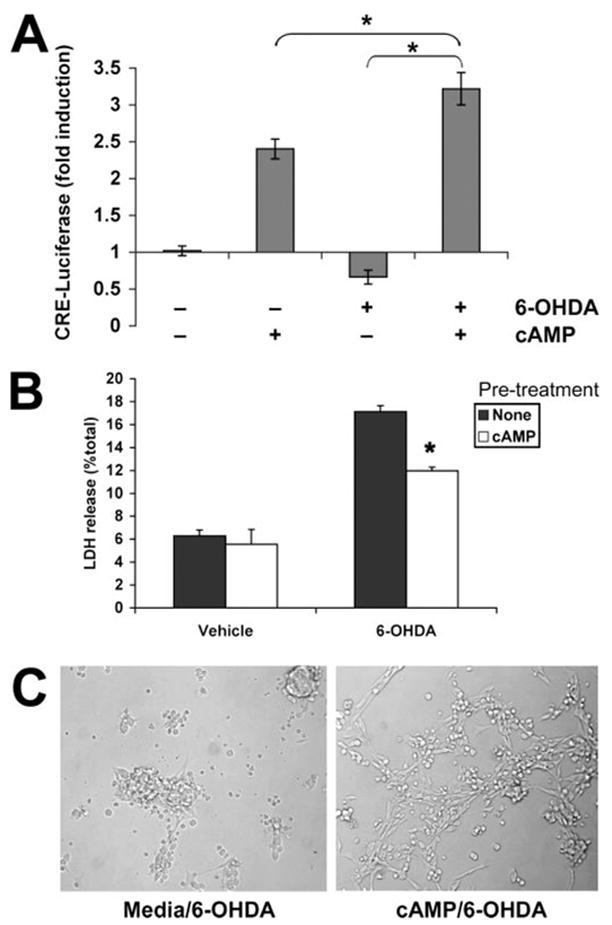
A, cells were transfected with pCRE-luc plasmid and then stimulated with vehicle, Bt2cAMP, 6-OHDA, or 6-OHDA following a 10-min pretreatment with Bt2cAMP. After 3 h, cells were lysed, and luciferase activity was measured. Data are the mean ± S.D. and are representative of five independent experiments. *, p < 0.05 by ANOVA followed by Student’s t test with Bonferroni correction. B, B65 cells were treated for 10 min with medium (None) or Bt2cAMP before exposure to vehicle or 6-OHDA for 18 h. Cell injury was assayed using the LDH release assay, and data are representative of at least three independent experiments. *, p < 0.05 versus 6-OHDA with no pretreatment (Student’s t test). C, cells were photographed immediately prior to performing the LDH assay, showing that Bt2cAMP pretreatment results in greater numbers of viable neuronal cells (right) compared with the shrunken, dead morphology observed with 6-OHDA alone (left).
Experiments were conducted to determine whether Bt2cAMP treatment during 6-OHDA exposure would also confer protection against 6-OHDA-mediated toxicity. Indeed, a 10-min pretreatment with Bt2cAMP resulted in significantly decreased cell injury at 18 h by both morphological examination and LDH release assay (Fig. 2, B and C). Because the addition of Bt2cAMP reversed the 6-OHDA-induced repression while conferring protection, these data suggest that disruption in CRE function contributes to 6-OHDA-induced cell death.
Delayed Administration of cAMP Reverses CRE Repression and Confers Protection
This effect was further characterized by determining whether delayed treatment with Bt2cAMP following initiation of 6-OHDA toxicity would still effectively reverse 6-OHDA-mediated CRE repression. We exposed the CRE-transfected B65 cells to Bt2cAMP at different intervals after 6-OHDA exposure. Results showed that delayed addition of Bt2cAMP caused a reversal of 6-OHDA-induced repression (Fig. 3A). Moreover, delayed Bt2cAMP treatments also resulted in significant protection against toxicity even when administered up to 4 h after initiation of 6-OHDA treatment (Fig. 3B), further supporting the interpretation that perturbations to the CREB signaling pathway contributes to 6-OHDA toxicity.
FIGURE 3. Delayed administration of cAMP following 6-OHDA treatment rescues cells from toxicity.
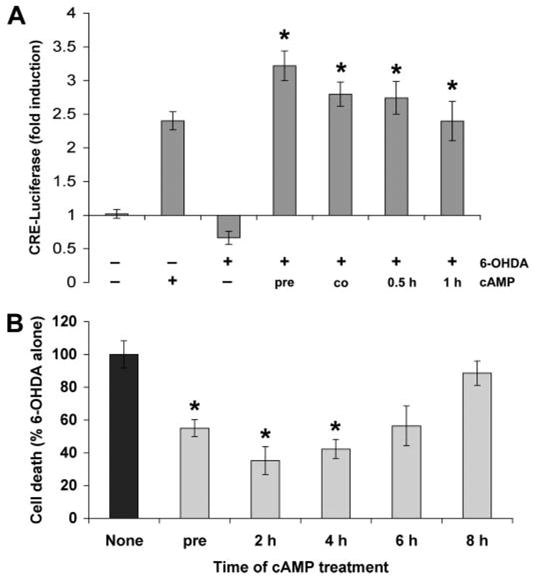
A, cells were transfected with pCRE-luc plasmid and treated with 6-OHDA and/or Bt2cAMP as indicated. The Bt2cAMP was added 10 min prior to 6-OHDA (pre), simultaneously with 6-OHDA (co), or at different intervals after initiation of 6-OHDA injury. After 3 h, cells were lysed and luciferase activity measured. Data are the mean ± S.D. and are representative of at least three independent experiments. *, p < 0.05 versus 6-OHDA alone (ANOVA followed by Student’s t test with Bonferroni correction). B, cells were pretreated with Bt2cAMP 10 min prior to 6-OHDA or at different intervals after initiation of 6-OHDA injury. After 18 h, cell death was measured using the LDH release assay. Data represent the mean ± S.D. from at least three independent experiments. *, p < 0.05 versus 6-OHDA alone (ANOVA followed by Student’s t test with Bonferroni correction).
6-OHDA Reduces Expression of CRE-regulated Genes
To confirm that 6-OHDA-induced repression of CRE transactivation was associated with functional effects on endogenous genes, we examined the expression of downstream CRE-regulated genes (25). BDNF and Bcl-2 were selected because of their well documented roles in neuronal growth and survival as well as prior studies showing that both CREB-induced genes can protect from 6-OHDA toxicity (38, 39). Quantitative RT-PCR showed decreased BCL2 and BDNF mRNA in response to 6-OHDA treatment (Fig. 4). No changes were observed in the mRNA levels of mitogen-activated protein kinase (MAPK) phosphatase-3 (MKP-3), which lacks CRE sequences in its promoter region, or in the mRNA levels of β-actin.
FIGURE 4. 6-OHDA results in decreased BDNF and Bcl-2 mRNA expression, which is reversed by cAMP.
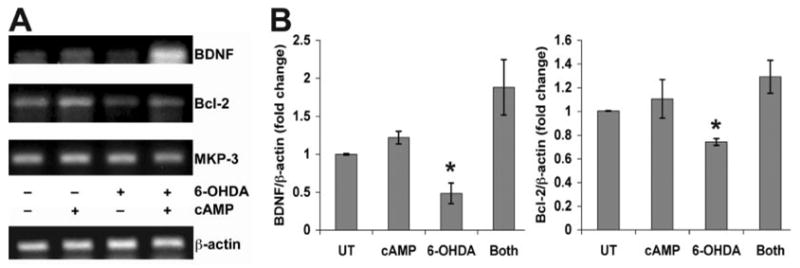
A, B65 cells were treated with combinations of 6-OHDA and Bt2cAMP as indicated and subjected to RT-PCR analysis as described under “Experimental Procedures.” Note the decreased levels of BDNF and Bcl-2 mRNA in 6-OHDA-treated cells, which is reversed by the addition of Bt2cAMP. In contrast, there are no changes in the mRNA levels of MKP-3 or β-actin, two genes that lack CRE elements in their promoter regions. Gels are representative of three independent experiments using a Bio-Rad PTC-100 programmable thermal controller. B, for quantitative RT-PCR, cells were treated as above and analyzed by real time RT-PCR using the Roche LightCycler SYBR Green I system. Data were analyzed in relation to β-actin crossing points using the DΔCt method (66). Each graph reflects the average of three independent experiments. *, p < 0.05 versus media-treated controls (UT)/Both (ANOVA and Student’s t test with Bonferroni correction).
In addition, stimulation of CRE by cAMP prevented the 6-OHDA-induced reduction in mRNA expression of Bcl-2 and BDNF (Fig. 4). Because cAMP also conferred significant protection, these data indicate that 6-OHDA-mediated repression of CRE transactivation results in decreased expression of CRE-controlled survival genes.
Electrophoretic Mobility Shift Assay Demonstrated Decreased CRE Binding Activity in 6-OHDA-treated Cells
Nuclear extracts from B65 cells treated with 6-OHDA and/or Bt2cAMP for 3 h were incubated with radiolabeled DNA containing a palindromic CRE promoter sequence. Use of specific (unlabeled probe) and nonspecific poly(dI-dC) competitors revealed a specific protein-CRE doublet. 6-OHDA resulted in decreased CRE binding activity of both bands compared with control and Bt2cAMP-treated cells (Fig. 5A). A supershift assay confirmed the presence of CREB/pCREB in the complex (Fig. 5B). Interestingly, Bt2cAMP co-treatment did not reverse the decrease in CRE binding activity observed in 6-OHDA-treated cells (Fig. 5A), despite its ability to reverse CRE-transcriptional repression as assessed by CRE-luciferase and quantitative RT-PCR. It is possible that the kinetics of Bt2cAMP-mediated changes do not correspond with the time point analyzed. A more likely explanation is that more complex interactions involving coactivators and corepressors underlie the ability of Bt2cAMP to reverse 6-OHDA-mediated transcriptional represssion.
FIGURE 5. Electrophoretic mobility shift assay of CRE binding activity in B65 Cells.
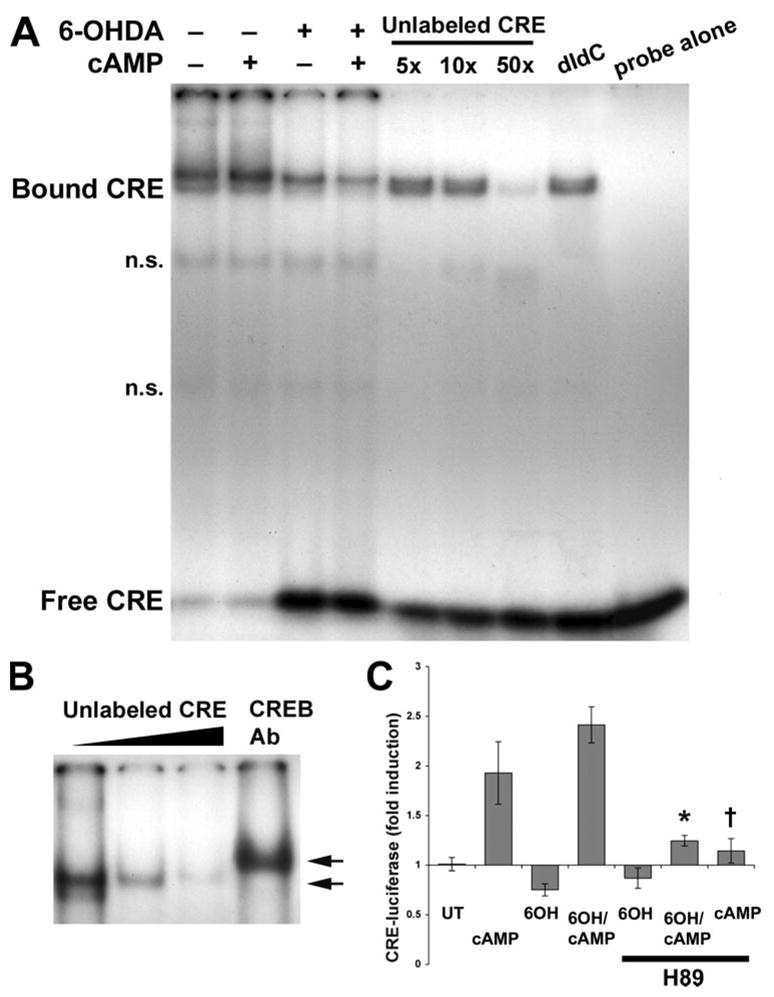
A, nuclear extracts prepared from B65 cells that were untreated or treated with Bt2cAMP alone/or prior to 6-OHDA were incubated with a 32P-labeled CRE probe for 15–20 min at room temperature. Where indicated, incubations were performed in the presence of a 5-, 10-, or 50-fold molar excess of unlabeled CRE probe to inhibit the specific band (A), in the presence of poly(dI-dC) to inhibit the nonspecific bands (n.s.) or in the presence of CREB antibodies to supershift the protein-CRE complex (in B). Protein-DNA complexes were resolved on 5% native polyacrylamide gels by electrophoresis. The migration of protein-bound CRE probe is retarded relative to that of the free CRE probe. B, to determine whether the protein-CRE complexes included CREB, antibodies were used to supershift the complexes. Arrows indicate the relative migration of protein-bound CRE with and without the CREB antibodies (Ab). C, B65 cells transfected with CRE-luciferase were treated with Bt2-cAMP, 6-OHDA (6OH), or both Bt2cAMP and 6-OHDA, in the absence or presence of the PKA inhibitor H89 (10 μM). After 3 h, lysates were collected for the luciferase assay, and the results normalized to untreated control cultures (UT). 6-OHDA caused significant repression of CRE-luciferase expression, which was not reversed by H89. H89 co-treatment significantly inhibited effects of Bt2cAMP alone and the effects of Bt2cAMP on cells treated with 6-OHDA. *, p < 0.01 versus 6-OHDA/Bt2cAMP; †, p < 0.01 versus Bt2cAMP.
To determine whether the effects of Bt2cAMP were mediated through activation of protein kinase A (PKA), cells were treated in the presence of a PKA inhibitor H89 (10 μM) as described previously (40). The presence of H89 suppressed Bt2cAMP-mediated increases in CRE-luciferase activity in cells co-treated with Bt2cAMP and 6-OHDA (Fig. 5C). These results suggest that the transcriptional effects of Bt2cAMP are mediated through PKA, although additional mechanisms affecting 6-OHDA-mediated repression cannot be excluded.
Effects of 6-OHDA Treatment on CREB Phosphorylation and Localization
To further investigate the potential mechanism(s) underlying CRE repression, we examined the expression levels of pCREB in B65 cells. In contrast to studies in other systems that showed decreased CREB phosphorylation as the major mechanism of signaling pathway repression (41, 42), 6-OHDA-treated cells exhibited a clear increase in pCREB (Fig. 6A).
FIGURE 6. Effects of 6-OHDA treatment on subcellular distribution of pCREB.
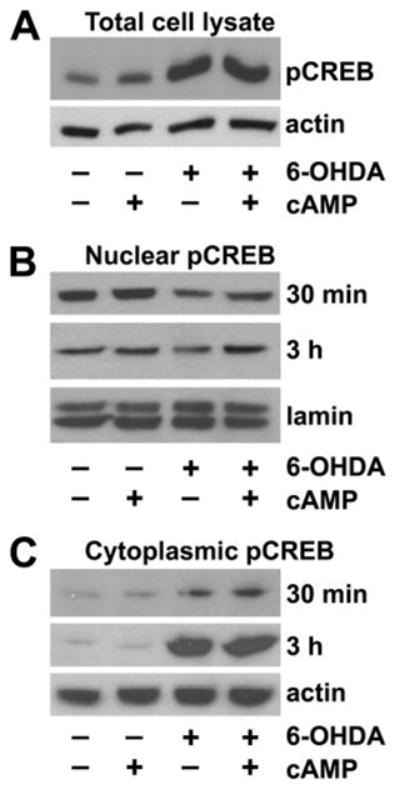
A, total Triton X-100 cell lysates, prepared following treatment with the indicated combinations of Bt2cAMP and 6-OHDA, were subjected to Western blot analysis for pCREB. B, nuclear fractions were prepared from cells treated with Bt2cAMP and 6-OHDA for the indicated time points, analyzed for pCREB, and then stripped and reprobed for the nuclear marker lamin A. C, cytoplasmic fractions were prepared from cells treated with Bt2cAMP and 6-OHDA for the indicated time points, analyzed for pCREB, and then stripped and reprobed for β-actin as a loading control. Data are representative of at least three independent experiments.
Because CREB can be activated in the cytoplasm by phosphorylation of Ser-133 before translocating to the nucleus to control gene transcription (43), we performed subcellular fractionation studies. Time course studies revealed that 6-OHDA caused progressive accumulation of pCREB in the cytoplasm (Fig. 6C), with a mild but persistent decrease in nuclear fractions of 6-OHDA-treated cells (Fig. 6B). A similar pattern was observed using an antibody that recognizes CREB irrespective of its phosphorylation state (not illustrated). The altered subcellular distribution of pCREB in 6-OHDA-treated cells likely contributes to the functional repression of CRE transactivation, despite increased total levels of pCREB. There were no changes in the levels of CREB-binding protein (CBP), a co-activator of CRE transcription that was present only in the nuclear fractions (not illustrated). Thus, the altered nuclear-cytoplasmic distribution of CREB is not due to generalized disruption of all nuclear transcription related proteins. The addition of protective doses of Bt2cAMP to 6-OHDA-treated cells ameliorated the decrease in nuclear pCREB but had little effect on pCREB accumulation in the cytoplasm (Fig. 6, B and C, last lane).
Immunofluorescence Localization of pCREB in 6-OHDA-treated Cells
The distribution of pCREB was further characterized using immunofluorescence. In control cells, there is a low basal level of pCREB staining, which is predominantly cytoplasmic in distribution (Fig. 7A). The addition of Bt2cAMP to otherwise untreated cells had no effect on the intensity of pCREB staining in the cells but increased the numbers of cells showing nuclear localization of pCREB (Fig. 7B). In contrast, 6-OHDA resulted in increased cytoplasmic pCREB staining intensity (Fig. 7C). Co-treatment with Bt2cAMP promoted nuclear localization of pCREB in a subset of cells (Fig. 7D, arrows). These in situ techniques support the results obtained from the subcellular fractionation studies and demonstrate that 6-OHDA elicits accumulation of pCREB in the cytoplasm. Despite this increase in cytoplasmic pCREB levels, nuclear expression of pCREB and transactivation of CRE-containing genes were suppressed during 6-OHDA toxicity.
FIGURE 7. 6-OHDA elicits increased cytoplasmic and perinuclear staining for pCREB.
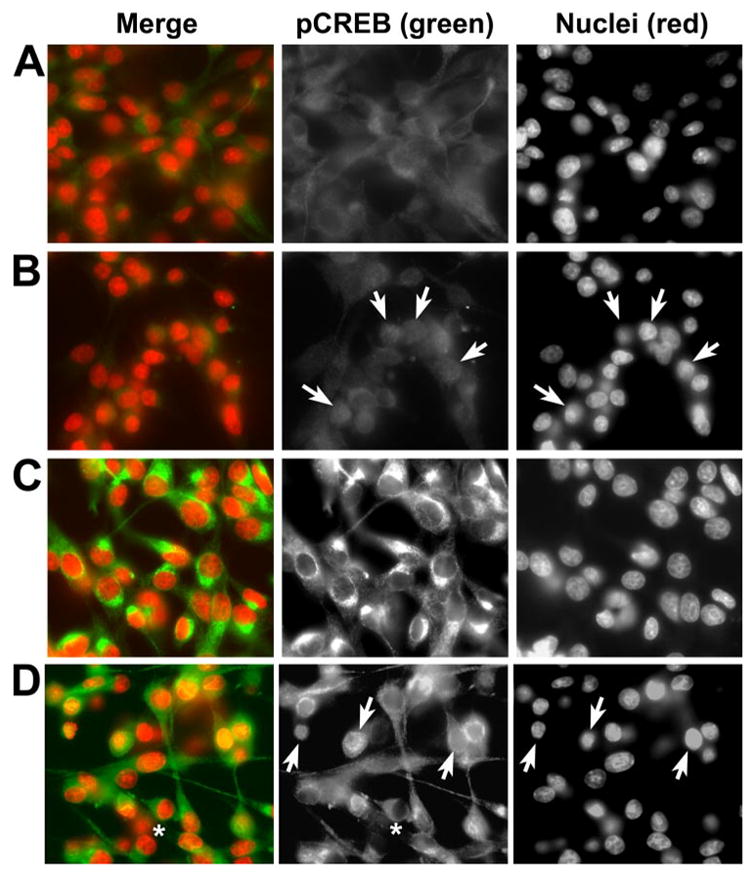
Cells were treated as indicated below. After 3 h, coverslips were fixed and double-labeled for pCREB and the nuclear marker 4,6-diamidino-2-phenylindole as described under “Experimental Procedures.” A, a light, predominantly cytoplasmic staining pattern is observed for pCREB in control cultures. B, addition of Bt2cAMP alone promotes nuclear staining for pCREB (arrows; note that pCREB staining is diffuse with no evidence of nuclear exclusion in many cells). C, 6-OHDA-treated cells display increased cytoplasmic staining. D, 6-OHDA/Bt2cAMP-co-treated cells display both increased cytoplasmic staining with exclusion of the nucleus (asterisks) in some cells and diffuse nuclear or nuclear-cytoplasmic staining (arrows) in other cells. Data are representative of three independent experiments.
6-OHDA Induces CRE Repression and Decreased Nuclear pCREB That Is Reversed by cAMP in SH-SY5Y Cells
The effects of 6-OHDA on CREB signaling was confirmed using a different cell line. SH-SY5Y is a human neuroblastoma cell line that produces dopamine and expresses dopamine transporters (44). SH-SY5Y has been used extensively to model dopaminergic neuron injury and death (5, 45, 46). 6-OHDA caused a 50% repression in basal CRE-luciferase activity in SH-SY5Y cells (Fig. 8A). Although co-treatment with Bt2cAMP completely reversed the 6-OHDA-mediated transcriptional repression, co-treatment did not result in the degree of increased CRE transactivation observed in B65 cells. As in B65 cells, repression of basal CRE transactivation was accompanied by increased cytoplasmic CREB/pCREB and by decreased nuclear CREB/pCREB in SH-SY5Y cells (Fig. 8B). Restoration of CRE transcription in cells co-treated with Bt2cAMP and 6-OHDA was accompanied by increased nuclear pCREB, although levels of total CREB were not altered relative to 6-OHDA alone. Immunofluorescence studies also confirm an increase in cytoplasmic pCREB staining in 6-OHDA-treated SH-SY5Y cells (Fig. 8C). Interestingly, there was a change in the cytoplasmic distribution of pCREB. Control cells showed a light, finely stippled staining pattern. The addition of 6-OHDA resulted in the appearance of a clumped perinuclear staining. As in B65 cells, Bt2cAMP conferred significant protection from 6-OHDA toxicity (not illustrated). 6-OHDA toxicity was accompanied by caspase 3 activation (Fig. 8D), which was significantly decreased by Bt2cAMP co-treatment.
FIGURE 8. 6-OHDA also causes CRE repression with increased cytoplasmic to nuclear CREB ratios in SH-SY5Y cells.
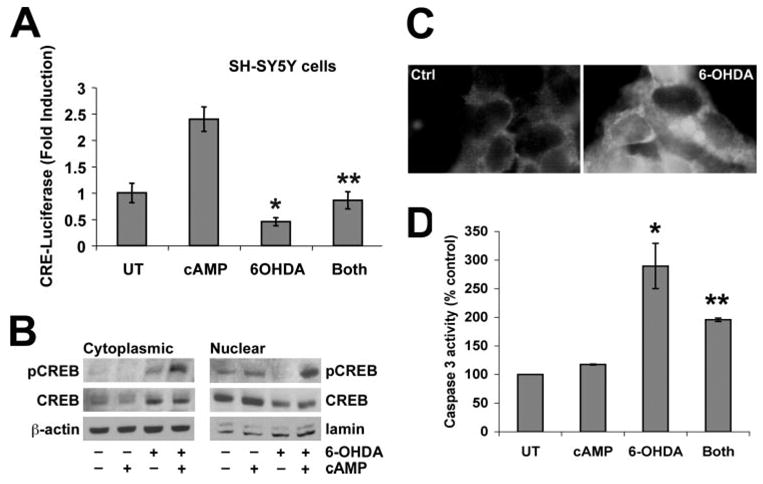
A human neuroblastoma-derived dopaminergic cell line was treated with LD50 doses of 6-OHDA (150 μM) for 3 h. A, in some experiments, cells were transfected with CRE-luciferase reporter 24 h earlier, and lysates were analyzed in quadruplicate wells for luciferase activity. Data are expressed as -fold induction of luciferase activity normalized to the untreated control (UT) group ± S.D. B, equal amounts of protein were loaded from cytoplasmic and nuclear fractions of lysates from cells treated as indicated. Immunoblot analysis for pCREB, total CREB, and loading controls were performed. C, SH-SY5Y cells were treated with vehicle or 6-OHDA for 3 h and subjected to immunofluorescence for pCREB. Note that 6-OHDA-treated cells display increased cytoplasmic pCREB staining, which shows a clumped distribution in contrast to the diffuse light pCREB staining in control cells. D, 6-OHDA elicits increased caspase 3 activity in SH-SY5Y cells that is significantly attenuated by co-treatment with Bt2cAMP. A and D: *, p < 0.05 versus untreated control; **, p < 0.05 versus 6-OHDA alone (ANOVA followed by Student’s t test with Bonferroni correction).
6-OHDA Injury to Primary Dopaminergic Neurons Is Accompanied by Loss of Nuclear pCREB
To determine the effects of 6-OHDA toxicity on primary dopaminergic neurons, midbrain cultures were derived from embryonic mice as described under “Experimental Procedures.” As dopaminergic neurons account for only a minor component of midbrain cultures, 6-OHDA-treated cultures were triple labeled for pCREB, tyrosine hydroxylase (TH) to identify dopaminergic neurons, and 4,6-diamidino-2-phenylindole as the nuclear marker. In contrast to the immortalized neuronal cells, primary neurons exhibited a higher basal expression of nuclear pCREB, which was enhanced by Bt2cAMP treatment (Fig. 9, A and B). In contrast, 6-OHDA treatment resulted in two staining patterns, both characterized by an absence of nuclear pCREB. The more common pattern involved granular or clumped cytoplasmic staining for pCREB with exclusion from the nuclear outline (Fig. 9C). Other TH neurons exhibited an absence of pCREB staining (Fig. 9D, asterisk). Interestingly, non-TH neurons in the cultures, which are more resistant to 6-OHDA injury as they lack an active transport mechanism for the toxin, retained robust nuclear pCREB expression (Fig. 9D, arrows). Quantitative image analysis of nuclear staining in TH+ neurons was performed as described previously (30). These results indicate significant loss of nuclear pCREB in 6-OHDA cells, which was reversed in cells treated with both 6-OHDA and Bt2CAMP (Fig. 9E).
FIGURE 9. Decreased nuclear pCREB is observed specifically in 6-OHDA-treated TH+ neurons, which is reversed by cAMP co-treatment.
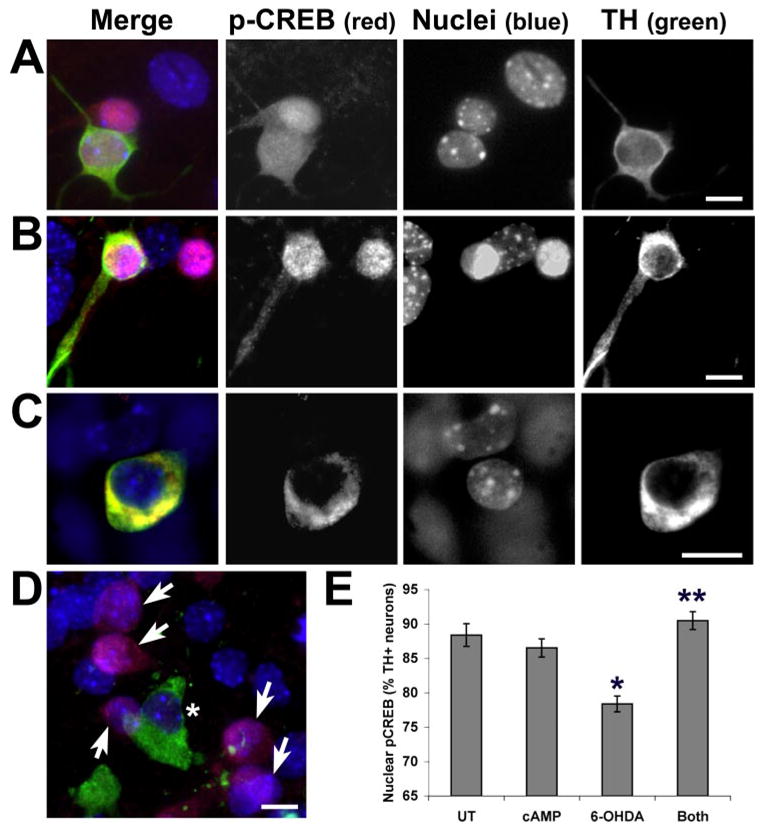
Primary midbrain cultures from embryonic day 15 mice were plated on chamber slides and treated with 50 μM 6-OHDA in the presence or absence of Bt2cAMP. Nuclear pCREB appears purple because of colocalization of the red pCREB signal and blue nuclear counterstain. A, in control cultures, both TH+ and non-TH neurons show diffuse nuclear and cytoplasmic staining for pCREB. B, treatment with Bt2cAMP results in accentuated nuclear staining for pCREB in both TH+ and non-TH neurons. C, 6-OHDA, which is internalized by high affinity dopamine transporters on TH+ neurons, selectively decreases nuclear pCREB staining in many TH neurons. Cytoplasmic pCREB is preserved, sometimes developing a clumped appearance similar to that observed in SH-SY5Y cells (yellow because of colocalization of red pCREB and green TH fluorescence). D, in other TH+ neurons, there is an absence of nuclear and cytoplasmic pCREB staining (asterisk), but non-TH neurons in the same culture show nuclear pCREB (arrows). E, TH+ neurons from four independent chambers/treatment condition were scored as showing either nuclear pCREB staining or loss of nuclear pCREB staining. Note that 6-OHDA caused a significant decrease in nuclear pCREB at 3 h, which was reversed by co-treatment with Bt2cAMP. *, p < 0.05 versus untreated control (UT); **, p < 0.05 versus 6-OHDA alone (ANOVA followed by Student’s t test with Bonferroni correction). Scale: 10 μm.
Cytoplasmic Accumulation of pCREB Is Observed in Dopaminergic Neurons of Human Parkinson/Lewy Body Disease Patients
We previously found that kinases capable of functioning upstream of CREB are involved in granular or clumped cytoplasmic aggregates in Parkinson disease and the closely related diffuse Lewy body dementia and that this alteration is also observed in early, presymptomatic patients (36). Immunohistochemical study of pCREB was performed on a subset of cases from this series. In normal brains, pCREB staining is limited to glial nuclei (Fig. 10, A and B) and the nuclei of endothelial cells (not illustrated). In the diseased human neurons, there was increased expression of granular or clumped pCREB immunoreactivity (Fig. 10, C–G) in both pigmented and depigmented (pale body) regions of cytoplasm. Thus, similar perturbations in pCREB localization are observed in 6-OHDA-treated cultures and human parkinsonian neurons.
FIGURE 10. Clumped or granular pCREB is increased in the cytoplasm of dopaminergic neurons in the substantia nigra of parkinsonian patient brains.
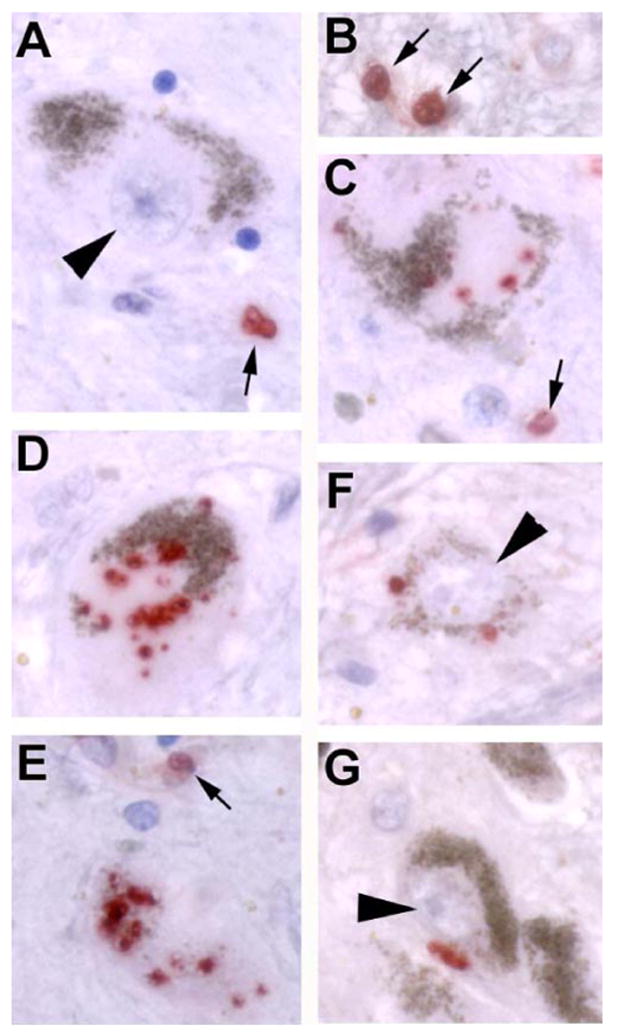
A and B, in elderly control subjects, there is normally no pCREB staining (red) in SNc (substantia nigra pars compacta) neurons (arrowhead), but staining of glial nuclei (arrows) is seen. Note the brown endogenous pigment that characterizes dopaminergic neurons in the SNc, which is readily distinguished from the red chromogen used for the pCREB stain. C–E, in different Parkinson/Lewy body disease patient brains, there was increased granular or clumped pCREB staining, often in association with regions of cytoplasmic depigmentation (pale bodies). Positive staining is also observed in glial nuclei (arrows). F and G, the increase in pCREB staining was restricted to cytoplasm of SNc neurons and was not observed in neuronal nuclei (arrowheads). Scale: 10 μm.
DISCUSSION
Oxidative stress is increased in both aging and age-related diseases of almost every major organ system including the nervous system. However, mechanisms that contribute to impaired cellular adaptation to oxidative neuronal injuries remain to be fully defined. Using two central nervous system-derived neuronal cell lines, we have determined that the oxidative neurotoxin 6-OHDA causes a decrease in transactivation of the CRE promotor, resulting in reduced expression of downstream CREB-regulated genes, which include two well characterized survival mediators, Bcl-2 and BDNF. CRE transcriptional repression is accompanied by altered subcellular localization of CREB/pCREB, and similar alterations are observed in dopaminergic neurons of primary midbrain cultures and human parkinsonian post-mortem tissue. These effects occur early in the injury process, prior to cell death commitment and lysis, as evidenced by the ability of cAMP stimulation to reverse the transcriptional effects, conferring significant protection when applied 4 h after initiation of injury.
These data support the concept that inhibition of the CREB signaling pathway plays an important role in oxidative stress-induced toxicity. In other model systems, it has been shown that oxidative stressors can disrupt CREB function by interfering with CREB phosphorylation (41, 42). This mechanism is not seen in our studies, as CREB phosphorylation was increased in response to 6-OHDA. The accumulation of CREB and pCREB in the cytoplasm suggests that 6-OHDA treatment may interfere with nuclear translocation of phosphorylated CREB. Interestingly, it has been shown that inhibitors of nuclear import elicit increased cytoplasmic pCREB and decreased CREB-mediated transcriptional responses in smooth muscle cells (43). Additionally, it is possible that impaired dephosphorylation, disruption of proteasomal and autophagic degradation systems, and/or mitochondrial targeting further contribute to the observed cytoplasmic accumulation (47–49). Regardless, the results suggest that subcellular diversion of CREB proteins, rather than inhibition of phosphorylation, is responsible for the loss of neuroprotective CRE transcriptional activity. A role for altered expression of BDNF and Bcl-2 in parkinsonian neurodegeneration is suggested by several studies of diseased human tissues and model systems. For example, BDNF expression levels are decreased in the substantia nigra of Parkinson disease patients (50, 51), and BDNF treatment reverses the motor deficits induced by 6-OHDA in vivo (38). Additionally, overexpression of Bcl-2 in rat brain prior to 6-OHDA administration results in increased survival of neurons within substantia nigra (52, 53), and Bcl-2 family members can inhibit 6-OHDA-induced death in SH-SY5Y cells (39). Our findings that BDNF and Bcl-2 mRNA levels are decreased with 6-OHDA treatment provide a potential mechanism underlying loss of these CRE-controlled gene products, supporting the concept that impaired survival signaling contributes to parkinsonian pathogenesis.
Previous studies of transcriptional responses to 6-OHDA focused upon up-regulation of genes potentially involved in death pathways (23, 54). Both the unfolded protein/endoplasmic reticulum stress response and c-Jun induction were implicated. Of interest are the data indicating that c-Jun/CREB heterodimerization may determine whether increased protein-CRE binding activity results in suppression rather than induction of CRE-transcription (35). Although genes in which expression is down-regulated by 6-OHDA were not analyzed in these reports, CRE-regulated genes, such as phosphoenolpyruvate carboxykinase and Bcl-2, were not up-regulated along with other genes involved in bioenergetics and death regulation. These observations are consistent with our results showing decreased CRE-regulated transcription in 6-OHDA-treated cells.
Our prior studies demonstrated that spatial and temporal alterations in the ERK signaling pathway contribute to 6-OHDA-mediated toxicity (15, 55). In particular, granular cytoplasmic accumulations of pERK is observed both in 6-OHDA-treated neuronal cell lines and in degenerating neurons of human Parkinson disease brain tissues (36, 37). Neuroprotective antioxidant treatments blocked cytoplasmic accumulation in the neuronal cell line, indicating that diversion of ERK signaling may contribute to cell death (22, 36). Transcriptional activation of CREB can be regulated through phosphorylation at Ser-133 by ribosomal S6 kinase (RSK), which is activated by pERK. Further examination of the ERK-RSK-CREB pathway showed increases of phosphorylated-RSK within the cytoplasm in response to 6-OHDA (22). The current subcellular fractionation and immunofluorescence data showing accumulation of pCREB in the cytoplasm and loss of CRE-mediated transcriptional activity in 6-OHDA-treated cells suggest the possibility of a common deficit in nuclear translocation. The phosphorylated forms of ERK, RSK, and CREB are increased in the cytoplasm of degenerating human substantia nigra neurons (36) (Fig. 10), suggesting that altered kinase trafficking may underlie impaired survival signaling in human neurodegenerative diseases. As the Parkinson disease-related protein α-synuclein shares homology with 14-3-3 proteins (56), the potential involvement of α-synuclein aggregation in altering the distribution of these signaling proteins deserves further study.
Although 6-OHDA toxicity can be ameliorated by a spectrum of anti-oxidants (15, 22, 36), the roles of specific oxidative mediators and their compartmentalization are less clear. Previous studies of the ERK signaling pathway indicate that LD50 doses of hydrogen peroxide do not have the same signaling effects as LD50 doses of 6-OHDA (15). Preliminary studies suggest that whereas antioxidants may inhibit 6-OHDA-mediated CRE repression, hydrogen peroxide does not represss CRE transcription in B65 or SH-SY5Y cells.3 Moreover, hydrogen peroxide increases CREB DNA binding in primary cortical neurons.4 Thus, although antioxidants inhibit 6-OHDA-induced toxicity and signaling alterations in vitro (15, 22, 36) and in vivo (7), the signaling alterations observed here appear relatively specific to 6-OHDA.
Similar observations in two catecholaminergic cell lines and in primary dopaminergic neurons indicate that altered CREB regulation is a common response of catecholaminergic cells to this toxin. As 6-OHDA is targeted to cells that express the high affinity dopamine transporter, it can be difficult to separate cell type-specific effects from toxin specific effects. Interestingly, although loss of nuclear pCREB is observed in 6-OHDA-injured TH+ neurons in primary culture, the non-TH neurons retain robust nuclear pCREB expression (Fig. 9D). This supports the hypothesis that failure to successfully up-regulate neuroprotective CREB-dependent transcription may underlie lethal effects of 6-OHDA in catecholaminergic cells.
Pulse-chase experiments indicate that 6-OHDA-treated B65 cells are committed to die in a delayed fashion following transient exposures to 6-OHDA (15). The current data indicate that there is no significant LDH release until 8 h of 6-OHDA exposure. It is interesting to note that cAMP is able to confer significant protection even when applied 4 h after injury, a time occurring after commitment to death (in the absence of protective interventions) and prior to initiation of cell lysis. In addition there is a trend to protection even at 6 h after injury. In contrast, the application of antioxidants is effective in preventing cell death only when added within the first 15–60 min of injury.5 This finding indicates that downstream signaling alterations induced by oxidative neurotoxins may prove amenable to therapeutic manipulation beyond the window of time when antioxidants are able to prevent injury.
As 6-OHDA represses CRE-related genes such as Bcl-2 and co-treatment with cAMP restores Bcl-2 mRNA, one would predict reciprocal effects on caspase 3 activity. Indeed, 6-OHDA elicits increased caspase 3 activity, and co-treatment with cAMP significantly attenuates this response in SH-SY5Y cells (Fig. 8D), which undergo well described apoptosis (39, 57). B65 cells undergo an alternative form of ERK-dependent cell death with non-apoptotic ultrastructural features6 similar to that described in primary striatal neurons (58). Nevertheless, similarities between the two cell lines in terms of early transcriptional alterations suggest that CREB-related changes are upstream to and independent of specific execution mechanisms. Bcl-2 protects against both apoptotic and alternative death pathways (59), and CREB-regulated transcription is neuroprotective in ischemic/excitotoxic neuronal death as well (60). Taken together with our delayed protection experiments (Fig. 3B), these observations indicate that the CREB alterations are involved in early cell fate decisions in injured neurons prior to cell death commitment.
Although the data indicate that cytoplasmic diversion/retention of pCREB contributes to 6-OHDA repression of CRE transcription, EMSA data suggest that cAMP may act through additional mechanisms other than simple reversal of 6-OHDA effects on CRE binding. It is not clear why cAMP-induced restoration in nuclear pCREB, observed in SH-SY5Y and B65 cells by Western blot and immunofluorescence (Figs. 6B, 7D, and 8B), is not reflected by increased CRE probe binding by EMSA (Fig. 5A). Although it is accepted that cAMP enhances the trans-activation potential of CREB, this is not necessarily correlated with increased DNA binding affinity (25). It is possible that cAMP increases the transcriptional efficiency of DNA-bound CREB through enhanced binding of co-activators or changes in the stoichiometry of CREB heterodimers to favor transcription. Although sequestration of CBP has been proposed as a pathologic mechanism in other systems (56), CBP immunoblots show no changes in nuclear levels of CBP in response to either 6-OHDA or cAMP. As high doses of butyrate can inhibit histone deacetylase (57), it is also possible that increased transcriptional efficiency results from this mechanism. Another potential mechanism may involve decreased involvement of c-Jun in the protein-DNA complexes, which would be predicted to derepress CRE transcription (33). These possibilities are not mutually exclusive, and H89 studies implicate the involvement of PKA downstream of cAMP (Fig. 5C).
CREB can be phosphorylated as a consequence of calcium signaling, through activation of ERK-regulated kinases, or by cAMP-activated PKA, and the integration of these pathways may be necessary for full stimulation of CREB-dependent transcription (61, 62). Interestingly, inhibitors of nuclear import have no effect on the subcellular distribution of pCREB or CRE-mediated transcription when muscle cells are stimulated by cAMP (43). This may be because of the small size of the catalytic subunit of PKA, which can diffuse freely through nuclear pores (63). In contrast, CRE transcriptional responses to platelet-derived growth factor receptor or membrane depolarization are inhibited when nuclear import is blocked, contributing to cytoplasmic accumulation of pCREB (43). Notably, both of these latter stimuli regulate CREB phosphorylation via cytoplasmic kinases such as the ERK. Taken together, the current and previously published data suggest that 6-OHDA treatment results in impaired nuclear import of pERK, pRSK, and pCREB, which accumulate in the cytoplasm. The addition of cAMP is able to bypass the signaling blockage through mechanisms that may involve PKA, resulting in restoration of neuroprotective CRE transcriptional responses (Fig. 11).
FIGURE 11. Schematic illustrating effects of 6-OHDA on signaling cascades.
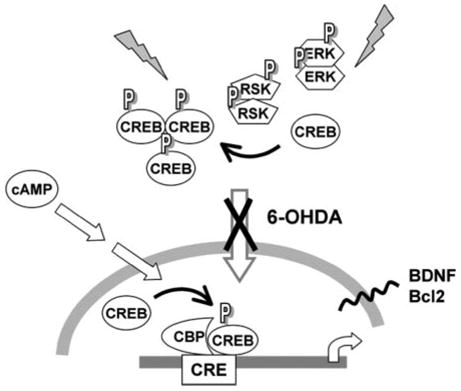
6-OHDA treatment results in cytoplasmic accumulation of pCREB accompanied by repression of CRE-mediated transcription and decreased expression of BDNF and Bcl-2. Previous studies have also demonstrated accumulation of pERK and pRSK in the cytoplasm of 6-OHDA-injured cells and human Parkinson disease neurons (36), suggesting a deficit in nuclear localization of activated signaling proteins. Administration of cAMP bypasses the effects of 6-OHDA on CRE-mediated transcription, conferring significant protection if administered prior to the initiation of cell lysis. Interestingly, other studies have shown that inhibition of nuclear import blocks CRE activation elicited by the ERK-RSK pathway, but cAMP-PKA-mediated CRE activation occurs independently of active nuclear import (43, 63). Given increasing reports of signaling proteins and transcription factors accumulating in the cytoplasm of degenerating neurons (36, 67), strategies to bypass potential translocation deficits may prove promising.
Sequestration of CRE activator proteins has been suggested to play a causal role in the progression of other neurodegenerative diseases such as Huntington disease (64). In these studies, intranuclear aggregation of CBP occurs, preventing access to its CREB target and resulting in decreased gene transcription and subsequent disease pathology (64). Additionally, persistent ERK activation in liver cells results in increased binding of CBP to RSK within the nucleus, which results in decreased phosphorylation of CREB and attenuation of CRE-mediated gene expression (65). Although these differ from our study in showing nuclear sequestration and reduced levels of CREB phosphorylation, impaired ability to mount protective CRE transcriptional responses may represent a common mechanism in neurodegenerative diseases.
To summarize, cytoplasmic sequestration of signaling proteins or transcription factors may represent a novel mechanism contributing to failed compensation during oxidative neuronal injuries. The discovery of impaired signaling mechanisms in injury models indicates that trophic factor supplementation therapies may need to consider strategies for bypassing or reversing potential downstream blockages elicited by disease or age-associated oxidative stressors. Although the specific mechanisms leading to impairment of protective CRE transactivation in the 6-OHDA model differs from those described previously for other oxidative or neurodegeneration models, the ability of cAMP to mobilize potentially active pools of pCREB and override the deficit in CRE-dependent transcription may prove beneficial.
Acknowledgments
We thank Drs. Don DeFranco and Scott Kulich for helpful discussion, Drs. Tim Oury and Lana Hanford for assistance with quantitative RT-PCR, and Amy Sartori for technical assistance with the cell death time course.
The abbreviations used are
- 6-OHDA
6-hydroxydopamine
- BDNF
brain-derived neurotrophic factor
- CRE
cAMP response element
- CREB
CRE-binding protein
- CBP
CREB-binding protein
- ERK
extracellular signal-regulated protein kinase
- RSK
ribosomal S-6 kinase
- pCREB
activated CREB phosphorylated at Ser-133
- pCRE-luc
reporter plasmid in which luciferase expression is regulated by CRE sequences
- pERK
activated ERK phosphorylated at Thr-202/Tyr-204
- PKA
protein kinase A
- PBS
phosphate-buffered saline
- LDH
lactate dehydrogenase
- CHAPS
3-[(3-cholamidopropyl)dimethylammonio]-1-propanesulfonic acid
- PIPES
1,4-piperazinediethanesulfonic acid
- TH
tyrosine hydroxylase
- RT
reverse transcription
- Z
benzyloxycarbonyl
- AFC
N-acetyl-S-farnesyl-L-cysteine
- EMSA
electrophoretic mobility shift assay
- ANOVA
analysis of variance
- Bt2cAMP
dibutyryl cAMP
Footnotes
This work was supported by National Institutes of Health Grants NS40817 and NS053777.
E. M. Chalovich and C. T. Chu, unpublished data.
J. Caltagorone and R. Bowser, unpublished data.
S. M. Kulich and C. T. Chu, unpublished data.
C. T. Chu, unpublished data.
References
- 1.Barnham KJ, Masters CL, Bush AI. Nat Rev Drug Discov. 2004;3:205–214. doi: 10.1038/nrd1330. [DOI] [PubMed] [Google Scholar]
- 2.Beal MF. Ann Neurol. 1995;38:357–366. doi: 10.1002/ana.410380304. [DOI] [PubMed] [Google Scholar]
- 3.Tyurin VA, Tyurina YY, Borisenko GG, Sokolova TV, Ritov VB, Quinn PJ, Rose M, Kochanek P, Graham SH, Kagan VE. J Neurochem. 2000;75:2178–2189. doi: 10.1046/j.1471-4159.2000.0752178.x. [DOI] [PubMed] [Google Scholar]
- 4.Souza JM, Giasson BI, Chen Q, Lee VM, Ischiropoulos H. J Biol Chem. 2000;275:18344–18349. doi: 10.1074/jbc.M000206200. [DOI] [PubMed] [Google Scholar]
- 5.Cassarino DS, Fall CP, Swerdlow RH, Smith TS, Halvorsen EM, Miller SW, Parks JP, Parker WD, Jr, Bennett JP., Jr Biochim Biophys Acta. 1997;1362:77–86. doi: 10.1016/s0925-4439(97)00070-7. [DOI] [PubMed] [Google Scholar]
- 6.Wu DC, Teismann P, Tieu K, Vila M, Jackson-Lewis V, Ischiropoulos H, Przedborski S. Proc Natl Acad Sci U S A. 2003;100:6145–6150. doi: 10.1073/pnas.0937239100. [DOI] [PMC free article] [PubMed] [Google Scholar]
- 7.Callio J, Oury TD, Chu CT. J Biol Chem. 2005;280:18536–18542. doi: 10.1074/jbc.M413224200. [DOI] [PMC free article] [PubMed] [Google Scholar]
- 8.Yang F, Lim GP, Begum AN, Ubeda OJ, Simmons MR, Ambegaokar SS, Chen PP, Kayed R, Glabe CG, Frautschy SA, Cole GM. J Biol Chem. 2005;280:5892–5901. doi: 10.1074/jbc.M404751200. [DOI] [PubMed] [Google Scholar]
- 9.Wu AS, Kiaei M, Aguirre N, Crow JP, Calingasan NY, Browne SE, Beal MF. J Neurochem. 2003;85:142–150. doi: 10.1046/j.1471-4159.2003.01639.x. [DOI] [PubMed] [Google Scholar]
- 10.Ellerby LM, Bredesen DE. Methods Enzymol. 2000;322:413–421. doi: 10.1016/s0076-6879(00)22040-5. [DOI] [PubMed] [Google Scholar]
- 11.Barlow CA, Shukla A, Mossman BT, Lounsbury KM. Am J Respir Cell Mol Biol. 2006;34:7–14. doi: 10.1165/rcmb.2005-0153OC. [DOI] [PMC free article] [PubMed] [Google Scholar]
- 12.Schor NF, Kagan VE, Liang Y, Yan C, Tyurina Y, Tyurin V, Nylander KD. Biochemistry (Mosc) 2004;69:38–44. doi: 10.1023/b:biry.0000016349.75384.e6. [DOI] [PubMed] [Google Scholar]
- 13.Przedborski S, Ischiropoulos H. Antioxid Redox Signal. 2005;7:685–693. doi: 10.1089/ars.2005.7.685. [DOI] [PubMed] [Google Scholar]
- 14.Cohen G, Heikkila RE. JBC. 1974;249:2447–2452. [PubMed] [Google Scholar]
- 15.Kulich SM, Chu CT. J Neurochem. 2001;77:1058–1066. doi: 10.1046/j.1471-4159.2001.00304.x. [DOI] [PMC free article] [PubMed] [Google Scholar]
- 16.Horbinski C, Chu CT. Free Radic Biol Med. 2005;38:2–11. doi: 10.1016/j.freeradbiomed.2004.09.030. [DOI] [PubMed] [Google Scholar]
- 17.Chen G, Bower KA, Ma C, Fang S, Thiele CJ, Luo J. FASEB J. 2004;18:1162–1164. doi: 10.1096/fj.04-1551fje. [DOI] [PubMed] [Google Scholar]
- 18.Choi WS, Eom DS, Han BS, Kim WK, Han BH, Choi EJ, Oh TH, Markelonis GJ, Cho JW, Oh YJ. J Biol Chem. 2004;279:20451–20460. doi: 10.1074/jbc.M311164200. [DOI] [PubMed] [Google Scholar]
- 19.Eminel S, Klettner A, Roemer L, Herdegen T, Waetzig V. J Biol Chem. 2004;279:55385–55392. doi: 10.1074/jbc.M405858200. [DOI] [PubMed] [Google Scholar]
- 20.Asanuma M, Hirata H, Cadet JL. Neuroscience. 1998;85:907–917. doi: 10.1016/s0306-4522(97)00665-9. [DOI] [PubMed] [Google Scholar]
- 21.Barkats M, Millecamps S, Bilang-Bleuel A, Mallet J. J Neurochem. 2002;82:101–109. doi: 10.1046/j.1471-4159.2002.00952.x. [DOI] [PubMed] [Google Scholar]
- 22.Kulich SM, Chu CT. J Biosci. 2003;28:83–89. doi: 10.1007/BF02970136. [DOI] [PMC free article] [PubMed] [Google Scholar]
- 23.Ryu EJ, Angelastro JM, Greene LA. Neurobiol Dis. 2005;18:54–74. doi: 10.1016/j.nbd.2004.08.016. [DOI] [PubMed] [Google Scholar]
- 24.Finkbeiner S. Neuron. 2000;25:11–14. doi: 10.1016/s0896-6273(00)80866-1. [DOI] [PubMed] [Google Scholar]
- 25.Mayr B, Montminy M. Nat Rev Mol Cell Biol. 2001;2:599–609. doi: 10.1038/35085068. [DOI] [PubMed] [Google Scholar]
- 26.Goldberg JL, Barres BA. Annu Rev Neurosci. 2000;23:579–612. doi: 10.1146/annurev.neuro.23.1.579. [DOI] [PubMed] [Google Scholar]
- 27.Hulley P, Hartikka J, Lubbert H. J Neural Transm Suppl. 1995;46:217–228. [PubMed] [Google Scholar]
- 28.Troadec JD, Marien M, Mourlevat S, Debeir T, Ruberg M, Colpaert F, Michel PP. Mol Pharmacol. 2002;62:1043–1052. doi: 10.1124/mol.62.5.1043. [DOI] [PubMed] [Google Scholar]
- 29.Engele J, Franke B. Cell Tissue Res. 1996;286:235–240. doi: 10.1007/s004410050692. [DOI] [PubMed] [Google Scholar]
- 30.Chu CT, Zhu JH, Cao G, Signore A, Wang S, Chen J. J Neurochem. 2005;94:1685–1695. doi: 10.1111/j.1471-4159.2005.03329.x. [DOI] [PMC free article] [PubMed] [Google Scholar]
- 31.Guo X, Dawson VL, Dawson TM. Eur J Neurosci. 2001;13:1683–1693. doi: 10.1046/j.0953-816x.2001.01542.x. [DOI] [PubMed] [Google Scholar]
- 32.Oury TD, Schaefer LM, Fattman CL, Choi A, Weck KE, Watkins SC. Am J Physiol. 2002;283:L777–L784. doi: 10.1152/ajplung.00011.2002. [DOI] [PubMed] [Google Scholar]
- 33.Chandran UR, Attardi B, Friedman R, Zheng Z, Roberts JL, DeFranco DB. J Biol Chem. 1996;271:20412–20420. doi: 10.1074/jbc.271.34.20412. [DOI] [PubMed] [Google Scholar]
- 34.Jordan-Sciutto KL, Dragich JM, Rhodes JL, Bowser R. J Biol Chem. 1999;274:35262–35268. doi: 10.1074/jbc.274.49.35262. [DOI] [PMC free article] [PubMed] [Google Scholar]
- 35.Zhang B, Liu S, Perpetua MD, Walker WH, Harbrecht BG. Hepatology. 2004;39:1343–1352. doi: 10.1002/hep.20200. [DOI] [PubMed] [Google Scholar]
- 36.Zhu JH, Kulich SM, Oury TD, Chu CT. Am J Pathol. 2002;161:2087–2098. doi: 10.1016/S0002-9440(10)64487-2. [DOI] [PMC free article] [PubMed] [Google Scholar]
- 37.Zhu JH, Guo F, Shelburne J, Watkins S, Chu CT. Brain Pathol. 2003;13:473–481. doi: 10.1111/j.1750-3639.2003.tb00478.x. [DOI] [PMC free article] [PubMed] [Google Scholar]
- 38.Klein RL, Lewis MH, Muzyczka N, Meyer EM. Brain Res. 1999;847:314–320. doi: 10.1016/s0006-8993(99)02116-2. [DOI] [PubMed] [Google Scholar]
- 39.Jordan J, Galindo MF, Tornero D, Gonzalez-Garcia C, Cena V. J Neurochem. 2004;89:124–133. doi: 10.1046/j.1471-4159.2003.02299.x. [DOI] [PubMed] [Google Scholar]
- 40.Sanchez S, Sayas CL, Lim F, Diaz-Nido J, Avila J, Wandosell F. J Neurochem. 2001;78:468–481. doi: 10.1046/j.1471-4159.2001.00453.x. [DOI] [PubMed] [Google Scholar]
- 41.See V, Loeffler JP. J Biol Chem. 2001;276:35049–35059. doi: 10.1074/jbc.M104988200. [DOI] [PubMed] [Google Scholar]
- 42.Ito Y, Arakawa M, Ishige K, Fukuda H. Neurosci Res. 1999;35:321–327. doi: 10.1016/s0168-0102(99)00097-8. [DOI] [PubMed] [Google Scholar]
- 43.Stevenson AS, Cartin L, Wellman TL, Dick MH, Nelson MT, Lounsbury KM. Exp Cell Res. 2001;263:118–130. doi: 10.1006/excr.2000.5107. [DOI] [PubMed] [Google Scholar]
- 44.Decker DE, Althaus JS, Buxser SE, VonVoigtlander PF, Ruppel PL. Res Commun Chem Pathol Pharmacol. 1993;79:195–208. [PubMed] [Google Scholar]
- 45.Gomez-Santos C, Ferrer I, Reiriz J, Vinals F, Barrachina M, Ambrosio S. Brain Res. 2002;935:32–39. doi: 10.1016/s0006-8993(02)02422-8. [DOI] [PubMed] [Google Scholar]
- 46.Tiffany-Castiglioni E, Saneto RP, Proctor PH, Perez-Polo JR. Biochem Pharmacol. 1982;31:181–188. doi: 10.1016/0006-2952(82)90208-8. [DOI] [PubMed] [Google Scholar]
- 47.Keller JN, Dimayuga E, Chen Q, Thorpe J, Gee J, Ding Q. Int J Biochem Cell Biol. 2004;36:2376–2391. doi: 10.1016/j.biocel.2004.05.003. [DOI] [PubMed] [Google Scholar]
- 48.Chu CT. J Neuropathol Exp Neurol. 2006;65:423–432. doi: 10.1097/01.jnen.0000229233.75253.be. [DOI] [PMC free article] [PubMed] [Google Scholar]
- 49.Lee J, Kim CH, Simon DK, Aminova LR, Andreyev AY, Kushnareva YE, Murphy AN, Lonze BE, Kim KS, Ginty DD, Ferrante RJ, Ryu H, Ratan RR. J Biol Chem. 2005;280:40398–40401. doi: 10.1074/jbc.C500140200. [DOI] [PMC free article] [PubMed] [Google Scholar]
- 50.Mogi M, Togari A, Kondo T, Mizuno Y, Komure O, Kuno S, Ichinose H, Nagatsu T. Neurosci Lett. 1999;270:45–48. doi: 10.1016/s0304-3940(99)00463-2. [DOI] [PubMed] [Google Scholar]
- 51.Howells DW, Porritt MJ, Wong JY, Batchelor PE, Kalnins R, Hughes AJ, Donnan GA. Exp Neurol. 2000;166:127–135. doi: 10.1006/exnr.2000.7483. [DOI] [PubMed] [Google Scholar]
- 52.Yamada M, Oligino T, Mata M, Goss JR, Glorioso JC, Fink DJ. Proc Natl Acad Sci U S A. 1999;96:4078–4083. doi: 10.1073/pnas.96.7.4078. [DOI] [PMC free article] [PubMed] [Google Scholar]
- 53.Natsume A, Mata M, Goss J, Huang S, Wolfe D, Oligino T, Glorioso J, Fink DJ. Exp Neurol. 2001;169:231–238. doi: 10.1006/exnr.2001.7671. [DOI] [PubMed] [Google Scholar]
- 54.Holtz WA, O’Malley KL. J Biol Chem. 2003;278:19367–19377. doi: 10.1074/jbc.M211821200. [DOI] [PubMed] [Google Scholar]
- 55.Chu CT, Levinthal DJ, Kulich SM, Chalovich EM, DeFranco DB. Eur J Biochem. 2004;271:2060–2066. doi: 10.1111/j.1432-1033.2004.04132.x. [DOI] [PMC free article] [PubMed] [Google Scholar]
- 56.Ostrerova N, Petrucelli L, Farrer M, Mehta N, Choi P, Hardy J, Wolozin B. J Neurosci. 1999;19:5782–5791. doi: 10.1523/JNEUROSCI.19-14-05782.1999. [DOI] [PMC free article] [PubMed] [Google Scholar]
- 57.Petit A, Kawarai T, Paitel E, Sanjo N, Maj M, Scheid M, Chen F, Gu Y, Hasegawa H, Salehi-Rad S, Wang L, Rogaeva E, Fraser P, Robinson B, St George-Hyslop P, Tandon A. J Biol Chem. 2005;280:34025–34032. doi: 10.1074/jbc.M505143200. [DOI] [PubMed] [Google Scholar]
- 58.Castro-Obregon S, Rao RV, del Rio G, Chen SF, Poksay KS, Rabizadeh S, Vesce S, Zhang XK, Swanson RA, Bredesen DE. J Biol Chem. 2004;279:17543–17553. doi: 10.1074/jbc.M312363200. [DOI] [PubMed] [Google Scholar]
- 59.Yuan J, Lipinski M, Degterev A. Neuron. 2003;40:401–413. doi: 10.1016/s0896-6273(03)00601-9. [DOI] [PubMed] [Google Scholar]
- 60.Mabuchi T, Kitagawa K, Kuwabara K, Takasawa K, Ohtsuki T, Xia Z, Storm D, Yanagihara T, Hori M, Matsumoto M. J Neurosci. 2001;21:9204–9213. doi: 10.1523/JNEUROSCI.21-23-09204.2001. [DOI] [PMC free article] [PubMed] [Google Scholar]
- 61.Grewal SS, Fass DM, Yao H, Ellig CL, Goodman RH, Stork PJ. J Biol Chem. 2000;275:34433–34441. doi: 10.1074/jbc.M004728200. [DOI] [PubMed] [Google Scholar]
- 62.Impey S, Obrietan K, Wong ST, Poser S, Yano S, Wayman G, Deloulme JC, Chan G, Storm DR. Neuron. 1998;21:869–883. doi: 10.1016/s0896-6273(00)80602-9. [DOI] [PubMed] [Google Scholar]
- 63.Harootunian AT, Adams SR, Wen W, Meinkoth JL, Taylor SS, Tsien RY. Mol Biol Cell. 1993;4:993–1002. doi: 10.1091/mbc.4.10.993. [DOI] [PMC free article] [PubMed] [Google Scholar]
- 64.Nucifora FC, Jr, Sasaki M, Peters MF, Huang H, Cooper JK, Yamada M, Takahashi H, Tsuji S, Troncoso J, Dawson VL, Dawson TM, Ross CA. Science. 2001;291:2423–2428. doi: 10.1126/science.1056784. [DOI] [PubMed] [Google Scholar]
- 65.Wang Z, Zhang B, Wang M, Carr BI. J Biol Chem. 2003;278:11138–11144. doi: 10.1074/jbc.M209108200. [DOI] [PubMed] [Google Scholar]
- 66.Livak KJ, Schmittgen TD. Methods (San Diego) 2001;25:402–408. doi: 10.1006/meth.2001.1262. [DOI] [PubMed] [Google Scholar]
- 67.Jordan-Sciutto KL, Wang G, Murphy-Corb M, Wiley CA. Am J Pathol. 2000;157:497–507. doi: 10.1016/S0002-9440(10)64561-0. [DOI] [PMC free article] [PubMed] [Google Scholar]
- 68.Rozen S, Skaletsky HJ. In: Bioinformatics Methods and Protocols: Methods in Molecular Biology. Krawetz S, Misenar S, editors. Humana Press; Totowa, NJ: 2000. pp. 365–386. [Google Scholar]
- 69.Tokuyama W, Hashimoto T, Li YX, Okuno H, Miyashita Y. Brain Res Mol Brain Res. 1998;62:206–215. doi: 10.1016/s0169-328x(98)00261-7. [DOI] [PubMed] [Google Scholar]


