

Abstract
Aβ-induced neurodegeneration is limited in APP and APP+PS1 transgenic mice. In middle-aged APP+PS1 transgenic mice, we found significantly increased Bcl-2 expression. The increase in Bcl-2 is restricted to amyloid-containing brain regions and is not found at young ages, suggesting that Aβ deposition is the stimulus for increased Bcl-2. Western blot results were confirmed with immunohistochemistry, and qRT-PCR. In addition, we found that APP transgenic mice were protected from neurotoxicity caused by an injection of bak BH3 fusion peptides, known to induce apoptosis by antagonizing bcl protein activity. Nissl and fluorojade stained slides showed that the active bak BH3 peptide caused substantial neuronal loss in the dentate gyrus and CA3 regions of nontransgenic, but not APP mice. The inactive mutant bak BH3 peptide did not cause degeneration in any mice. These data demonstrate that the increased Bcl-2 expression in brain regions containing Aβ deposits is associated with neuroprotection.
Keywords: Bax, APP+PS1 transgenic mice, Alzheimer’s disease, neurotoxicity, Aβ, apoptosis
The amyloid cascade hypothesis states that the dysregulation of amyloid precursor protein (APP) processing and Aβ production are the major causes for neuronal death and dysfunction leading to dementia in Alzheimer’s disease (Hardy and Selkoe, 2002). Genetic and environmental factors, such as APP or PS-1 mutations, cause an accumulation of Aβ which forms diffuse and compact plaques. These plaques are thought to cause oxidative stress, activate microglia and astrocytes, causing cytokine release, inflammation and altered ionic homeostasis, culminating in cytotoxicity and neuronal death.
The Aβ peptide can directly induce neuronal apoptosis in vitro (Pike et al., 1993); (Hensley et al., 1995); (Schubert and Chevion, 1995); (Wogulis et al., 2005). Intracellular Aβ may activate apoptosis by interacting with the endoplasmic reticulum and endosomes and by binding to alcohol dehydrogenase within the mitochondria (Dickson, 2004). Aβ also induces changes in nitric oxide production and mitochondrial activity facilitating apoptosis (Keil et al., 2004). In vitro studies have shown that Aβ provokes a significant down-regulation of antiapoptotic proteins such as Bcl-2, Bcl-xl and Bcl-w and a significant up regulation of proapoptotic proteins such as bax (Yao et al., 2005).
Aβ-induced neuronal toxicity is limited in the APP transgenic mouse models of AD. A modest reduction in hippocampal neurons was found in old APP23 mice, but the cortical neuron census was unaffected despite extensive amyloid deposition (Calhoun et al., 1999). Several attempts in the Tg2576 and PDAPP lines have failed to detect significant changes in neuron number with amyloid deposition (Irizarry et al., 1997b); (Irizarry et al., 1997a); (Takeuchi et al., 2000). Given the established toxicity of Aβ to cultured neurons, the lack of neuronal death in APP overexpressing mice has been perplexing.
Bcl-2 is the prototypical anti-apoptotic member of a large family of proteins involved in the modulation of cell death (Chao and Korsmeyer, 1998). The members of the Bcl-2 family possess sequence homology in several regions termed BH1, BH2, BH3, and BH4. The BH1-3 domains form a cleft that acts as a binding region for the BH3 domain of another protein member of the Bcl-2 family, thus allowing the formation of homodimers or heterodimers. Depending on the proteins involved, dimerization may cause cell survival or cell death. An effort to antagonize the anti-apoptotic action of Bcl-2 like proteins led to the development of synthetic BH3-like peptides that bind the BH1-3 domain cleft of Bcl-2 proteins, thus inhibiting the dimerization of Bcl-2 to pro-apoptotic members of the Bcl family such as Bax or Bak (Zong et al., 2001);(Polster et al., 2001);(Kaufmann et al., 2001). Fusion of the BH3 domain from Bak with the internalization domain of the Antennapedia homeodomain protein permits penetration of the BH3 domain through cell membranes (Holinger et al., 1999). If antiapoptotic Bcl-2 proteins are antagonized sufficiently, the apoptotic cascade can be induced. In this study, we evaluated the expression levels of the primary neuroprotective factor, Bcl-2, in an effort to understand the reason for the resistance to Aβ-promoted neuronal death in APP and APP+PS1 transgenic mice.
Materials & Methods
Transgenic Mice
All APP Tg2576-derived (Hsiao et al., 1996) mice, and those crossed with PS1 line 5.1 transgenic mice (Duff et al., 1996) mice were bred in our facility at the University of South Florida and genotyped using previously described methods (Holcomb et al., 1998); (Gordon et al., 2002). All mouse litters contain nontransgenic, APP, APP+PS1 and PS1 mice, permitting use of littermates for genotype comparisons whenever possible.
Tissue Protein Fractionation and Western Blot Analysis
Brain tissue used for western blot analysis was perfused with 0.9% saline and the brain was removed. The right side of the brain was rapidly dissected over ice and frozen.: Protein extraction was carried out using Biovision inc. (Mountain View, CA, USA) Cytosolic/Nuclear fractionation kit. Briefly, 100 mg of frozen tissue was weighed out and resuspended in 500μL cold PBS. Tissue was disrupted using a Dounce cell homogenizer (20 strokes) and then centrifuged at 800 × g for 5 min at 4°C. The pellet was washed twice with cold PBS (no Mg or Ca) and was re-suspended in hypotonic buffer CEB A. Following incubation on ice for 10 min, CEB B (detergent) was added to the sample, set on ice 1min, vortexed and spun at 830 × g for 10 minutes at 4C. The supernatant was collected and saved for cytosolic/mitochondria protein separation while the nuclear pellet was resuspended in SDS lysis buffer (5mM EDTA, 50mM Tris and 2% SDS), sonicated for 15 sec and after 20 min incubation on ice spun at 15,500g for 22min at 4C. The resulting supernatant was saved as the nuclear protein extract. To collect mitochondrial proteins, first the cytosolic supernatant was spun at 1,000 × g 10min at 4°C to remove remaining nuclei from sample. Following this the supernatant was transferred to a new tube and spun at 20,800 × g for 30 min at 4°C. The resulting pellet was resuspended in SDS lysis buffer (5mM EDTA, 50mM Tris and 2% SDS) and sonicated 15 seconds. The supernatant was then transferred to a separate tube and saved as the cytosolic/mitochondrial protein extract.
Protein concentrations from nuclear and cytosolic fractions were quantified using a BCA kit (Pierce) according to the manufacturer’s instructions, and stored at −80°C for use in western blot analysis. Fifty μg of protein extracts were diluted in 4× SDS loading buffer (each 100 ml of buffer contain: 3 g Tris; 8 g SDS; 2.5 g DTT; 0.05 g Bromophenol blue; 40% [v:v] glycerol) and loaded onto a 15% SDS-polyacrylamide denaturing gel. After electrophoresis (1–2 hours at 50 mA), the gel was blotted onto a PVDF nitrocellulose membrane by overnight electrophoretic transfer at 20V. After preblocking in 5% milk in TBS with 0.1% tween 20, membranes were incubated for one hour with the primary antibody (Bcl-2 or Bax rabbit polyclonal 1:3000, Santa Cruz Biotechnology, Santa Cruz). Membranes were then incubated for one hour in horseradish peroxidase-linked secondary antibody (Biorad). Immunoreactive bands were detected by a chemoluminescent Western blot detection kit (Amersham) according to the manufacturer’s instruction and then exposed to film which was developed for later densitometric analysis using Alpha Ease software (Alpha Innotech Corporation). All membranes were re-probed (without stripping) with an anti-β-actin antibody (Santa Cruz Biotechnology, Santa Cruz) to assess protein loading in each lane.
One group of APP mice and three groups of APP+PS1 Tg mice were used for this experiment. The APP mice were 18 months old, consisting of 7 APP and 7 nontransgenic mice. The youngest group of APP+PS1 mice was 2 months of age and consisted of 5 transgenic and 6 nontransgenic mice. The second group of APP+PS1 mice was 6 months of age and consisted of 8 transgenic and 5 nontransgenic mice. A third group of APP+PS1 mice was 16 months of age at sacrifice and consisted of 10 transgenic mice and 8 nontransgenic mice. The sixteen month group was part of another study investigating the use of cimetidine, which had no effect on amyloid load (Ambegaoankar et al., 2004). Furthermore, there was no effect of cimetidine on Bcl-2 peptide levels. When the cimetidine treated mice are excluded, the increase in Bcl-2 remained (APP+PS1 mean ± sem = 1.10 ± 0.06, n = 5; nontransgenic 0.28 ± 0.01, n = 5; P < 0.001 by t test). The contralateral hemispheres from these same mice were used for histopathological analysis.
Histopathological Analysis
Sixteen month old APP+PS1 and aged matched nontransgenic mice were studied. On the day of sacrifice, the mice were weighed and overdosed with 100mg/kg of pentobarbital (Nembutal sodium solution; Abbott Laboratories). Mice were intracardially perfused with 25ml of 0.9% saline. The brain was removed, the right hemisphere dissected as above and the left hemisphere was immersion fixed in 4% neutral buffered paraformaldehyde for 24 hours. Prior to sectioning, the hemispheres were cryoprotected by sequential incubations in 10%, 20% and 30% sucrose solutions. Horizontal sections of 25μm thickness were collected using a sliding microtome and stored at 4 °C in Dulbecco’s PBS pH 7.4 with 1mM sodium azide, to prevent microbial growth. A series of eight tissue sections spaced 300 μm apart were stained for Bcl-2 (UpState Biotechnology, Lake Placid, NY) at a concentration of 1:10,000 using free-floating immunohistochemistry methods as previously described (Gordon et al., 2002). Some sections were counterstained with a 0.2% Congo Red solution in NaCl-saturated 80% ethanol to assess the location of compact amyloid plaques. The brains from the mice treated with the bak BH3 fusion peptide were stained for the detection of pyknotic, degenerating neurons using cresyl violet (Nissl) and fluorojade (Ye et al., 2001).
The immunohistochemical reaction product was measured using computer-assisted image analysis software (Image Pro Plus, MediaCybernectics, Silver Spring, MD). Positively labeled cells were segmented using hue, saturation, and intensity (HSI). For the study described here, the segmentation thresholds were established so that only the more intensely stained cell somata would be identified. Once established, the segmentation criteria remained constant for the entire analysis (no user editing). Data are expressed as percentage of the image field area positively stained by immunochemical reaction product. Each section was imaged at 100× magnification in the anterior cerebral cortex, hippocampus, and thalamus. One microscopic field was used for the anterior cerebral cortex and thalamus from each section, and was localized using anatomical landmarks. For the hippocampus, three microscope fields were imaged, centered on the molecular layers of the CA1 and CA3 subfields, and in the hilar region between the granule cell layers of the upper and lower blades of the dentate gyrus. For each brain region, all images from each mouse were averaged to represent a single value for each brain region. Groups are presented as +SEM..Histochemical and RNA measurements were analyzed by ANOVA followed by Fischer’ LSD means comparisons using Stat View software version 5.0.1 (SAS Institute Inc, Cary, NC).
Immunofluorescent Histochemistry
A series of eight horizontal sections of 25μm thickness were stained using similar free-floating immunohistochemistry methods as described above. Briefly, sections were incubated overnight for Bcl-2 (UpState Biotechnology, Lake Placid, NY at a concentration of 1:10,000), MAP2 (Abcam, Cambridge, MA at a concentration of 1:1000) and GFAP (Zymed San Francisco, CA at a concentration of 1:1000). The sections were then washed and incubated with fluorescent secondary antibodies (Alexa Fluor 594 and 488 at a concentration of 1:1000;) for 1 hour. Samples were viewed with an inverted Olympus IX71/IX51 research microscope. Argon and HeNe laser lines in conjunction with 488 and 555 band pass filters were applied to excite the samples using line switching to minimize crosstalk between fluorochromes. Vectashield (Vector Labs) mounting medium with DAPI was employed to locate cell nuclei. The images were captured using a DP70 digital microscope camera and merged using DP-BSW Olympus version 02.01 software.
Quantitative RT-PCR
Total RNA was prepared from dissected hippocampal tissue from a separate series of 18 month old APP+PS1 transgenic mice (n=8) and age matched nontransgenic mice (n=8). Quantitative reverse transcription polymerase chain reaction was performed as described previously (Dickey et al., 2003). Briefly, 5 ng of total RNA samples were reverse transcribed with MMLV reverse transcriptase and 1M betaine. RNA from all samples used in the study were pooled to produce a standard curve covering 3 logs of RNA concentration. Triplicate experimental wells contained 12.5 μl SYBR Green master mix (ABI), 2 μl of cDNA, 300 nM of species-specific forward and reverse primers and water to a volume of 25μl per PCR reaction. Two-step PCR was performed on the MJ Research Opticon (Boston, MA) as follows; 1 cycle of 95°C for 15 minutes followed by 40 cycles of 95°C for 15 seconds and 60–65°C for 1 minute. A linear regression was performed and the slope, relating Ct to log ng RNA, was calculated, and converted to a mass quantity of standard RNA. These mass values for the genes of interest were then divided by 18S ribosomal RNA mass values of the same reverse transcription reaction to determine fold-change in expression relative to the standard RNA pool. Bcl-2 primer pairs used were; LEFT PRIMER 5′ tcgcagagatgtccagtcag 3′; RIGHT PRIMER 5′ cctgaagagttcctccacca 3′; PRODUCT SIZE: 83, Annealing Temp = 62.5°C.
Bak BH3 Peptide Intracranial Injections
The active and mutant bak BH3 fusion peptides were purchased from Calbiochem (San Diego). The peptides fuse the BH3 (Bcl-2 homology 3) domain from bak with the Antennapedia internalization domain to promote cell permeabilization. The BH3 domain binds to Bcl-2 and Bcl-xl and antagonizes their cell survival promoting function. The inactive peptide contains a mutation which prevents dimerization and inactivation of Bcl-2 proteins, but controls for nonspecific effects of vehicle, injection, and protein internalization. Five hundred micrograms of lyophilized active and inactive bak BH3 peptides were dissolved in 5ul of DMSO and diluted with normal saline to a concentration of 113 μM. The final concentration of DMSO was 0.5%.
Fifteen nontransgenic and thirteen APP transgenic mice aged 19 months were divided into two groups. One group, 7 nontransgenic and 7 APP transgenic mice, received a single right intrahippocampal injection of bak BH3 fusion peptide. The second group, 8 nontransgenic and 6 APP transgenic mice, received a single right intrahippocampal injection of mutated (inactive) bak BH3 Fusion Peptide (Calbiochem). All mice were given a dose of 2 μg in 2 μl of the bak BH3 peptides (dose arrived at from pilot studies in nontransgenic animals) using stereotactic guidance under isoflurane anesthesia (DiCarlo et al., 2001). Both active and inactive bak BH3 peptides were dissolved in DMSO and diluted to 0.5% DMSO final concentration. Tissues were collected 7 days after intrahippocampal injections.
Results
In 18 month old APP mice, western analysis of Bcl-2 revealed a single band with an apparent MW of 27 KDa MW in cytosolic fractions of the posterior cortex and cerebellum (Fig 1). The intensity of this band was increased 50% in APP mice relative to nontransgenic mice in the cortical cytosolic fractions (after normalization to β-actin; Fig 1A). No increase in Bcl-2 signal was found in the cerebellum of APP transgenic mice, indicating that the elevated Bcl-2 expression was restricted to regions of the brain with amyloid deposits (Fig 1B).
Figure 1.

Western blot analysis of Bcl-2 in 18 month old APP transgenic mice and age-matched nontransgenic (Non-Tg) littermates. The blots for Bcl-2 and β-actin are shown in panel A for posterior cortex (left) and cerebellum (right). The quantification of these is shown in panel B. Significance compared to Nontransgenic mice is taken from t-test analysis. Data are mean ± sem.
In APP+PS1 mice, larger elevations in Bcl-2 were obtained than in APP mice. Western blot analysis of Bcl-2 protein levels were performed on cytosolic and nuclear protein extracts from the posterior cortex and brain stem of APP+PS1 transgenic and nontransgenic mice at 2, 6, and 16 months of age (Fig 2). These ages were chosen according to the extent of Aβ deposition, with no amyloid present at 2 months, small but consistent amounts at 6 months and abundant amounts of amyloid deposition at 16 months (Gordon et al., 2002). Western blot analysis showed that Bcl-2 expression was up-regulated in the cytosolic fraction of cortical tissue from 16 mo APP+PS1 mice compared to nontransgenic mice. However, at 2 and 6 month of age, there was not a significant elevation of Bcl-2, indicating that the Bcl-2 induction did not appear until after the first deposits have formed. Bcl-2 expression was absent in the nuclear fraction of cortical tissue (data not shown). Furthermore, an assay of tissue from the brainstem, a region lacking amyloid deposits, revealed similar levels of Bcl-2 expression in APP+PS1 transgenic and nontransgenic animals. Western blots were also probed for Bax, NFκB p65, phospho-Bad, iNOS and nNOS, but none of these were modified by genotype in the samples from 16 mo old APP+PS1 mice (Table 1).
Figure 2.
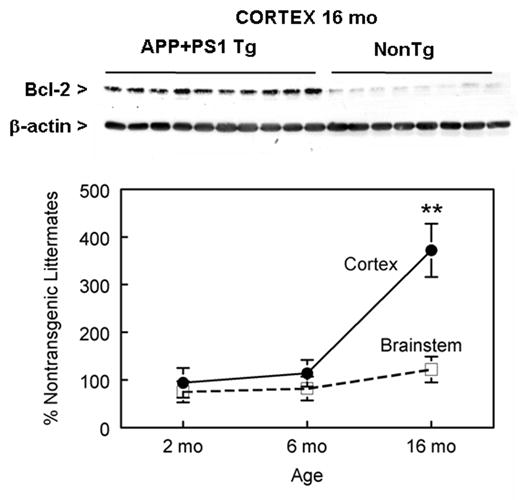
Bcl-2 expression in the cytosolic fraction of APP+PS1 mice between 2 and 16 months of age. The western blot shown on top is representative of Bcl-2 expression in 16 month old APP+PS1 mice cortex. Blot was re-probed for β-actin to verify for equal protein loading in each lane. Western analysis of APP+PS1 cortex and brainstem were quantified and expressed as the percent of the mean value for age-matched nontransgenic animals. ** P < 0.001 compared to nontransgenic mice. Values are mean ± sem.
Table 1.
Western Analysis of APP+PS1 mouse brain tissue (percent of age-matched nontransgenic mouse values)
| Measure | Posterior Cortex | Brainstem |
|---|---|---|
| Bax (2 mo) | 83 ± 54% | 137 ± 28% |
|
| ||
| Bax (6 mo)
Bax (16 mo) |
33 ± 46
125 ± 78 |
88 ± 13
161 ± 50 |
|
| ||
| NFκB p65 (16 mo) | 87 ± 19 | 104 ± 10 |
|
| ||
| Bad (16 mo) | 123 ± 32 | n.a. |
|
| ||
| phospho Bad (16 mo) | 96 ± 7 | n.a. |
|
| ||
| nNOS (16 mo) | 101 ± 12 | 128 ± 26 |
Values are mean ± sem
n.a.: not assayed
At the age of 16 months, APP+PS1 mice histologically show a substantial amount of deposited Aβ in both the diffuse and compacted states (Gordon et al., 2002). Bcl-2 immunohistochemical analysis in the nontransgenic and APP+PS1 transgenic mice showed positive stain primarily in the somatic regions within neurons. Positive stain was observed in neurons in widespread brain regions, although the heaviest immunochemical reaction appeared within the granule cell and pyramidal cell layers of the dentate gyrus and CA1-3 regions of the hippocampus (Fig 3). Quantification of the percent area that was positively labeled for Bcl-2 in the cerebral cortex, hippocampus, and thalamus are presented in figure 4. APP+PS1 transgenic mice had a 2-fold increase in Bcl-2 expression in both the cortex and hippocampus, areas which also contain amyloid. Importantly, this elevation does not appear to have a direct association with the amyloid deposits (indicated by stars in Figs 3B and 3D) and appeared to be within the neurons rather than glial cells. Double immunofluorescent labeling with Bcl-2 and MAP2 (a neuronal marker) demonstrated colocalization of bcl-2 with neuronal cytoplasm (Fig 5), while double labeling with Bcl-2 and GFAP showed minimal colocalization with astrocytes in the molecular layer of the hippocampus ( which contains few neurons; Fig 6). Bcl-2 expression in regions lacking amyloid deposition, such as the thalamus, exhibited no change between the nontransgenic and APP+PS1 transgenic mice (Fig 4).
Figure 3.
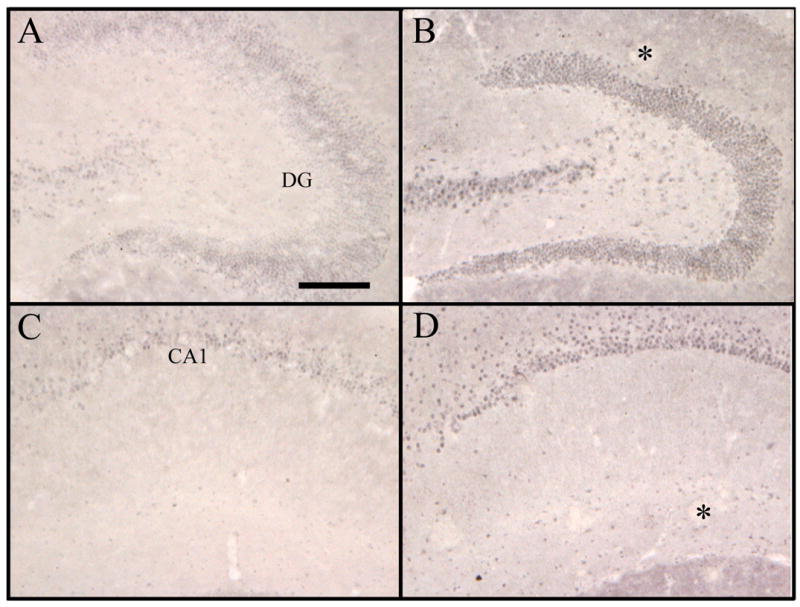
Immunocytochemistry for Bcl-2 in the dentate gyrus and CA1 regions of APP+PS1 mouse hippocampus. Sections were prepared from nontransgenic (panels A and C) or transgenic (panels B and D) mice aged 16 months. The microscope field encompassed the dentate gyrus in panels A and B (indicated by DG), the CA1 pyramidal cell layer is pictured in panels C and D (indicated by CA1). The * marks regions of negatively-stained material demonstrated on other sections to correspond to Congo red-stained deposits in the outer molecular layer of dentate or near the hippocampal fissure. Scale bar = 50 μm.
Figure 4.
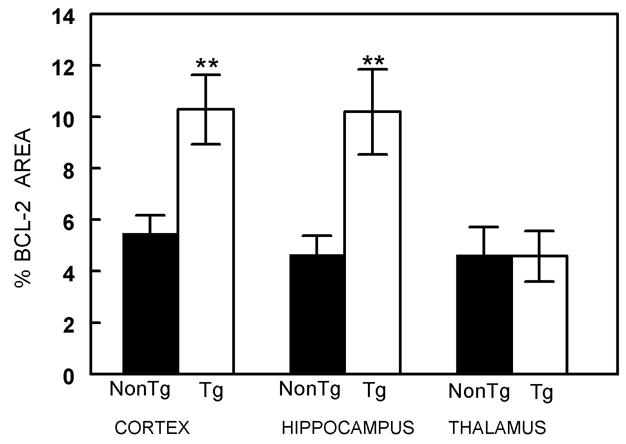
Increased immunocytochemical reaction product for Bcl-2 in 16 mo APP+PS1 transgenic mice. The graph shows percent area occupied by positive stain for Bcl-2 in frontal cortex, hippocampus and thalamus of nontransgenic (NonTg) and doubly transgenic (APP+PS1) mice. (mean+SEM) ** indicates P<0.01 when compared to the same brain region in nontransgenic mice and compared to both doubly transgenic and nontransgenic mice in the thalamus.
Figure 5.
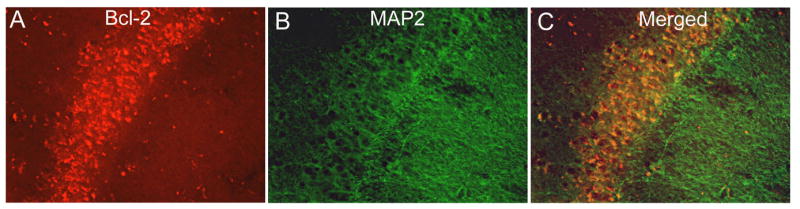
Colocalization of bcl-2 with neurons in APP mice. APP mouse brain sections were immunofluorescently labeled to reveal bcl-2 (red) in the molecular layer of the hippocampus (Panel A). Panel B shows MAP2 (green) labeled neurons in the pyramidal layer of the hippocampus. Panel C shows the micrographs merged to show colocalization of Bcl-2 in the cytoplasm of neurons (yellow regions represent colocalization). Micrographs were taken at 400× final magnification.
Figure 6.
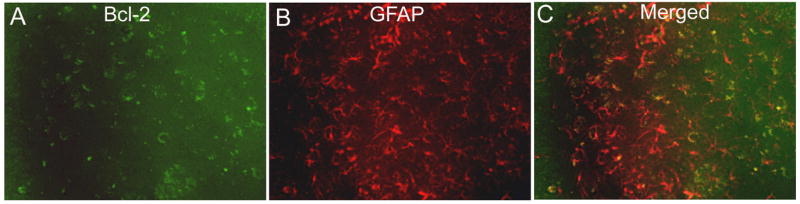
Minor localization of bcl-2 in astrocytes in APP mice. APP mouse brain sections were immunofluorescently labeled to reveal bcl-2 (green) in the molecular layer of the hippocampus (Panel A). Panel B shows GFAP (red) labeled astrocytes in the molecular layer of the hippocampus. Panel C shows the micrographs merged to show that Bcl-2 is not colocalized in the cytoplasm of astrocytes. Micrographs were taken at 400× final magnification.
To evaluate whether Bcl-2 was altered at a transcriptional level, we quantified Bcl-2 mRNA using qRT-PCR. We found that the expression of Bcl-2 mRNA was up-regulated 25% in the hippocampi of 18 mo APP+PS1 transgenic mice compared to the age matched nontransgenic mice (Fig 7).
Figure 7.
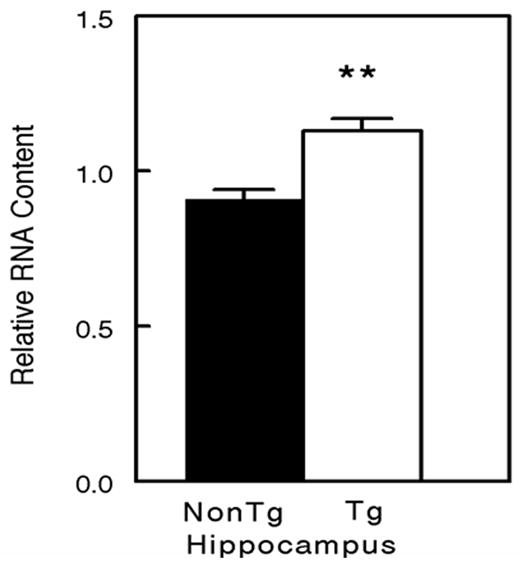
Bcl-2 mRNA is increased in the hippocampi of APP+PS1 transgenic mice. mRNA levels were measured by real time reverse-transcription PCR and expressed as the mRNA level relative to the RNA standard pool. ** P < 0.01 comparing transgenic (Tg) with nontransgenic (Non-Tg) mice..
In addition to the increased expression of Bcl-2 in response to amyloid deposition, we found that APP transgenic mice were resistant to neurodegeneration induced by hippocampal injections of a bak BH3 fusion peptide, a peptide that antagonizes the anti-apoptotic actions of Bcl-2 proteins and induces apoptosis. APP transgenic and age-matched nontransgenic mice were intracranially injected with active bak BH3 peptide and control peptide. The control peptide contained a single point mutation in the BH3 domain of the peptide that abolishes its apoptotic activity. Neurodegeneration was revealed by nissl staining (fig 8) as well as using fluorojade (fig 9). For the nissl figures, we show sections from nontransgenic mice (panels A, B) compared with APP transgenic mice (panels C, D). As expected, the bak BH3 mutant peptide was inactive and no signs of toxicity were detected in either the nontransgenic mice or APP transgenic mice using either Nissl stain (Fig 8A and 8C) or fluorojade stain (data not shown). However, the active bak BH3 Fusion peptide caused apoptosis in the nontransgenic mice. Six out of 7 nontransgenic mice showed substantial neurotoxicity in the dentate gyrus and CA4 region of the hippocampus, whether assessed by Nissl (Fig 8B) or fluorojade (Fig 9B, D, F, H, J, L,). This apoptotic activity was detected in only one of the seven APP transgenic mice, with all other APP mice showing no signs of degeneration (Figs 8D and 9A, C, E, G, I, K,).
Figure 8.
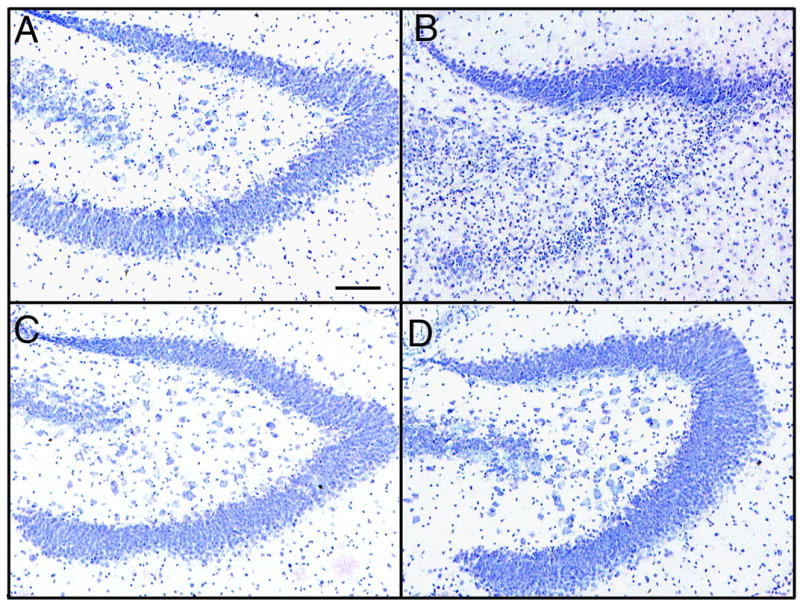
Degeneration caused by bak BH3 peptides in APP transgenic mice detected by Nissl staining. Panels A,B show Nissl staining in hippocampal regions of nontransgenic mice while hippocampal micrographs from transgenic mice are in panels C and D. Mice in panels A and C were injected with the mutant (inactive) bak BH3 peptide. Mice in panels B and D received the active bak BH3 peptide. Many small, pyknotic nuclei are present in the lower limb of the dentate gyrus, and in the hilar region only in panel B (nontransgenic). The scale bar in panel A represents 50μm.
Figure 9.
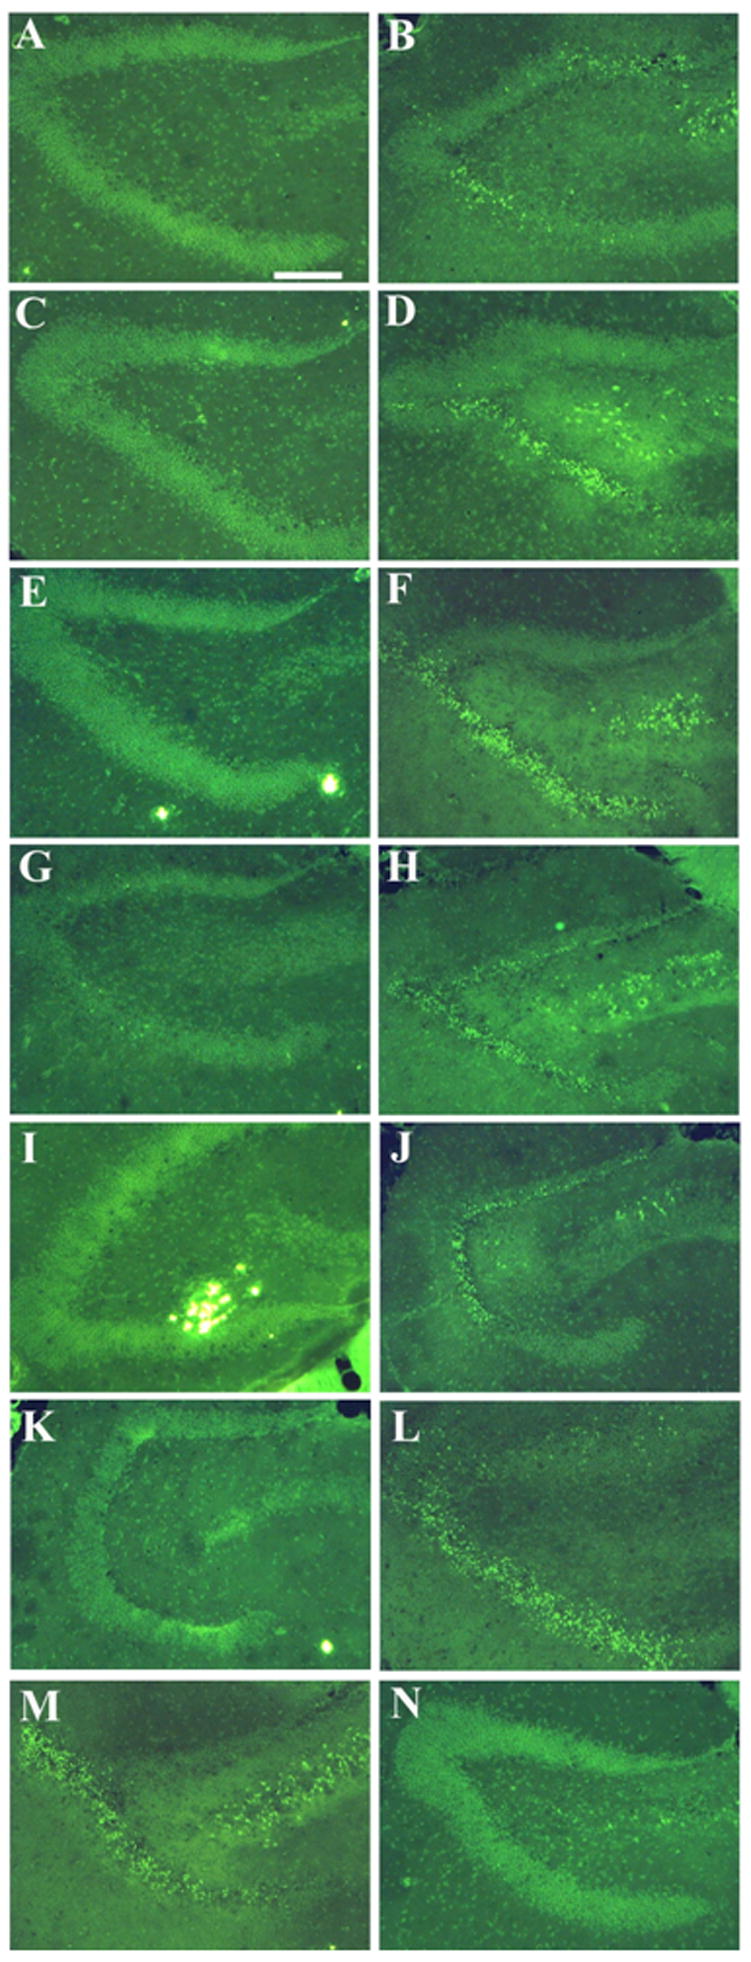
Degeneration caused by bak BH3 peptides in APP transgenic mice detected by Fluorojade staining. Panels A,C,E,G,I,K,M show fluorojade staining in hippocampal regions of APP transgenic mice and nontransgenic mice are in panels B,D,F,H,J,L,N.. All mice received the active Bak BH3 peptide. Note degeneration indicated with arrows (brightly stained cells) in the lower limb and hilar regions in panels B,D,F,H,J,L (nontransgenic, active peptide) and the lack of neurodegeneration in panels A,C,E,G,I,K (APP transgenic, active peptide). Panels M and N show the exception from each group where the transgenic mouse showed neurotoxicity while the nontransgenic mouse lacked neurotoxicity. The scale bar in panel A represents 50μm.
Discussion
The major observation in this report is that Bcl-2 expression is significantly elevated in amyloid containing brain regions of mice overexpressing APP. This increase is primarily localized to neurons and is largely cytosolic. Although an exhaustive survey was not undertaken, the increase in Bcl-2 is not associated with widespread changes in a number of other proteins related to regulation of programmed cell death, suggesting a shift in balance towards neuron survival. This conclusion was further supported by administering the apoptosis inducing bak BH3 fusion peptide to challenge cell survival. Thus, in mice, it appears that Aβ deposition induces a protective response in neurons, possibly explaining the absence of toxicity in mouse amyloid deposition models despite extensive amyloid deposits.
The bak BH3 fusion peptide inactivates the cell survival promoting Bcl-2 proteins by dimerization (Holinger et al., 1999). Intracranial injections of this peptide resulted in neuronal loss in the nontransgenic mice, which was largely absent in the age-matched APP transgenic mice. Nissl stain showed pyknotic cells within the granule cell layer of the dentate gyrus and in CA4 (hilar) regions of the hippocampus. Fluorojade showed positively labeled, dying cells in the same regions. The mutated form of bak BH3, used as a control, was inactive, arguing that the actions of the bak BH3 peptide were specific to its binding to Bcl proteins. These results indicate that the increase in Bcl-2 in amyloid-containing regions of APP mice function effectively to protect neurons.
Analysis of proapoptotic and antiapoptotic proteins in vitro and in vivo have found that an increase in Bcl-2, Bcl-w, or Bcl-xl lead to neuronal resistance against apoptotic and oxidative injury (Merry and Korsmeyer, 1997). In vitro studies show that increasing survival promoting members of the Bcl family, specifically Bcl-2, can protect neuron-like cells from Aβ induced toxicity (Deng et al., 1999); (Saille et al., 1999); (Song et al., 2004). These observations led us to suspect that a similar condition might exist in the transgenic mouse brain. Increased Bcl-w, another survival promoting Bcl protein, protects neuroblastoma cells from Aβ-induced apoptosis (Zhu et al., 2004); (Yao et al., 2005), as does Bcl-xl (Tan et al., 1999); (Luetjens et al., 2001). Although subtoxic Aβ exposure of cultured neuron-like cells has been reported to up-regulate Bcl-xl (Luetjens et al., 2001), toxic doses of Aβ dramatically reduce several anti-apoptotic Bcl proteins in neuron cultures (Yao et al., 2005).
Bcl-2 has also been examined in human postmortem AD brains. Initial studies found increased Bcl-2 in AD hippocampus (Satou et al., 1995). Although this was indicated as occurring in neurons, an increased staining in reactive astrocytes near deposits was also reported. Subsequent studies confirmed the glial localization of increased Bcl-2 in AD. O’Barr et al (1996) saw 3 fold increases in Bcl-2 in AD brain by immunoblot, which they attributed primarily due to changes in astrocytes (from immunocytochemical analyses). Tortosa et al (1998) reported no increase in neuronal Bcl-2, nor any differences between neurons with or without neurofibrillary pathology, but did note an increased Bcl-2 staining in reactive glial cells near plaques. Kitamura et al (1998) found increased Bcl-2 in membrane fractions from AD cortex, but no changes in cytosolic fractions. Engidawork et al (2001) found increased Bcl-2 by ELISA in AD cerebellum, but the cortical increase did not reach statistical significance. Vyas et al (1997) saw no changes in expression of Bcl-2 in neurons of the nucleus basalis in AD. The conclusions from these studies would argue that there is an increase in Bcl-2 expression in AD, however, this is most strongly associated with reactive glial cells near plaques, and seems more associated with membrane than cytosolic fractions.
These changes are different from those found in the APP transgenic mouse brain, where increased expression appears to be more widespread and encompasses most neurons within an amyloid-burdened region. The increases appear largely restricted to neurons, and primarily in the cytosol. In AD brain, overexpression of Bax was found in dystrophic neurites of neurons, which may play a role in neuritic degeneration near senile plaques (Tortosa et al., 1998), (Kitamura et al., 1998). We were unable to detect consistent changes in Bax expression in APP+PS1 transgenic mice. Thus, at least within neurons, the available evidence suggests a pro-apoptotic state in AD brain (increased Bax, no change Bcl-2), and an anti-apoptotic state in transgenic mice (increased Bcl-2, no change in Bax).
Stein and Johnson (2002) observed a similar anti-apoptotic state in amyloid-containing regions of 6 and 12 month old Tg2576 mice when they compared gene expression profiles from the hippocampi and cerebellum to age-matched controls. This group showed that the expression of a number of protective genes (IGF-2, Akt, Erk1/2, and TTR) and a protective pathway culminating in Bad phosphorylation were increased in both preplaque (6 months) and postplaque (12 months) brains of Tg2576 mice (Stein and Johnson 2002). Our study failed to show phospho-Bad up regulation in APP transgenic mouse posterior cortex. In addition, the increase in protective genes/proteins, that we examined, appeared after the deposition of Aβ plaques. The increased expression of phospho-bad described in Stein et al., was demonstrated via a qualitative immunohistochemical analysis on hippocampal sections of APP transgenic mice and nontransgenic control mice. Our analysis of phospho-bad was executed with western blots from posterior cortex homogenates, possibly explaining the discrepancy. Despite the differences found in phospho-Bad expression, both studies imply that the lack of neurodegeneration in Tg2576 mice is a result of the activation of known cell survival pathways.
There are many possible explanations for the high expression levels of neuroprotective factors in APP mouse brains. Oxidative stressors such as hydrogen peroxide were found to increase Bcl-xl expression in PC-12 cells (Luetjens et al., 2001). TGF-β was shown to increase Bcl-2 and Bcl-xl expression, but did not affect Bax expression and did not prevent Aβ neurotoxicity in several neuronal lines (Kim et al., 1998). Increased expression of Bcl-2 was observed in the CNS of aged rats in response to oxidative stress (Kaufmann et al., 2001). This Bcl-2 increase in aged rats, however, led mostly to nuclear-localized Bcl-2, which was unable to provide protection from apoptosis (Kaufmann et al., 2003). Our results show that cytosolic Bcl-2 is up regulated in amyloid-burdened regions of APP+PS1 mice, but not in regions lacking Aβ deposits. Given the reports of increased oxidative activity in APP mouse brain (Smith et al., 1998); (Pratico et al., 2001) and numerous reports of microglial activation responses near the amyloid plaques (Morgan et al., 2005), it is conceivable that the increased Bcl-2 is a response to these neuronal stressors. Whether the localization of bcl-2 as a result of a stressor, for example the cytosolic localization of Aβ-induced Bcl-2 in APP mice or free radical-induced Bcl-2 in older rats, is dependent on the age of the animals at the time of onset remains to be established.
The larger question regards the absence of a consistent increase, at least for Bcl-2, in the neurons of AD patients. Is there an early anti-apoptotic response in human patients that has resolved or has become aborted? Is there a significant difference in the regulation of these cell survival factors across species? Would up-regulation of survival promoting Bcl-2 family members improve the symptoms of AD? In this context, it was recently shown that the acetylcholinesterase inhibitor galantamine increased the expression of Bcl-2 via increased alpha-7 nicotinic receptor activity (Geerts, 2005). Further characterization of these responses may reveal novel and effective targets for treatment of Aβ-induced neurodegeneration in AD.
Supplementary Material
Acknowledgments
This work was supported by AG 15490 and 18478 to DM and MNG and by a Sealy Endowed Fund for Biomedical Research Development Grant to GT. DM also receives salary support from AG25711 and NS 48355. RK is the Thorne Scholar for Alzheimer’s Research. DW is the Benjamin fellow for Alzheimer’s Research. We thank Karen Hsiao Ashe and Karen Duff for early access to the APP and APP+PS1 mice.
Abbreviations
- Tg
Transgenic
- NTg
nontransgenic
- AD
Alzheimer’s Disease
- Bcl-2
B-cell CLL/lymphoma 2
- APP
Amyloid Precursor Protein
- PS1
Presenilin 1
Footnotes
Publisher's Disclaimer: This is a PDF file of an unedited manuscript that has been accepted for publication. As a service to our customers we are providing this early version of the manuscript. The manuscript will undergo copyediting, typesetting, and review of the resulting proof before it is published in its final citable form. Please note that during the production process errors may be discovered which could affect the content, and all legal disclaimers that apply to the journal pertain.
Reference List
- Ambegaoankar MU, Nagle AS, Breitner JC, DeLeon J, Alamed J, Wilson N, Morgan D, Gordon MN. The Histamine H2 receptor Antagonist Cimetidine activates microglia in APP+PS1 transgenic Mice. Brain Aging. 2004;4.2:34–40. [Google Scholar]
- Calhoun ME, Burgermeister P, Phinney AL, Stalder M, Tolnay M, Wiederhold KH, Abramowski D, Sturchler-Pierrat C, Sommer B, Staufenbiel M, Jucker M. Neuronal overexpression of mutant amyloid precursor protein results in prominent deposition of cerebrovascular amyloid. Proc Natl Acad Sci U S A. 1999;96:14088–14093. doi: 10.1073/pnas.96.24.14088. [DOI] [PMC free article] [PubMed] [Google Scholar]
- Chao DT, Korsmeyer SJ. BCL-2 family: regulators of cell death. Annu Rev Immunol. 1998;16:395–419. doi: 10.1146/annurev.immunol.16.1.395. [DOI] [PubMed] [Google Scholar]
- Deng G, Su JH, Ivins KJ, Van Houten B, Cotman CW. Bcl-2 facilitates recovery from DNA damage after oxidative stress. Exp Neurol. 1999;159:309–318. doi: 10.1006/exnr.1999.7145. [DOI] [PubMed] [Google Scholar]
- DiCarlo G, Wilcock D, Henderson D, Gordon M, Morgan D. Intrahippocampal LPS injections reduce Abeta load in APP+PS1 transgenic mice. Neurobiol Aging. 2001;22:1007–1012. doi: 10.1016/s0197-4580(01)00292-5. [DOI] [PubMed] [Google Scholar]
- Dickey CA, Loring JF, Montgomery J, Gordon MN, Eastman PS, Morgan D. Selectively reduced expression of synaptic plasticity-related genes in amyloid precursor protein + presenilin-1 transgenic mice. J Neurosci. 2003;23:5219–5226. doi: 10.1523/JNEUROSCI.23-12-05219.2003. [DOI] [PMC free article] [PubMed] [Google Scholar]
- Dickson DW. Apoptotic mechanisms in Alzheimer neurofibrillary degeneration: cause or effect? J Clin Invest. 2004;114:23–27. doi: 10.1172/JCI22317. [DOI] [PMC free article] [PubMed] [Google Scholar]
- Duff K, Eckman C, Zehr C, Yu X, Prada CM, Perez-tur J, Hutton M, Buee L, Harigaya Y, Yager D, Morgan D, Gordon MN, Holcomb L, Refolo L, Zenk B, Hardy J, Younkin S. Increased amyloid-beta42(43) in brains of mice expressing mutant presenilin 1. Nature. 1996;383:710–713. doi: 10.1038/383710a0. [DOI] [PubMed] [Google Scholar]
- Engidawork E, Gulesserian T, Seidl R, Cairns N, Lubec G. Expression of apoptosis related proteins in brains of patients with Alzheimer’s disease. Neurosci Lett. 2001;303:79–82. doi: 10.1016/s0304-3940(01)01618-4. [DOI] [PubMed] [Google Scholar]
- Geerts H. Indicators of neuroprotection with galantamine. Brain Res Bull. 2005;64:519–524. doi: 10.1016/j.brainresbull.2004.11.002. [DOI] [PubMed] [Google Scholar]
- Gordon MN, Holcomb LA, Jantzen PT, DiCarlo G, Wilcock D, Boyett KW, Connor K, Melachrino J, O’Callaghan JP, Morgan D. Time course of the development of Alzheimer-like pathology in the doubly transgenic PS1+APP mouse. Exp Neurol. 2002;173:183–195. doi: 10.1006/exnr.2001.7754. [DOI] [PubMed] [Google Scholar]
- Hardy J, Selkoe DJ. The amyloid hypothesis of Alzheimer’s disease: progress and problems on the road to therapeutics. Science. 2002;297:353–356. doi: 10.1126/science.1072994. [DOI] [PubMed] [Google Scholar]
- Hensley K, Butterfield DA, Mattson M, Aksenova M, Harris M, Wu JF, Floyd R, Carney J. A model for beta-amyloid aggregation and neurotoxicity based on the free radical generating capacity of the peptide: implications of “molecular shrapnel” for Alzheimer’s disease. Proc West Pharmacol Soc. 1995;38:113–120. [PubMed] [Google Scholar]
- Holcomb L, Gordon MN, McGowan E, Yu X, Benkovic S, Jantzen P, Wright K, Saad I, Mueller R, Morgan D, Sanders S, Zehr C, O’Campo K, Hardy J, Prada CM, Eckman C, Younkin S, Hsiao K, Duff K. Accelerated Alzheimer-type phenotype in transgenic mice carrying both mutant amyloid precursor protein and presenilin 1 transgenes. Nat Med. 1998;4:97–100. doi: 10.1038/nm0198-097. [DOI] [PubMed] [Google Scholar]
- Holinger EP, Chittenden T, Lutz RJ. Bak BH3 peptides antagonize Bcl-xL function and induce apoptosis through cytochrome c-independent activation of caspases. J Biol Chem. 1999;274:13298–13304. doi: 10.1074/jbc.274.19.13298. [DOI] [PubMed] [Google Scholar]
- Hsiao K, Chapman P, Nilsen S, Eckman C, Harigaya Y, Younkin S, Yang F, Cole G. Correlative memory deficits, Abeta elevation, and amyloid plaques in transgenic mice. Science. 1996;274:99–102. doi: 10.1126/science.274.5284.99. [DOI] [PubMed] [Google Scholar]
- Irizarry MC, McNamara M, Fedorchak K, Hsiao K, Hyman BT. APPSw transgenic mice develop age-related A beta deposits and neuropil abnormalities, but no neuronal loss in CA1. J Neuropathol Exp Neurol. 1997a;56:965–973. doi: 10.1097/00005072-199709000-00002. [DOI] [PubMed] [Google Scholar]
- Irizarry MC, Soriano F, McNamara M, Page KJ, Schenk D, Games D, Hyman BT. Abeta deposition is associated with neuropil changes, but not with overt neuronal loss in the human amyloid precursor protein V717F (PDAPP) transgenic mouse. J Neurosci. 1997b;17:7053–7059. doi: 10.1523/JNEUROSCI.17-18-07053.1997. [DOI] [PMC free article] [PubMed] [Google Scholar]
- Kaufmann JA, Bickford PC, Taglialatela G. Oxidative-stress-dependent up-regulation of Bcl-2 expression in the central nervous system of aged Fisher-344 rats. J Neurochem. 2001;76:1099–1108. doi: 10.1046/j.1471-4159.2001.00118.x. [DOI] [PubMed] [Google Scholar]
- Kaufmann JA, Perez M, Zhang W, Bickford PC, Holmes DB, Taglialatela G. Free radical-dependent nuclear localization of Bcl-2 in the central nervous system of aged rats is not associated with Bcl-2-mediated protection from apoptosis. J Neurochem. 2003;87:981–994. doi: 10.1046/j.1471-4159.2003.02092.x. [DOI] [PubMed] [Google Scholar]
- Keil U, Bonert A, Marques CA, Scherping I, Weyermann J, Strosznajder JB, Muller-Spahn F, Haass C, Czech C, Pradier L, Muller WE, Eckert A. Amyloid beta-induced changes in nitric oxide production and mitochondrial activity lead to apoptosis. J Biol Chem. 2004;279:50310–50320. doi: 10.1074/jbc.M405600200. [DOI] [PubMed] [Google Scholar]
- Kim ES, Kim RS, Ren RF, Hawver DB, Flanders KC. Transforming growth factor-beta inhibits apoptosis induced by beta-amyloid peptide fragment 25–35 in cultured neuronal cells. Brain Res Mol Brain Res. 1998;62:122–130. doi: 10.1016/s0169-328x(98)00217-4. [DOI] [PubMed] [Google Scholar]
- Kitamura Y, Shimohama S, Kamoshima W, Ota T, Matsuoka Y, Nomura Y, Smith MA, Perry G, Whitehouse PJ, Taniguchi T. Alteration of proteins regulating apoptosis, Bcl-2, Bcl-x, Bax, Bak, Bad, ICH-1 and CPP32, in Alzheimer’s disease. Brain Res. 1998;780:260–269. doi: 10.1016/s0006-8993(97)01202-x. [DOI] [PubMed] [Google Scholar]
- Luetjens CM, Lankiewicz S, Bui NT, Krohn AJ, Poppe M, Prehn JH. Up-regulation of Bcl-xL in response to subtoxic beta-amyloid: role in neuronal resistance against apoptotic and oxidative injury. Neuroscience. 2001;102:139–150. doi: 10.1016/s0306-4522(00)00458-9. [DOI] [PubMed] [Google Scholar]
- Merry DE, Korsmeyer SJ. Bcl-2 gene family in the nervous system. Annu Rev Neurosci. 1997;20:245–267. doi: 10.1146/annurev.neuro.20.1.245. [DOI] [PubMed] [Google Scholar]
- Morgan D, Gordon MN, Tan J, Wilcock D, Rojiani AM. Dynamic complexity of the microglial activation response in transgenic models of amyloid deposition: implications for Alzheimer therapeutics. J Neuropathol Exp Neurol. 2005;64:743–753. doi: 10.1097/01.jnen.0000178444.33972.e0. [DOI] [PubMed] [Google Scholar]
- O’Barr S, Schultz J, Rogers J. Expression of the protooncogene bcl-2 in Alzheimer’s disease brain. Neurobiol Aging. 1996;17:131–136. doi: 10.1016/0197-4580(95)02024-1. [DOI] [PubMed] [Google Scholar]
- Pike CJ, Burdick D, Walencewicz AJ, Glabe CG, Cotman CW. Neurodegeneration induced by beta-amyloid peptides in vitro: the role of peptide assembly state. J Neurosci. 1993;13:1676–1687. doi: 10.1523/JNEUROSCI.13-04-01676.1993. [DOI] [PMC free article] [PubMed] [Google Scholar]
- Polster BM, Kinnally KW, Fiskum G. BH3 death domain peptide induces cell type-selective mitochondrial outer membrane permeability. J Biol Chem. 2001;276:37887–37894. doi: 10.1074/jbc.M104552200. [DOI] [PubMed] [Google Scholar]
- Pratico D, Uryu K, Leight S, Trojanoswki JQ, Lee VM. Increased lipid peroxidation precedes amyloid plaque formation in an animal model of Alzheimer amyloidosis. J Neurosci. 2001;21:4183–4187. doi: 10.1523/JNEUROSCI.21-12-04183.2001. [DOI] [PMC free article] [PubMed] [Google Scholar]
- Saille C, Marin P, Martinou JC, Nicole A, London J, Ceballos-Picot I. Transgenic murine cortical neurons expressing human Bcl-2 exhibit increased resistance to amyloid beta-peptide neurotoxicity. Neuroscience. 1999;92:1455–1463. doi: 10.1016/s0306-4522(99)00089-5. [DOI] [PubMed] [Google Scholar]
- Satou T, Cummings BJ, Cotman CW. Immunoreactivity for Bcl-2 protein within neurons in the Alzheimer’s disease brain increases with disease severity. Brain Res. 1995;697:35–43. doi: 10.1016/0006-8993(95)00748-f. [DOI] [PubMed] [Google Scholar]
- Schubert D, Chevion M. The role of iron in beta amyloid toxicity. Biochem Biophys Res Commun. 1995;216:702–707. doi: 10.1006/bbrc.1995.2678. [DOI] [PubMed] [Google Scholar]
- Smith MA, Hirai K, Hsiao K, Pappolla MA, Harris PL, Siedlak SL, Tabaton M, Perry G. Amyloid-beta deposition in Alzheimer transgenic mice is associated with oxidative stress. J Neurochem. 1998;70:2212–2215. doi: 10.1046/j.1471-4159.1998.70052212.x. [DOI] [PubMed] [Google Scholar]
- Song YS, Park HJ, Kim SY, Lee SH, Yoo HS, Lee HS, Lee MK, Oh KW, Kang SK, Lee SE, Hong JT. Protective role of Bcl-2 on beta-amyloid-induced cell death of differentiated PC12 cells: reduction of NF-kappaB and p38 MAP kinase activation. Neurosci Res. 2004;49:69–80. doi: 10.1016/j.neures.2004.01.010. [DOI] [PubMed] [Google Scholar]
- Stein TD, Johnson JA. Lack of neurodegeneration in transgenic mice overexpressing mutant amyloid precursor protein is associated with increased levels of transthyretin and the activation of cell survival pathways. J Neurosci. 2002;22:7380–7388. doi: 10.1523/JNEUROSCI.22-17-07380.2002. [DOI] [PMC free article] [PubMed] [Google Scholar]
- Taglialatela G, Kaufmann JA, Trevino A, Perez-Polo JR. Central nervous system DNA fragmentation induced by the inhibition of nuclear factor kappa B. Neuroreport. 1998a;9:489–493. doi: 10.1097/00001756-199802160-00024. [DOI] [PubMed] [Google Scholar]
- Taglialatela G, Perez-Polo JR, Rassin DK. Induction of apoptosis in the CNS during development by the combination of hyperoxia and inhibition of glutathione synthesis. Free Radic Biol Med. 1998b;25:936–942. doi: 10.1016/s0891-5849(98)00131-2. [DOI] [PubMed] [Google Scholar]
- Takeuchi A, Irizarry MC, Duff K, Saido TC, Hsiao AK, Hasegawa M, Mann DM, Hyman BT, Iwatsubo T. Age-related amyloid beta deposition in transgenic mice overexpressing both Alzheimer mutant presenilin 1 and amyloid beta precursor protein Swedish mutant is not associated with global neuronal loss. Am J Pathol. 2000;157:331–339. doi: 10.1016/s0002-9440(10)64544-0. [DOI] [PMC free article] [PubMed] [Google Scholar]
- Tan J, Town T, Placzek A, Kundtz A, Yu H, Mullan M. Bcl-X(L) inhibits apoptosis and necrosis produced by Alzheimer’s beta-amyloid1-40 peptide in PC12 cells. Neurosci Lett. 1999;272:5–8. doi: 10.1016/s0304-3940(99)00525-x. [DOI] [PubMed] [Google Scholar]
- Tortosa A, Lopez E, Ferrer I. Bcl-2 and Bax protein expression in Alzheimer’s disease. Acta Neuropathol (Berl) 1998;95:407–412. doi: 10.1007/s004010050817. [DOI] [PubMed] [Google Scholar]
- Vyas S, Javoy-Agid F, Herrero MT, Strada O, Boissiere F, Hibner U, Agid Y. Expression of Bcl-2 in adult human brain regions with special reference to neurodegenerative disorders. J Neurochem. 1997;69:223–231. doi: 10.1046/j.1471-4159.1997.69010223.x. [DOI] [PubMed] [Google Scholar]
- Wogulis M, Wright S, Cunningham D, Chilcote T, Powell K, Rydel RE. Nucleation-dependent polymerization is an essential component of amyloid-mediated neuronal cell death. J Neurosci. 2005;25:1071–1080. doi: 10.1523/JNEUROSCI.2381-04.2005. [DOI] [PMC free article] [PubMed] [Google Scholar]
- Yao M, Nguyen TV, Pike CJ. Beta-amyloid-induced neuronal apoptosis involves c-Jun N-terminal kinase-dependent downregulation of Bcl-w. J Neurosci. 2005;25:1149–1158. doi: 10.1523/JNEUROSCI.4736-04.2005. [DOI] [PMC free article] [PubMed] [Google Scholar]
- Ye X, Carp RI, Schmued LC, Scallet AC. Fluoro-Jade and silver methods: application to the neuropathology of scrapie, a transmissible spongiform encephalopathy. Brain Res Brain Res Protoc. 2001;8:104–112. doi: 10.1016/s1385-299x(01)00086-1. [DOI] [PubMed] [Google Scholar]
- Zhu X, Wang Y, Ogawa O, Lee HG, Raina AK, Siedlak SL, Harris PL, Fujioka H, Shimohama S, Tabaton M, Atwood CS, Petersen RB, Perry G, Smith MA. Neuroprotective properties of Bcl-w in Alzheimer disease. J Neurochem. 2004;89:1233–1240. doi: 10.1111/j.1471-4159.2004.02416.x. [DOI] [PubMed] [Google Scholar]
- Zong WX, Lindsten T, Ross AJ, MacGregor GR, Thompson CB. BH3-only proteins that bind pro-survival Bcl-2 family members fail to induce apoptosis in the absence of Bax and Bak. Genes Dev. 2001;15:1481–1486. doi: 10.1101/gad.897601. [DOI] [PMC free article] [PubMed] [Google Scholar]
Associated Data
This section collects any data citations, data availability statements, or supplementary materials included in this article.