Abstract
Controller proteins such as C.AhdI regulate the expression of bacterial restriction–modification genes, and ensure that methylation of the host DNA precedes restriction by delaying transcription of the endonuclease. The operator DNA sequence to which C.AhdI binds consists of two adjacent binding sites, OL and OR. Binding of C.AhdI to OL and to OL + OR has been investigated by circular permutation DNA-bending assays and by circular dichroism (CD) spectroscopy. CD indicates considerable distortion to the DNA when bound by C.AhdI. Binding to one or two sites to form dimeric and tetrameric complexes increases the CD signal at 278 nm by 40 and 80% respectively, showing identical local distortion at both sites. In contrast, DNA-bending assays gave similar bend angles for both dimeric and tetrameric complexes (47 and 38°, respectively). The relative orientation of C.AhdI dimers in the tetrameric complex and the structural role of the conserved Py-A-T sequences found at the centre of C-protein-binding sites are discussed.
INTRODUCTION
Restriction–modification (R–M) systems encode a DNA methyltransferase and an endonuclease. The methyltransferase (MTase) methylates specific bases within the DNA recognition sequence; the restriction endonuclease (ENase) cleaves DNA that is unmethylated at these sites, whilst host DNA is methylated and avoids restriction (1). This defence mechanism prevents incorporation of foreign DNA into the host and thus acts as a primitive form of ‘immune system’.
To avoid the possibility of ENase activity occurring prior to methylation of the host DNA, the system must be temporally regulated and ENase expression delayed until such time as the MTase has modified all potential host target sites. It is found that many R–M systems contain an additional gene coding for a small protein (the controller, or C, protein) (2–12) that regulates ENase expression (and may also, in some cases, modulate expression of the MTase).
The C-proteins bind to a control sequence upstream of the C-gene, which, in turn, is located upstream of the ENase (R) gene, such that the C and R genes are transcribed as one operon. High levels of transcription from the PvuII C/R promoter require C-protein expression (13) and C-dependent transcriptional regulation has been reported for other R–M systems (7,12,14). In addition, a weak C-independent promoter has been reported in PvuII (13), which would allow subsequent transcription from the C-dependent promoter. In AhdI, both C-dependent and C-independent transcription have also been demonstrated (K. Severinov, personal communication).
The high-resolution structure of C.AhdI from the R–M system of Aeromonas hydrophila was the first to be reported (15). The structure reveals a largely alpha-helical dimeric protein, including a helix-turn-helix motif responsible for DNA sequence recognition. Efficient binding to DNA requires dimerization of C.AhdI (16). However, since the interaction between the two subunits of the dimer is weak (Kd = 2.5 µM), expression of C.AhdI (and thus R.AhdI) from this promoter cannot be established until sufficiently high concentrations of C.AhdI have accumulated (via expression from the weak C-independent promoter) to favour protein dimerization (16). C.AhdI dimers then bind to the C/R operator and activate transcription from the strong C-dependent promoter, leading to an exponential increase in C-protein (and thus the endonuclease) by positive feedback. It is clear that a mechanism for switching off transcription is also required in any such positive feedback system.
We have previously shown that the controller protein C.AhdI binds cooperatively to a sequence about 30 bp upstream of its own gene (16,17). This sequence contains a quasi-symmetrical repeating sequence resembling that found upstream of many C-genes in a variety of type II R–M systems (6,13). EMSA and analytical ultracentrifugation studies have shown that C.AhdI forms dimeric and tetrameric complexes on the promoter, and the binding constants for these interactions have been established (17). It was proposed that the binding of C.AhdI dimers at the distal site (OL) upstream of the C-gene activates transcription of the C and R genes, through interaction with the σ-70 subunit of RNA polymerase bound at the adjacent −35 site, whereas subsequent binding of the C-protein to the proximal (OR) site (overlapping the −35 site) to form tetramers represses transcription from this operon (17). Binding of C.AhdI to the proximal site may provide the required mechanism for subsequently switching off transcription of its own gene, and thus also down-regulating R.AhdI, to avoid overproduction of the endonuclease (17).
There is no experimentally derived structure available for the C.AhdI–promoter complex, although models have been discussed (17). The 15-bp spacing between the two binding sites would suggest that the dimers may be bound to opposite faces of the DNA helix. However, both bending and twisting of DNA can be important features in protein–DNA complexes (18). Any large conformational changes (bending or twisting) induced in the DNA would significantly affect the relative orientation of dimers and thus their intermolecular contacts in the DNA–protein complex.
Here, we report the results of DNA-bending assays and circular dichroism (CD) experiments to identify possible changes in the conformation of the DNA upon formation of dimeric and tetrameric nucleoprotein complexes. Since binding to both operator sites in the native promoter is highly cooperative, it is difficult to find experimental conditions where only a single dimer is bound to the DNA. Consequently, as well as the natural sequence containing both binding sites (35WT), for each experiment we have also used a mutated version of the natural 35 bp operator in which one operator sequence (OR) is changed to a non-specific sequence, since this DNA sequence (35L) does not readily form tetrameric complexes (17).
MATERIALS AND METHODS
Expression and purification of C.AhdI
C.AhdI was expressed and purified according to the methods previously described by Streeter et al. (16). Following over-expression of C.AhdI in E. coli BL21 (DE3) cells, DNA was dissociated from bound proteins by addition of 1M NaCl. C.AhdI was then precipitated by addition of 30% w/v (NH4)2SO4, resuspended, dialysed and purified on a heparin column. C.AhdI was then further purified by isoelectric precipitation, followed by cation exchange chromatography using an SP Sepharose column and size exclusion chromatography. Where required, the protein was concentrated by an additional SP Sepharose step using a salt step gradient. Purity at each step was determined by Tris-tricine SDS-PAGE. The concentration of the protein was determined by UV absorption at 276 nm, using the theoretical extinction coefficient of 2900 M−1 · cm−1.
Preparation of DNA samples
DNA-binding studies required the use of pure DNA duplexes of accurately measured concentration. DNA duplexes were formed and purified using a Superdex™ 75 10/30 high-resolution column and the concentration of the resulting duplexes was measured by UV absorption at 260 nm. The extinction coefficients used for 35WT and 35L duplexes were 497 568 and 545 276 M−1 · cm−1, as calculated from the base composition and the measured hypochromicity of the duplexes (17).
Cloning of the C.AhdI-binding site into a pBend vector
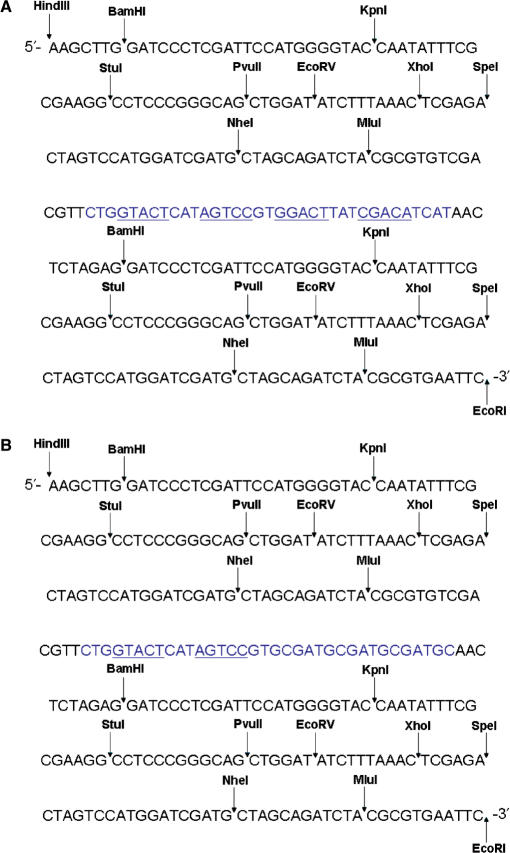
The vector, pBend5 (19), was used to generate fragments for DNA-bending assays. pBend5 contains a HpaI site to allow blunt-end ligation of the protein-binding site into a site at the centre of the EcoRI–HindIII fragment (Figure 1). Here, 35-bp DNA duplexes corresponding to the complete (OL + OR) and the left (OL) operator sequences were inserted into the pBend5 vector by HpaI digestion of the pBend5 fragment and blunt-end ligation. Successful insertion of the binding sites was verified by EcoRI–HindIII digestion of the resulting plasmids, where insertion of the binding site increases the fragment size from 242 to 277 bp. DNA sequencing subsequently confirmed the successful insertion of the fragments and identified their orientation.
Figure 1.
Insertion of the C.AhdI-binding sites (A) 35WT and (B) 35L into pBEND5. The restriction sites of the enzymes used are shown. The inserted sequence is shown in grey and the operator sites are underlined.
Bending assay
Equal-sized restriction fragments containing the protein-binding sites at one of nine locations within the DNA were generated by digestion with MluI, NheI, SpeI, XhoI, EcoRV, PvuII, StuI, KpnI or BamHI. The position of these restriction sites relative to those of the 35WT and 35L sequences within the EcoRI-HindIII fragment is shown in Figure 1. The resulting EcoRV fragment contains the binding site in the middle, whereas the MluI and BamHI fragments contain the binding site near either end of the fragment. Individual fragments were purified by gel extraction and the concentration determined by UV spectroscopy. Each DNA fragment (250 nM) was incubated with equal volumes of 1 μM C.AhdI in 10 mM Tris-HCl, pH 8.5, and the mixtures were incubated at 4°C for 30 min; the resulting complexes were analysed on a 10% non-denaturing polyacrylamide gel and DNA bands were detected by EtBr staining.
Circular dichroism
CD spectra were recorded on a π* −180 spectrometer (Applied Photophysics) which was continuously purged with nitrogen gas. The temperature of the samples was maintained at 20.0 ± 0.1°C using a Peltier temperature block. The instrument was calibrated for ellipticity units (in millidegrees) and wavelength (in nm) using camphor sulphonic acid at 290.5 nm and the xenon fine structure in the region 460–490 nm, respectively. Due to the solvent conditions (40 mM Na citrate pH5.6, 100 mM NaCl, 1 mM EDTA), the wavelength scans were limited to 360–230 nm in all cases with the slits set to 2 nm on the monochromator. All data were acquired at 1-nm intervals with the number of sampling set to 10 500 operating in conjunction with the adaptive sampling, set to error ± 0.01 and maximum sampling 500 000. In addition, each sample was scanned four times and the resultant data was signal averaged. Smoothing was not required for this data set as the signal to noise was excellent. Concentrations of DNA and protein were determined from the UV absorption at 260 and 276 nm, respectively.
All measurements were recorded with a path length of 4 mm at 20°C. Spectra of the buffer were recorded and subtracted for each sample spectrum recorded. The baseline at 360 nm was then set to zero to remove cell surface/positioning and instrumental variations. An aliquot of 1 ml of DNA was pipetted into a Hellma 119.004F-QS strain-free cuvette for both 35WT and 35L experiments. Aliquots of protein (50 μM C.AhdI) were then added and CD spectra (360–230 nm) recorded on each addition and corrected for dilution. Finally, protein spectra were run from 360 to 230 nm and confirmed that C.AhdI only contributed to the CD spectrum below 250 nm.
For thermal stability studies, CD melting curves were recorded for the free DNA (35WT) and for C.AhdI complexes at 2:1 and 4:1 protein:DNA ratios in the above buffer. The temperature was ramped from 2 to 90°C at a rate of 0.3°C/min. The CD signal at 274 nm was recorded every 0.1°C.
RESULTS
DNA bending by C.AhdI
The electrophoretic mobility of bent DNA depends on the position of the bend (20). A number of vectors have been constructed to allow determination of the degree of protein-induced DNA bending from EMSA experiments (19). The bending vector, pBend5, contains a 242 bp EcoRI-HindIII fragment that consists of duplicated restriction sites, separated by single XbaI, HpaI and SalI sites (Figure 1). A DNA-binding sequence can be cloned into the middle of this fragment, with one series of restriction sites on either side. Digestion of the resulting plasmid with any of these restriction enzymes results in fragments of equal size, but with the DNA-binding site situated at different positions, either in the middle of the fragment or towards its ends. If the DNA is bent when the protein binds, the fragment with the binding site located near the end should be the least retarded.
In order to investigate binding of a C.AhdI dimer and a C.AhdI tetramer to the left (OL) and complete (OL + OR) operators, respectively, a bending assay was performed using two DNA-binding sequences: the 35L sequence consisting of the native OL sequence but with the OR sequence mutated and the native 35WT sequence, in which both OL and OR are intact. We have previously shown that 35L binds a single dimer of C.AhdI, whereas 35WT binds two C.AhdI dimers in a highly cooperative manner (17). Thus DNA bending by dimeric and tetrameric complexes can be compared.
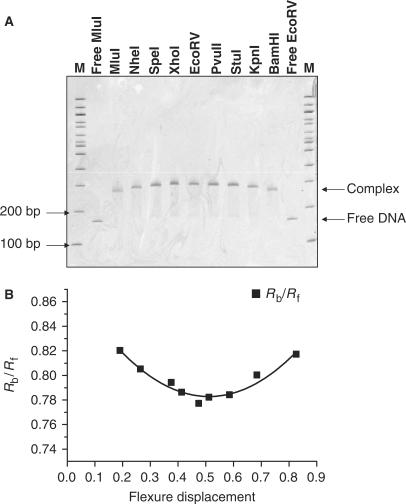
Gel retardation analysis of the fragments containing the complete C.AhdI operator sequence reveals clear retardation of the fragment containing 35WT positioned in the centre, the extent of retardation decreasing symmetrically as the binding site is positioned nearer the ends of the fragment (Figure 2). The mobilities of each of the DNA fragments in the absence of protein were similar, indicating that there is no intrinsic bending of the DNA prior to protein–DNA complex formation.
Figure 2.
DNA bending by C.AhdI tetramers. (A) Native polyacrylamide gel electrophoresis of C.AhdI bound to a 158-bp fragment with the binding site (35WT) located at different positions. Samples are run adjacent to 100-bp DNA ladders (M) and free MluI and EcoRV DNA fragments. (B) Plot of the relative band mobilities against flexure displacement and associated fit.
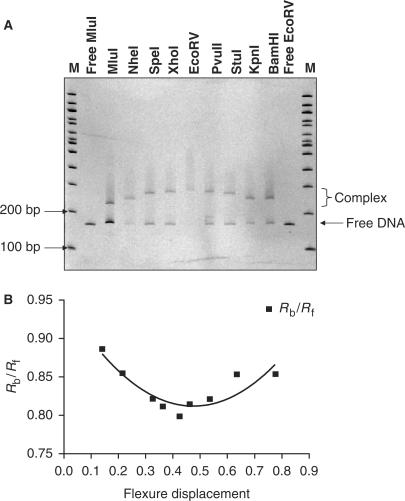
Similarly, analysis of binding to the left C.AhdI operator (35L) also indicated bending of DNA upon protein binding, since the mobility was gradually retarded as the protein-binding site was moved towards the middle of the DNA fragment (Figure 3). As with 35WT, 35L also demonstrated minimum mobility when in the middle of the EcoRV-digested fragment. However, the mobility of the bands was not entirely symmetrical for the two apparently equivalent fragments. The equivalent MluI and BamHI fragments in which the left operator is located at opposing ends of the DNA fragment had different mobilities, with the BamHI fragment being more retarded than that of MluI. This is caused by the displacement of OL from the centre of the 35L insertion. Thus, the centre of the protein-binding site is some 17 bp closer to the end of the MluI fragment than in the BamHI fragment, resulting in a greater mobility in the former case.
Figure 3.
DNA bending by C.AhdI dimers. (A) Native polyacrylamide gel of C.AhdI bound to a 158-bp fragment with the mutated operator site, 35L, located at different positions. Samples are run adjacent to 100-bp DNA ladders (M) and free MluI and EcoRV DNA fragments. (B) Plot of the relative band mobilities against flexure displacement and associated fit.
Using the method of Thompson and Landy (21), the relative mobilities of the complexes formed by the fragments containing the protein-binding site at their ends (µe) or at their centre (µm) were used to estimate the bend angle, α, according to the formula: µe/µm = cos (α/2). For the tetrameric complex with 35WT, the bend angle was estimated to be ∼40°, while for the dimeric complex with 35L, the bend angle was estimated to be ∼51°.
Bend angles were also determined by the method described by Ferrari et al. (22), which takes into consideration the mobilities of all fragments. The Ferrari model is based on the quadratic equation: y = ax2 − bx + c, where y is the mobility of the bound DNA (Rbound) normalized to the mobility of the corresponding free DNA (Rfree), x is the flexure displacement (length from the middle of the binding site to the 5′ end of the fragment/total fragment length), the bend angle α being given by a = −b = 2c(1 − cos α). The ratio Rbound/Rfree for both 35WT and 35L was plotted against the relative flexure displacements and data was fitted to the model described above.
For 35WT, the fitted equation was: y = 0.3660x2 − 0.3743x + 0.8785 (R2 = 0.9455). The parameters a and b are in close agreement and indicate a DNA-bending angle of 38 ± 2°. For 35L, the fitted equation was: y = 0.6062x2 − 0.5764x + 0.949 with (R2 = 0.8043). The fit to the 35L data was less good than that for 35WT, possibly due to the asymmetric position of the protein-binding site in the 35L sequence. Nevertheless, the constants a and b were in fairly close agreement and lead to an estimate for the bending angle of 47 ± 5° for the dimeric complex. This value can be compared with the angle of 54° reported for binding of C.EcoO109I to a 15-bp DNA sequence (12), which presumably binds as a dimer to this site.
Circular dichroism analysis of C.AhdI–DNA complexes
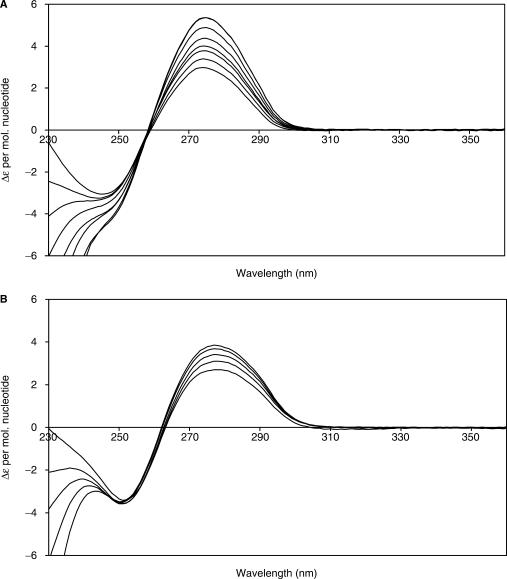
Circular dichroism spectroscopy was used to monitor local changes in the DNA structure upon binding of C.AhdI. Experiments were performed with 35-bp DNA duplexes containing either the left or complete operator sequence, to observe the effects of both dimer and tetramer binding. In both cases, aliquots of 50 μM C.AhdI were successively added to a 1 ml sample of 4.5 μM DNA. Figure 4 shows overlays of the CD spectra obtained for 35WT following successive additions of C.AhdI. There is no significant wavelength shift when the protein binds (maxima at 274.5 nm for 35WT and 277.5 nm for 35L), but there is a large increase in the magnitude of the CD signal in both cases. For binding to 35WT, this amounts to an 80% increase in Δε at saturation compared to the unbound DNA.
Figure 4.
CD spectra following C.AhdI binding. (A) The 35WT sequence and (B) the 35L sequence. Scans were taken from 360 to 230 nm for every 1 nm, following the addition of 50 μM aliquots of C.AhdI. Representative spectra are shown, corresponding to protein:DNA ratios of (a) 0, 0.54, 1.1, 1.6, 2.2, 3.0, 4.1 and 4.6 and (b) 0, 0.49, 1.0, 1.74 and 2.23. Experiments were carried out in 40 mM citrate pH 5.6, 100 mM NaCl, 1 mM EDTA, at 20°C.
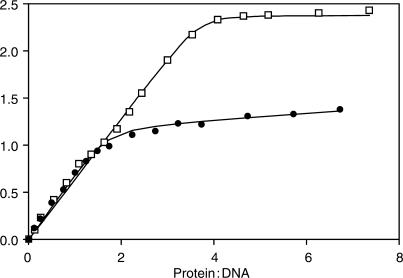
Figure 5 shows the increase in Δε as the protein:DNA molar ratio increases, for both 35WT and 35L sequences. Upon addition of C.AhdI to 35WT, an almost linear increase in Δε was observed up to a 4:1 protein to DNA molar ratio, indicating strong stoichiometric binding to both DNA-binding sites. The Δε observed for C.AhdI binding to 35L increases in a similar fashion up to a 2:1 protein to DNA ratio, and thereafter increases at a much lower rate, consistent with strong binding of the first dimer and very weak binding of the second dimer. The pronounced increase in the CD signal for binding C.AhdI dimers and tetramers (40 and 80%, respectively) clearly indicates a significant deformation to the DNA structure at each of the two adjacent DNA-binding sites.
Figure 5.
CD titration curves. Curves correspond to binding of C.AhdI to DNA sequences 35WT (open squares) and 35L (filled circles). Values of Δε were taken at the peak wavelengths of the CD spectra (274.5 and 277.5 nm, respectively). Data were fitted to a two-step binding model (see text) with K2 = 2 × 10⁷ M−1 in both cases. For 35WT, the best fit was obtained with K3 = 3 × 10⁷ M−1 and for 35L, K3 = 2 × 10⁴ M−1.
The binding data could be fitted to the sequential binding model used in previous studies of C.AhdI (17), and gave identical values for the change in Δε at each site at saturation (ΔΔε = 1.2 cm−1 · M−1). The association constant for the formation of C.AhdI dimers (K1) was fixed at 4 × 10⁵ M−1, as determined previously from AUC experiments, although at the relatively high DNA concentrations used in the CD titrations, this value is not of great relevance as the protein is dimeric throughout the titration. The binding constant for binding the first dimer (K2) could be fitted with a value of 2 × 10⁷ M−1 in both cases. For binding of the second dimer to the OR operator site in the 35WT DNA sequence, K3 = 3 × 10⁷ M−1 was obtained. In contrast, binding of the second dimer to 35L is three orders of magnitude weaker (K3 = 2 × 10⁴ M−1), corresponding to weak non-specific binding of the second dimer at this site, as expected since the specific sequence required for C.AhdI recognition has been mutated at this site.
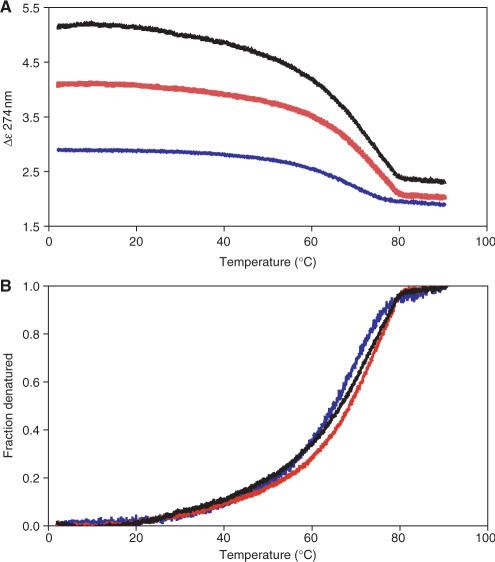
In order to investigate the stability of the DNA complexes formed, CD melting curves were recorded for the DNA (35WT), and for protein complexes with DNA at 2:1 and 4:1 molar ratios. The free DNA shows a classical melting curve with a Tm of 65.2°C (Figure 6A). It is notable that for the 2:1 and 4:1 nucleoprotein complexes, the large enhancement of the CD signal remains throughout the temperature range until the DNA melts. Thus the C.AhdI dimeric and tetrameric complexes are highly thermostable; moreover, the structural changes induced in the DNA are retained until the DNA denatures. Normalization of the data to represent the fractional denaturation of the DNA (Figure 6B) shows that the melting curves are almost identical. Detailed inspection of the curves shows that there is a small increase in the Tm from 65.2 to 66.5°C for the tetrameric complex and a somewhat higher Tm of 68.5°C for the dimeric complex. The slightly lower thermal stability of the tetrameric complex, compared to the dimeric complex, could reflect the higher intrinsic binding affinity at the OL site, combined with a decrease in the cooperativity (and thus a reduction in the effective affinity for the second site) at higher temperatures.
Figure 6.
Thermal denaturation. (A) CD melting curves for 35WT in the absence of protein (blue) and when bound to C.AhdI at 2:1 (red) and 4:1 (black). The CD signal (Δε) was monitored at 274 nm. The temperature was ramped from 2 to 90°C at 0.3°C/min. (B) Fraction denatured, assuming a two-state melting transition.
DISCUSSION
Circular dichroism experiments indicate significant changes in the structure of DNA arising from C.AhdI binding. Specifically, binding of a C.AhdI dimer to the OL site induces a 40% increase in the CD signal of the peak at 278 nm and binding of two such dimers to the intact operator site induces an 80% increase in the CD signal, when compared to the CD spectra of the free DNA. The structural changes observed for the binding of consecutive C.AhdI dimers to the operator sequence are additive, in contrast to the situation observed in bending assays. This reflects the fact that CD is reporting on local structure rather than the global structure responsible for electrophoretic mobility.
Hillen et al. (23) carried out a systematic study of the CD spectra of DNA fragments of various sequences in the range 12–360 bp and, although the detailed spectra differ in detail, all had values of Δε of around 2.5 (cm−1 · M−1) per nucleotide, typical of B-form DNA. A-form DNA (for example, when induced by non-aqueous solvents) typically shows much higher values of Δε.
The CD spectrum of DNA can also change significantly when bound by proteins that distort the DNA structure locally. The magnitude of the positive CD peak most often increases when DNA–protein complexes are formed, for example as seen for gal repressor (24) and lac repressor (25); however, in some instances e.g. cro repressor (26), the CD signal decreases on forming the DNA–protein complex. The observed increase in Δε in the C.AhdI tetrameric complex (from 2.9 to 5.2 cm−1 · M−1 per nucleotide) is amongst the largest observed, comparable but even larger than the increase in CD when two TET repressor dimers bind to the tet operator sequence (from 2.9 to 4.8 cm−1 · M−1 per nucleotide (27)). It is interesting to note that the bend angle (48°) introduced into DNA when a TET repressor dimer binds to its operator sequence (28) is almost identical to the bend angle (47°) when a C.AhdI dimer binds DNA, correlating with a similar increase in CD signal at 276 nm.
The optimal DNA length required for dimer and tetramer binding was previously measured by electrophoretic mobility shift assays (EMSA) to be ∼21 and ∼35 bp, respectively, indicating significant (∼7 bp) overlap between the two C.AhdI dimers in the tetramer complex (17). It was therefore proposed that the two dimers must occupy different faces of the DNA helix. This would be consistent with the observed spacing of 15 bp between the centres of the two binding sites, if standard B-form DNA was assumed. However, formation of DNA–protein complexes frequently distort the DNA and indeed, this is the case for C.AhdI as judged by the results of circular dichroism.
Using mobility shift assays, we have shown that binding of a C.AhdI dimer to OL causes the DNA to bend by ∼47°, while binding of two dimers to the complete operator sequence containing both OL and OR induces a bend of ∼38°. Assuming the local bend at each site is equal, one can relate the overall bend angle to the rotational phasing of the two dimers in the tetrameric complex. If the two C.AhdI dimers bound on the same face of the DNA (ϕ = 0), the bend angle for the tetramer complex would be double that for the dimer complex. However, we find that the bending is not additive; rather, formation of the tetramer leads to a lower overall bend angle than that caused by binding of one dimer, supporting the hypothesis that the two dimers occupy different faces of the DNA. Clearly, however, the bend angles do not cancel out to zero (as might be expected if the proteins were bound on opposite faces of the DNA helix, i.e. ϕ = 180°).
It is possible to estimate the twist angle (ϕ) between the planes of adjacent bending centres trigonometrically from the overall bend angles observed for dimeric and tetrameric complexes. For two identical bends (α) introduced into a linear structure, where the planes defining each bend deviate from co-planarity by an angle ϕ, giving an overall bend angle γ, it can be shown (Dr D. Whitley, personal communication) that cos γ = sqrt(1 − s2) cos (α + δ), where s = (sin α · sin ϕ), δ = tan−1 (tan α · cos ϕ). This analysis assumes that the distance separating the two bends is small compared with the overall length, as is the case here. From this we derive a twist angle, ϕ = 125° corresponding to 11.1 bp per turn over the 15 bp separating the two centres (or the equally valid mirror image solution, ϕ = −125° = 235°, corresponding to 9.1 bp per turn). This can be compared with theoretical values of ϕ = 180° for 10 bp per turn, or 155° for 10.5 bp per turn. Thus our data indicate that in addition to DNA bending, there is significant twisting of the DNA, but we cannot distinguish between the two possibilities of underwinding or overwinding.
Dickerson (29) has performed a systematic study of DNA bending by proteins, and found that such bending is almost always due to the roll angle at adjacent Py-Pu steps, notably at CA and TA dinucleotides. It is of interest to note that the trinucleotide spacer at the centre of both C.AhdI-binding sites (CAT and TAT, respectively) is strongly conserved over a wide range of known and predicted C-protein-binding sites from different bacterial species (13). This suggests a structural role since these sequences are asymmetrical and unlikely to make sequence-specific interactions with the C-protein dimer. It may also be relevant that the most commonly found nucleotide following the T of the trinucleotide spacer is A (i.e. the first base in the consensus recognition sequence AGTC). The conservation of Py-A-T sequences in the trinucleotide spacer could therefore reflect a requirement for protein-induced DNA bending at these sites.
Finally, the results presented should be of more general significance in cases where two or more proteins bend adjacent sequences of DNA. We show that the overall bend angle observed is unlikely to be simply the sum of the individual bend angles, but will be highly dependent on the rotational phasing of the binding sites and thus the twist angle of the intervening base pairs.
ACKNOWLEDGEMENTS
We thank D.Whitley for his help in deriving the trigonometrical formula for combining bending angles. This work was supported by a BBSRC project grant to GGK (ref. BB/E000878/1). Funding to pay the Open Access publication charge was provided by the BBSRC grant mentioned.
Conflict of interest statement. None declared.
REFERENCES
- 1.Wilson GG, Murray NE. Restriction and modification systems. Annu. Rev. Genet. 1991;25:585–627. doi: 10.1146/annurev.ge.25.120191.003101. [DOI] [PubMed] [Google Scholar]
- 2.Tao T, Blumenthal RM. Sequence and characterization of pvuIIR, the PvuII endonuclease gene, and of pvuIIC, its regulatory gene. J. Bacteriol. 1992;174:3395–3398. doi: 10.1128/jb.174.10.3395-3398.1992. [DOI] [PMC free article] [PubMed] [Google Scholar]
- 3.Ives CL, Nathan PD, Brooks JE. Regulation of the BamHI restriction-modification system by a small intergenic open reading frame, bamHIC, in both Escherichia coli and Bacillus subtilis. J. Bacteriol. 1992;174:7194–7201. doi: 10.1128/jb.174.22.7194-7201.1992. [DOI] [PMC free article] [PubMed] [Google Scholar]
- 4.Rimseliene R, Vaisvila R, Janulaitis A. The eco72IC gene specifies a trans-acting factor which influences expression of both DNA methyltransferase and endonuclease from the Eco72I restriction-modification system. Gene. 1995;157:217–219. doi: 10.1016/0378-1119(94)00794-s. [DOI] [PubMed] [Google Scholar]
- 5.Lubys A, Jurenaite S, Janulaitis A. Structural organization and regulation of the plasmid-borne type II restriction-modification system Kpn2I from Klebsiella pneumoniae RFL2. Nucleic Acids Res. 1999;27:4228–4234. doi: 10.1093/nar/27.21.4228. [DOI] [PMC free article] [PubMed] [Google Scholar]
- 6.Vijesurier RM, Carlock L, Blumenthal RM, Dunbar JC. Role and mechanism of action of C · PvuII, a regulatory protein conserved among restriction-modification systems. J. Bacteriol. 2000;182:477–487. doi: 10.1128/jb.182.2.477-487.2000. [DOI] [PMC free article] [PubMed] [Google Scholar]
- 7.Cesnaviciene E, Mitkaite G, Stankevicius K, Janulaitis A, Lubys A. Esp1396I restriction-modification system: structural organization and mode of regulation. Nucleic Acids Res. 2003;31:743–749. doi: 10.1093/nar/gkg135. [DOI] [PMC free article] [PubMed] [Google Scholar]
- 8.Tao T, Bourne JC, Blumenthal RM. A family of regulatory genes associated with type II restriction-modification systems. J. Bacteriol. 1991;173:1367–1375. doi: 10.1128/jb.173.4.1367-1375.1991. [DOI] [PMC free article] [PubMed] [Google Scholar]
- 9.Anton BP, Heiter DF, Benner JS, Hess EJ, Greenough L, Moran LS, Slatko BE, Brooks JE. Cloning and characterization of the BglII restriction-modification system reveals a possible evolutionary footprint. Gene. 1997;187:19–27. doi: 10.1016/s0378-1119(96)00638-5. [DOI] [PubMed] [Google Scholar]
- 10.Bart A, Dankert J, van der Ende A. Operator sequences for the regulatory proteins of restriction modification systems. Mol. Microbiol. 1999;31:1277–1278. doi: 10.1046/j.1365-2958.1999.01253.x. [DOI] [PubMed] [Google Scholar]
- 11.Zheleznaya LA, Kainov DE, Yunusova AK, Matvienko NI. Regulatory C protein of the EcoRV modification-restriction system. Biochemistry (Moscow) 2003;68:125–132. doi: 10.1023/a:1022105804578. [DOI] [PubMed] [Google Scholar]
- 12.Kita K, Tsuda J, Nakai SY. C.EcoO109I, a regulatory protein for production of EcoO109I restriction endonuclease, specifically binds to and bends DNA upstream of its translational start site. Nucleic Acids Res. 2002;30:3558–3565. doi: 10.1093/nar/gkf477. [DOI] [PMC free article] [PubMed] [Google Scholar]
- 13.Knowle D, Lintner RE, Touma YM, Blumenthal RM. Nature of the promoter activated by C.PvuII, an unusual regulatory protein conserved among restriction-modification systems. J. Bacteriol. 2005;187:488–497. doi: 10.1128/JB.187.2.488-497.2005. [DOI] [PMC free article] [PubMed] [Google Scholar]
- 14.Minakhin L, Bogdanova E, Nagornikh M, Vasilov A, Heyduk T, Solonin A, Zakharova M, Severinov K, Semenova E. Transcription regulation of the EcoRV restriction-modification system. Nucleic Acids Res. 2005;33:6942–6951. doi: 10.1093/nar/gki998. [DOI] [PMC free article] [PubMed] [Google Scholar]
- 15.McGeehan JE, Streeter S, Papapanagiotou I, Fox GC, Kneale GG. High-resolution crystal structure of the restriction-modification controller protein C.AhdI from Aeromonas hydrophila. J. Mol. Biol. 2005;346:689–701. doi: 10.1016/j.jmb.2004.12.025. [DOI] [PubMed] [Google Scholar]
- 16.Streeter SD, Papapanagiotou I, McGeehan JE, Kneale GG. DNA footprinting and biophysical characterisation of the controller protein C.AhdI suggests the basis of a genetic switch. Nucleic Acids Res. 2004;32:6445–6453. doi: 10.1093/nar/gkh975. [DOI] [PMC free article] [PubMed] [Google Scholar]
- 17.McGeehan JE, Papapanagiotou I, Streeter SD, Kneale GG. Cooperative binding of the c.ahdi controller protein to the c/r promoter and its role in endonuclease gene expression. J. Mol. Biol. 2006;358:523–531. doi: 10.1016/j.jmb.2006.02.003. [DOI] [PubMed] [Google Scholar]
- 18.Nagaich AK, Zhurkin VB, Durell SR, Jernigan RL, Appella E, Harrington RE. p53-induced DNA bending and twisting: p53 tetramer binds on the outer side of a DNA loop and increases DNA twisting. Proc. Natl. Acad. Sci. USA. 1999;96:1875–1880. doi: 10.1073/pnas.96.5.1875. [DOI] [PMC free article] [PubMed] [Google Scholar]
- 19.Zwieb C, Adhya S. Improved plasmid vectors for the analysis of protein-induced DNA bending. Methods Mol. Biol. 1994;30:281–294. doi: 10.1385/0-89603-256-6:281. [DOI] [PubMed] [Google Scholar]
- 20.Wu HM, Crothers DM. The locus of sequence-directed and protein-induced DNA bending. Nature. 1984;308:509–513. doi: 10.1038/308509a0. [DOI] [PubMed] [Google Scholar]
- 21.Thompson JF, Landy A. Empirical estimation of protein-induced DNA bending angles: applications to lambda site-specific recombination complexes. Nucleic Acids Res. 1988;16:9687–9705. doi: 10.1093/nar/16.20.9687. [DOI] [PMC free article] [PubMed] [Google Scholar]
- 22.Ferrari S, Harley VR, Pontiggia A, Goodfellow PN, Lovell-Badge R, Bianchi ME. SRY, like HMG1, recognizes sharp angles in DNA. EMBO J. 1992;11:4497–4506. doi: 10.1002/j.1460-2075.1992.tb05551.x. [DOI] [PMC free article] [PubMed] [Google Scholar]
- 23.Hillen W, Goodman TC, Wells RD. Circular dichroism spectra of twelve short DNA restriction fragments of known sequence: a comparison of measured and calculated spectra. Nucleic Acids Res. 1981;9:3029–3045. doi: 10.1093/nar/9.13.3029. [DOI] [PMC free article] [PubMed] [Google Scholar]
- 24.Wartell RM, Adhya S. DNA conformational change in Gal repressor-operator complex: involvement of central G-C base pair(s) of dyad symmetry. Nucleic Acids Res. 1988;16:11531–11541. doi: 10.1093/nar/16.24.11531. [DOI] [PMC free article] [PubMed] [Google Scholar]
- 25.Culard F, Maurizot JC. Lac repressor – lac operator interaction. Circular dichroism study. Nucleic Acids Res. 1981;9:5175–5184. doi: 10.1093/nar/9.19.5175. [DOI] [PMC free article] [PubMed] [Google Scholar]
- 26.Torigoe C, Kidokoro S, Takimoto M, Kyoyoku Y, Wada A. Spectroscopic studies on lambda cro protein-DNA interactions. J. Mol. Biol. 1991;219:733–746. doi: 10.1016/0022-2836(91)90668-v. [DOI] [PubMed] [Google Scholar]
- 27.Altschmied L, Hillen W. Tet repressor - tet operator complex formation induces conformational changes in the tet operator DNA. Nucleic Acids Res. 1984;24:2171–2180. doi: 10.1093/nar/12.4.2171. [DOI] [PMC free article] [PubMed] [Google Scholar]
- 28.Tovar K, Hillen W. Tet repressor binding induced curvature of tet operator DNA. Nucleic Acids Res. 1989;17:6515–6522. doi: 10.1093/nar/17.16.6515. [DOI] [PMC free article] [PubMed] [Google Scholar]
- 29.Dickerson RE. DNA bending: the prevalence of kinkiness and the virtues of normality. Nucleic Acids Res. 1998;26:1906–1926. doi: 10.1093/nar/26.8.1906. [DOI] [PMC free article] [PubMed] [Google Scholar]


