

Abstract
Ca2+-activated Cl− channels play important roles in a variety of physiological processes, including epithelial secretion, maintenance of smooth muscle tone, and repolarization of the cardiac action potential. It remains unclear, however, exactly how these channels are controlled by Ca2+ and voltage. Excised inside-out patches containing many Ca2+-activated Cl− channels from Xenopus oocytes were used to study channel regulation. The currents were mediated by a single type of Cl− channel that exhibited an anionic selectivity of I− > Br− > Cl− (3.6:1.9:1.0), irrespective of the direction of the current flow or [Ca2+]. However, depending on the amplitude of the Ca2+ signal, this channel exhibited qualitatively different behaviors. At [Ca2+] < 1 μM, the currents activated slowly upon depolarization and deactivated upon hyperpolarization and the steady state current–voltage relationship was strongly outwardly rectifying. At higher [Ca2+], the currents did not rectify and were time independent. This difference in behavior at different [Ca2+] was explained by an apparent voltage-dependent Ca2+ sensitivity of the channel. At +120 mV, the EC50 for channel activation by Ca2+ was approximately fourfold less than at −120 mV (0.9 vs. 4 μM). Thus, at [Ca2+] < 1 μM, inward current was smaller than outward current and the currents were time dependent as a consequence of voltage-dependent changes in Ca2+ binding. The voltage-dependent Ca2+ sensitivity was explained by a kinetic gating scheme in which channel activation was Ca2+ dependent and channel closing was voltage sensitive. This scheme was supported by the observation that deactivation time constants of currents produced by rapid Ca2+ concentration jumps were voltage sensitive, but that the activation time constants were Ca2+ sensitive. The deactivation time constants increased linearly with the log of membrane potential. The qualitatively different behaviors of this channel in response to different Ca2+ concentrations adds a new dimension to Ca2+ signaling: the same channel can mediate either excitatory or inhibitory responses, depending on the amplitude of the cellular Ca2+ signal.
Keywords: ion channels, electrophysiology, ion channel gating, calcium signaling, ion transport
INTRODUCTION
Ca2+-activated Cl− channels play fundamental roles in physiological processes in many tissues, including secretion in airway epithelium (Wagner et al. 1991; Gray et al. 1995), repolarization of the cardiac action potential (Zygmunt 1994; Kawano et al. 1995; Wang et al. 1995; Collier et al. 1996), regulation of vascular tone (Nelson et al. 1997; Yuan 1997; Nilius et al. 1997a,Nilius et al. 1997b), modulation of photoreceptor light responses (Barnes and Deschenes 1992), olfactory transduction (Kurahashi and Yau 1994), neuronal excitability (DeCastro et al. 1997), regulation of platelet cell volume (Fine et al. 1994), and fast block to polyspermy in oocytes (Jaffe and Cross 1986). Ca2+-activated Cl− channels may be involved in several human diseases, including cystic fibrosis and cardiac arrhythmias. Although defects in the CFTR Cl− channel cause cystic fibrosis, upregulation of a Ca2+-activated Cl− current in the airway of CFTR knockout mice can compensate for the lack of CFTR and ameliorate the pathology in this mouse model (Clarke et al. 1994; Grubb et al. 1994). Furthermore, overexpression of CFTR in cultured airway epithelial cells from CF patients results in a decrease in Ca2+-activated Cl− current (Johnson et al. 1995). Ca2+-activated Cl− channels also play a role in the repolarization of the cardiac action potential and contribute to the transient outward current (Ito) (Zygmunt and Gibbons 1991, Zygmunt and Gibbons 1992; Zygmunt 1994; Zygmunt et al. 1998.). Recently, it has been shown that dogs which are genetically prone to cardiac sudden death have an abnormal Ito (Freeman et al. 1997), implying that Ca2+-activated Cl− channels might play a role in cardiac sudden death. Ca2+-activated Cl− channels also contribute to the transient inward current (Han and Ferrier 1992, Han and Ferrier 1996), which is believed to trigger cardiac arrhythmias during Ca2+ overload (Berlin et al. 1989).
Despite the importance of Ca2+-activated Cl− channels in cell physiology, our understanding of the mechanisms of regulation and gating of these channels remains rudimentary. In different studies and cell types, Ca2+-activated Cl− currents behave differently. Often, these currents are voltage sensitive: they activate slowly on depolarization and deactivate on hyperpolarization (e.g., Cliff and Frizzell 1990; Arreola et al. 1996; Nilius et al. 1997b; Anderson and Welsh 1998), but in other studies the currents appear time and voltage independent (e.g., Xie et al. 1996; Collier et al. 1996). It is not known whether this difference is due to differences in regulation of the same type of channel, to different experimental protocols, or to different molecular species of Ca2+-activated Cl− channels. There is strong evidence in the literature for the existence of several classes of Ca2+-activated Cl− channels that are differentially regulated. The single channel conductances reported for Ca2+-activated Cl− channels range from 1 to 50 pS (Marty et al. 1984; Frizzell et al. 1986; Takahashi et al. 1987; Taleb et al. 1987, Taleb et al. 1988; Marunaka and Eaton 1990; Nishimoto et al. 1991; Klöckner 1993; Collier et al. 1996; Schlenker and Fitz 1996; Nilius et al. 1997a). Furthermore, Ca2+-activated Cl− currents that appear similar at the macroscopic level can be regulated differently; e.g., Ca2+-activated Cl− currents in T84 intestinal cells require CaMKII for activation, whereas those in rat parotid gland cells do not (Arreola et al. 1998). The cloning of a Ca2+-activated Cl− current has been reported (Cunningham et al. 1995; Gruber et al. 1998; Ji et al. 1998), but it seems unlikely that this is the same channel studied here because the single channel conductance (Takahashi et al. 1987) and pharmacology (Hartzell, unpublished observations) differ.
Xenopus oocytes have long been a model system for studying Ca2+-activated Cl− channels (Dascal 1987) because these channels are the predominant channel type natively expressed in this cell and because they are expressed at extremely high levels (0.5 mA/cm2). The Xenopus oocyte Ca2+-activated Cl− currents have been studied in considerable detail at the macroscopic level (see references in Yao and Parker 1993, and Kuruma and Hartzell 1999). The inward and outward Ca2+-activated Cl− currents are regulated differently: outward Cl− current is activated at lower cytosolic [Ca2+] than is inward Cl− current (Kuruma and Hartzell 1999). Although this difference in Ca2+ sensitivity could be explained by two different classes of Cl− channels with different Ca2+ affinities (Boton et al. 1989; Hartzell 1996; Kuruma and Hartzell 1999), it could also be explained by a single class of Cl− channel that exhibits voltage-dependent Ca2+ affinity (Yao and Parker 1993). Because Xenopus oocytes have been such an important model system for the study of Ca2+-activated Cl− channels, we have begun a detailed investigation into the mechanisms of their regulation and gating. The purpose of the present investigation was to characterize quantitatively the regulation of Xenopus oocyte Ca2+-activated Cl− currents by Ca2+ and voltage in excised inside-out patches where cytosolic Ca2+ could be precisely controlled and to determine whether the macroscopic currents in Xenopus oocytes could be explained by a single class of Cl− channels. We find that Ca2+-activated Cl− currents in Xenopus oocytes can be explained by a single class of channel that exists in multiple closed and open states. Channel opening absolutely requires Ca2+ and is independent of voltage, but channel closing is voltage sensitive. At low [Ca2+], the probability of channel opening at hyperpolarized potentials is low because the rate of channel closure (voltage sensitive) is rapid relative to channel opening (Ca2+ sensitive). As [Ca2+] is increased, the rate of channel opening dominates at all potentials and the current becomes voltage independent. These features define a new aspect of Ca2+ signaling, where a single effector molecule can behave qualitatively differently depending on the Ca2+ signal.
METHODS
Solutions
Solutions containing different free [Ca2+] were made by the method of Tsien and Pozzan 1989. 0-Ca2+ solution contained 150 mM NMDG-Cl, 5.07 MgCl2, 10 mM EGTA, and 10 mM HEPES, pH 7.3 with NMDG. High Ca2+ solution contained 150 mM NMDG, 4.12 mM MgCl2, 10 mM Ca-EGTA, 10 mM HEPES, pH 7.3. The stock 100 mM Ca-EGTA solution was made by the pH-metric method described by Tsien and Pozzan 1989, except that NMDG was used to adjust pH. Working solutions having different free Ca2+ were prepared by mixing the 0-Ca2+ solution with the high-Ca2+ solution in various ratios. The free [Ca2+] was calculated from the equation: [Ca2+] = K d × [Ca chelator]/[free chelator], where K d is the K d of the Ca2+ chelator, EGTA (K d = 1.0 × 10⁻⁷ M at 24°C, pH 7.3, ionic strength 0.16 M, 4 mM Mg2+). For solutions >1 μM free Ca, we sometimes used a relatively high-K d chelator, 5,5′-dibromo-1,2-bis(2-aminophenoxy) ethane-N,N,N′,N′-tetraacetic acid (K d = 1.98 × 10⁻⁶ M at 24°C, pH 7.3, ionic strength 0.16 M, 4 mM Mg2+; Molecular Probes, Inc.), for better Ca2+ buffering. Free Mg2+ was always adjusted to 4 mM using the program MaxC 1.0 (http://www.stanford.edu/~cpatton/maxc.html; Bers et al. 1994). The calculated Ca2+ concentrations were confirmed in each solution by fura-2 (Molecular Probes, Inc.) measurements using an LS-50B luminescence spectrophotometer (Perkin-Elmer Corp.). For the low Cl− pipet solution, Cl− was replaced with aspartate. For anion permeability experiments, Cl− was replaced by Br− or I−. NMDG-bromide and NMDG-iodide were made by titrating NMDG with hydrobromic and hydriodic acid, respectively. All reagents were purchased from Sigma Chemical Co. unless stated otherwise.
Isolation of Xenopus oocytes
Stage V–VI oocytes were harvested from adult Xenopus laevis females (Xenopus I) as described by Dascal 1987. Xenopus oocytes were anesthetized by immersion in Tricaine (1.5 g/liter). Ovarian follicles were removed, cut into small pieces, and digested in normal Ringer with no added calcium containing ∼2 mg/ml collagenase type IA for 2 h at room temperature. The oocytes were extensively rinsed with normal Ringer, placed in L-15 medium (GIBCO BRL) and stored at 18°C. Oocytes were used 1–4 d after isolation. On the day of recording, oocytes were shaken in hypertonic solution (200 mM K-aspartate, 20 mM KCl, 1 mM MgCl2, 10 mM EGTA, 10 mM HEPES, pH 7.2 with KOH) for 10–15 min to facilitate manual removal of the vitelline membrane, and then they were placed in normal Ringer solution until use.
Electrophysiological Methods
All recordings were performed using the inside out patch-clamp configuration with symmetrical Cl− concentration except where noted. Patch pipets were made of borosilicate glass (Sutter Instrument Co.) pulled by a Model-2000 puller (Sutter Instrument Co.), coated with Sylgard (Dow Corning Corp.) and fire polished. Patch pipets had resistances of 4–8 MΩ. They were filled with 0-Ca2+ solution (or in some experiments high-Ca2+ solution, with the same results). The bath was grounded via a 3 M KCl-agar bridge connected to a Ag-AgCl− reference electrode. After obtaining a giga-ohm seal, the patch was excised into 0-Ca2+ solution. For routine experiments, solution changes were performed by gravity feed of the 300-μl chamber at ∼10 ml/min using a perfusion manifold (MP-8; Warner Instruments). Solution exchange occurred in ∼5 s. See below for a description of the method for rapid solution changes. The seals were consistently >50 GΩ and root mean square noise was <0.2 pA. The seals typically lasted for 20–60 min. Patches were generally obtained from the animal hemisphere because Ca2+-activated Cl− currents are concentrated here (Gomez-Hernandez et al. 1997; Machaca and Hartzell 1998). The amplitude of the Ca2+-activated Cl− currents varied significantly between patches as well as between oocytes from different batches. Liquid junction potentials were measured for each experimental solution as described by Neher 1992 and corrected after the recordings. Instantaneous currents were measured 1 ms after the onset of the voltage pulse.
Data were usually acquired by an Axopatch 200B (or 200A) amplifier that was controlled by Clampex 7.0.1 via a Digidata 1200 analogue-to-digital and digital-to-analogue converter (Axon Instruments). For some experiments, the data was acquired by Curcap 3.0 (W. Goolsby, Emory University, Atlanta, GA) and voltages were delivered by a Challenger DB stimulator (W. Goolsby). Experiments were conducted at room temperature (20–24°C).
Ca2+ Concentration Jump Experiments
Rapid changes in [Ca2+] were made using a system similar to that described by Naranjo and Brehm 1993. In brief, the excised patch was placed at the confluence of two solution streams that were switched by a solenoid (225P072-11; Neptune Research and Development, Inc.) controlled by the Challenger stimulator (W. Goolsby). The solutions flowed at a rate of 5–10 ml/min from 0.5-mm–diameter orifices. As shown in results, it was possible to switch between two different solutions in <5 ms.
Display and Analysis of Data
For the calculations and graphical presentation, we used Origin 5.1 software (Microcal Software, Inc.). Exponential fits for activation and deactivation kinetics of current traces were usually performed using the iterative Levenberg-Marquardt algorithm in Origin. For some experiments, we used the Pade-LaPlace algorithm for fitting exponentials (Yeramian and Claverie 1987; Bajzer et al. 1989) (Xcalcwin; Patrick Lechene, University of Paris, Chatenay-Malabry, France). Results are presented as mean ± SEM, and n refers to the number of patches in each experiment.
RESULTS
Activation of Currents in Excised Patches by Cytosolic Ca
Fig. 1 shows typical current records from an inside-out excised patch from a Xenopus oocyte containing many Ca2+-activated Cl− channels. Both cytosolic and extracellular solutions contained 150 mM NMDG-Cl, 4 mM Mg2+, 10 mM EGTA, and 10 mM HEPES, pH 7.3 with NMDG. The cytosolic side of the patch was exposed to this solution with Ca2+ · EGTA added to adjust the free Ca2+ concentration to values of <10 or 600 nM. The patch was held at 0 mV and stepped to Vm between −120 and +120 mV for 1.3 s, and then stepped to −120 mV for 0.3 s. At <10 nM Ca2+, no currents were observed (Fig. 1 A). In contrast, at 600 nM Ca2+, large sustained outward currents in response to depolarizing steps and deactivating inward tail currents in response to hyperpolarizing steps were observed (Fig. 1 B). Very little steady state inward current was observed at negative potentials. The effect of Ca2+ was reversible (Fig. 1 C). The outward currents at 600 nM Ca2+ were composed of a small instantaneous time-independent component and a large slowly activating time-dependent component. At +120 mV, the outward current at the end of the pulse was ∼50 pA in this experiment, but ranged from ∼20 to ∼500 pA in different patches.
Figure 1.

Activation of Ca2+-activated Cl− currents in an excised inside-out patch from a Xenopus oocyte. The cytosolic face of an excised inside-out patch was exposed to NMDG-Cl solutions containing <10 nM (A and C) or 600 nM (B) Ca2+. The patch was voltage clamped by stepping from a holding potential of 0 mV to various potentials between +120 and −120 mV for 1.3 s, followed by a 0.3-s step to −120 mV (voltage protocol is shown above B). The largest outward current corresponds to the +120-mV pulse. (D) Steady state current–voltage relationship for excised patch current. The currents at the end of the 1.3-s pulse from B were plotted versus membrane potential. •, 600 nM Ca2+; ○, ,10 nM Ca2+. (E–F) Comparison of currents in excised patch with whole-cell currents. (E) The “excised-patch” current was recorded with symmetrical Cl− at a transmembrane voltage of +200 mV. The cytosolic face of the patch was exposed to (a) <10 nM, (b) 460 nM, (c) 1. 1 μM, and (d) 1.8 μM Ca2+. (F) The “whole-cell” current (ICl1-S) was recorded in an intact oocyte by two-electrode voltage clamp after injection of (a) none, (b) 320 pmol Ca2+ (10 s after injection), (c) 690 pmol Ca2+ (10 s after injection), and (d) 690 pmol Ca2+ (20 s after injection). The transmembrane voltage was +80 mV and extracellular Cl− was 134 mM. Tail currents for both E and F were recorded at −120 mV.
This Ca2+- and voltage-sensitive current strongly resembled the outward Cl− current activated by Ca2+ released from internal stores in response to IP3 injection in intact oocytes. This current, called ICl1-S, has previously been extensively characterized using two-microelectrode voltage clamp (Hartzell 1996; Kuruma and Hartzell 1999). The waveforms of ICl1-S and the excised patch currents are very similar (Fig. 1, E–F) and both currents exhibit strongly outwardly rectifying steady state current–voltage relationships (Fig. 1 D).
The Ca2+-activated Currents Are Carried by Cl− Ions
These currents were carried by Cl− ions (Fig. 2). In this experiment, the instantaneous current–voltage relationship of the current was determined by measuring the amplitude of tail currents at different potentials after a depolarizing step to +120 mV with 160 mM Cl− on both sides of the membrane (Fig. 2 A) or with 40 mM Cl− in the bath and 160 mM Cl− in the pipet (Fig. 2 B). In this experiment, the reversal potential of the current shifted +38.1 mV upon reducing extracellular [Cl−]. On average, the reversal potential shifted +38.0 mV (symmetric Cl− Erev = 0.1 ± 0.43 mV, n = 18; asymmetric Cl− Erev = +39.0 ± 0.27 mV, n = 9). This shift was very close to the +36.3-mV shift predicted by the Goldman-Hodgkin-Katz equation. We conclude that this current in the excised patch corresponds to the Ca2+-activated Cl− current ICl1-S we have described in intact oocytes because they are both activated by Ca2+, carried by Cl−, and have similar waveforms and steady state current–voltage relationships.
Figure 2.

Excised patch currents are Cl− currents. The reversal potential of the Ca2+-activated currents recorded in inside-out patches was determined by measuring the instantaneous current at different potentials following a depolarizing step to +120 mV (voltage protocol is shown above B). The pipet solution contained either 160 (A) or 40 (B) mM Cl−. The bath solution contained 160 mM Cl−. (C) Instantaneous current–voltage relationship. The amplitudes of the tail currents were plotted versus the membrane potential for symmetric 160 mM Cl− (○) or for 40 mM Clo–160 mM Cli (•). The reversal potential shifted from 0 to +38.1 mV with the reduction in extracellular Cl. The shift for a Cl-selective channel predicted by the Goldman-Hodgkin-Katz equation is +35.2 mV.
Voltage Dependence of Ca2+-activated Cl− Current at Different [Ca2+]
Although the channel rectified strongly and activated/deactivated slowly with voltage pulses at low [Ca2+], the behavior was dramatically different at higher [Ca2+]. Fig. 3A–F, shows a series of current traces from an excised patch exposed to different cytosolic [Ca2+] from <10 nM to 2 μM Ca2+. At [Ca2+] > 1 μM, the current traces had very different waveforms than they did at lower [Ca2+]. As the [Ca2+] was increased, the outward current became increasingly dominated by the time-independent component. The current became essentially instantaneous at 2 μM Ca2+. Also, rectification decreased with increasing Ca2+ concentration. At 2 μM Ca2+, there were approximately equal amounts of steady state inward and outward currents at +120 and −120 mV (Fig. 3 E). Fig. 3 G shows that the steady state current–voltage relationship changed from outwardly rectifying at <1 μM Ca to linear at >1 μM Ca2+. This behavior resembled the behavior of Ca2+-activated Cl− currents activated by injecting different concentrations of Ca2+ into oocytes (Kuruma and Hartzell 1999): with small injections of Ca, a time-dependent outward current was observed, whereas larger injections stimulated both inward and outward time-independent currents. These data show that, depending critically on [Ca2+], the current exhibited qualitatively different rectification properties and waveforms.
Figure 3.
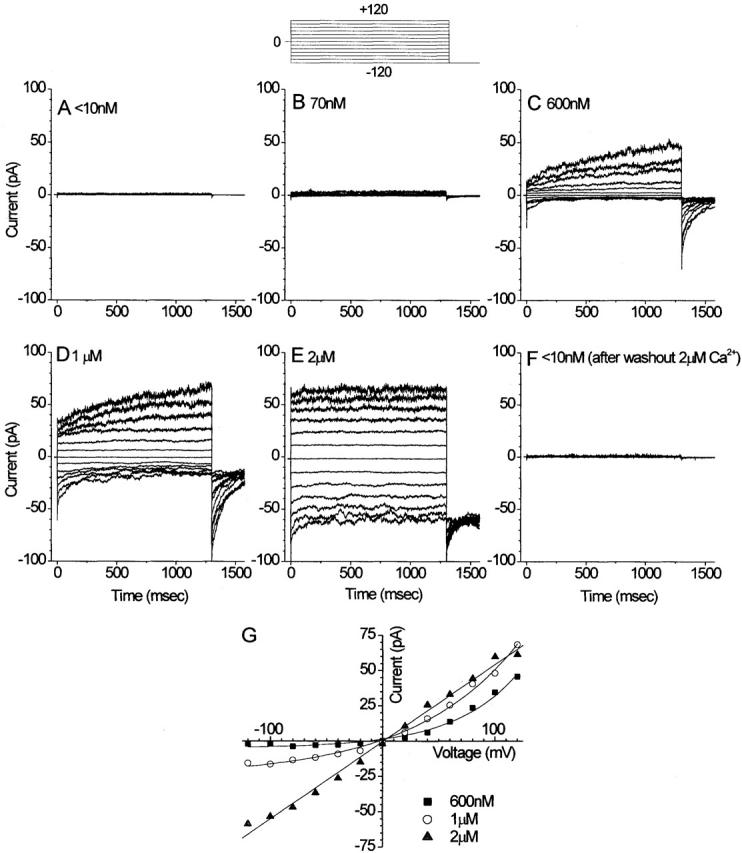
Ca2+ dependence of Cl− currents in a single excised patch. The cytosolic face of an excised patch was exposed to solutions with different free [Ca2+]: A, <10 nM Ca2+; B, 70 nM Ca2+; C, 600 nM Ca2+; D, 1 μM Ca2+; E, 2 μM Ca2+; and F, <10 nM Ca2+ (after washing out 2 μM Ca2+). The patch was voltage clamped by stepping to various potentials between +120 and −120 mV for 1.3 s from the holding potential of 0 mV, followed by a step to −120 mV for 0.3 s (protocol shown above B). (G) Steady state current–voltage relationships of currents at 600 nM Ca2+, 1 μM Ca2+, and 2 μM Ca2+.
The voltage dependencies of the currents at different [Ca2+] were determined by plotting the conductance versus membrane potential. Conductance was determined by measuring the instantaneous currents at −120 mV after pulses to various potentials (voltage protocol as shown in Fig. 3) and dividing by the driving force (−120 mV). Fig. 4 A shows the average conductance–voltage curves (n = 4–13 different patches). Increasing [Ca2+] over a rather narrow range, between 0.1 and 1 μM, shifted the conductance–voltage relationship strongly in the leftward direction and also significantly decreased the voltage dependence (slope). At the highest [Ca2+] examined, the currents exhibited little or no voltage dependence within the voltage range tested.
Figure 4.
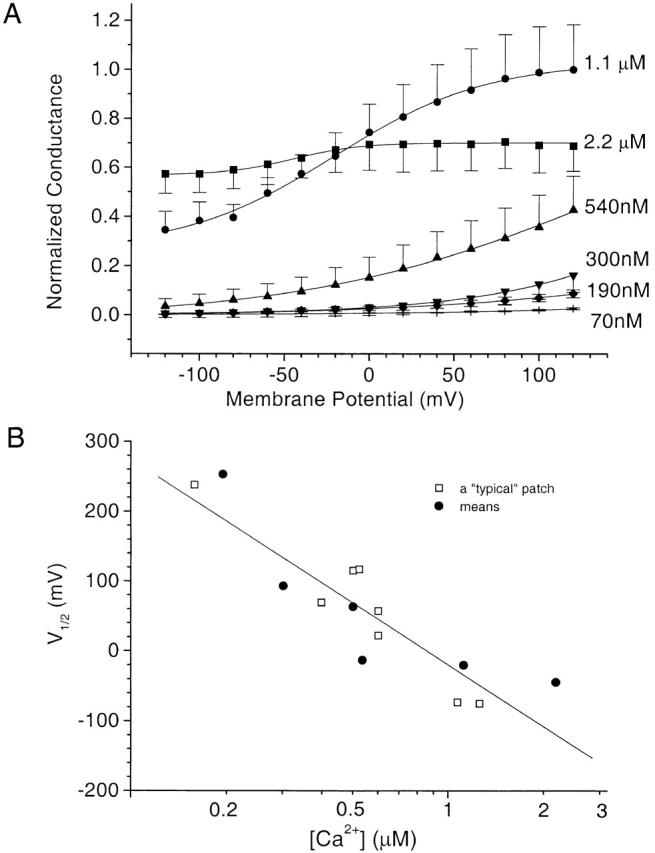
Voltage dependence of Ca2+-dependent conductance. The voltage protocol was the same as in Fig. 3, but conductance was calculated by dividing the tail currents at −120 mV by the driving force, and then normalizing the data to the maximum conductance at +120 mV at 1.1 μM Ca2+ (∼0.5 nS). (A) Average of experiments at 2.2 μM Ca2+ (n = 5), 1.1 μM Ca2+ (n = 4), 540 nM Ca2+ (n = 13), 300 nM Ca2+ (n = 12), 190 nM Ca2+ (n = 5), and 70 nM Ca2+ (n = 11). The solid curves are fits to the Boltzmann equation. (B) Plot of the estimate of V1/2 vs. [Ca2+]. □, typical patch; •, averages from A.
The reader will notice that at 2.2 μM Ca2+ the conductance at depolarized potentials was less than the conductance at 1 μM Ca2+. This was due to a spontaneous decrease in current amplitude with time (rundown). This rundown phenomenon was irreversible and Ca2+ dependent. The rate and magnitude of rundown were variable from patch to patch. For example, rundown was not obvious in Fig. 3, but usually at [Ca2+] > 1 μM the current decreased exponentially to 50% of its initial value in 3–10 min. Patches in which rundown occurred rapidly were discarded from analysis, but otherwise we have not attempted to correct for rundown in any of the experiments shown here.
Quantitative analysis of the data was also compromised by the fact that it was usually not possible to maintain patches at voltages greater than ±120 mV, and the maximum our amplifier would deliver was ±200 mV, but voltages beyond this range were required to obtain the maximum and minimum conductances. Nevertheless, to estimate the voltage dependence, the available data for each [Ca2+] were fitted to the Boltzmann equation (Hille 1992): G = G max (1/{1 + exp[−(Vm − V1/2)zF/RT]}) + a. Despite the limited voltage range, the fits were quite good. In the range of [Ca2+] where the data were most complete (between 0.5 and 1 μM), z, which is an estimate of the total gating charge movement, was ∼0.5. To evaluate the voltage dependence of the current at different [Ca2+], we assumed that z was the same at all [Ca2+], and estimated V1/2 from the best fit. Fig. 4 B shows the estimated V1/2 for the average of all patches. These data suggest that V1/2 changes ∼295 mV for a 10-fold change in [Ca2+].
The Voltage-dependent Step Is after the Ca2+-dependent Step
Fig. 4 has shown that at 2.2 μM Ca2+ the channel cannot be closed by voltages as negative as −120 mV and that at ∼10 nM Ca2+ the channel cannot be opened by voltages as positive as +120 mV. This suggests that channel opening is Ca2+ dependent and that the voltage-sensitive step is after Ca2+ binding. Fig. 5 extends the voltage range and shows that the channel cannot be closed by voltages even as negative as −200 mV. An excised patch was held at negative potentials for 10 s, and then stepped to +120 mV to measure the instantaneous current, to determine whether negative potentials could deactivate the current completely. At 500 nM Ca2+ (Fig. 5A and Fig. B), a small, but significant outward current (30 pA) was recorded upon stepping from −100 to +120 mV. Increasing the holding potential to −200 mV had no significant effect on the magnitude of the instantaneous current. Thus, even at this intermediate [Ca2+], it was not possible to close the channels by strong depolarization. At 1 μM Ca2+ (Fig. 5C and Fig. D), the currents were larger, but their amplitudes were not significantly reduced by increasing the holding potential from −160 to −200 mV. From these results, it is clear that channel opening is not voltage gated and that voltage only modulates the current amplitude. Rather, channel opening is strictly dependent on Ca2+ and the voltage sensitivity must occur at a later step.
Figure 5.

Hyperpolarization cannot turn off currents activated by Ca2+. Excised patches were exposed to 500 nM Ca2+ (A and B) or 1 μM Ca2+ (C and D). The membrane potential was held at various values between −200 and 0 mV. The instantaneous currents at +120 mV were measured to determine the conductance activated at the preceding voltage. At both [Ca2+], hyperpolarization to −200 mV was not able to inactivate the Ca2+-activated current. Only selected traces are shown in A and C for clarity.
Voltage-dependent Ca2+ Affinity of the Ca2+-activated Cl Current
To analyze the voltage dependence of the current quantitatively, it was necessary to obtain recordings in the absence of significant rundown. Because rundown was Ca2+ dependent, we minimized rundown by reducing the amount of time the patch was exposed to Ca2+. This was accomplished by using rapid solution changes that introduced Ca2+ only during voltage-clamp trials and by using voltage-clamp trials having fewer episodes than those used in the previous figures. Using this approach, a few patches were obtained in which rundown was <10% during the time (∼7–10 min) required to obtain a complete set of current–voltage curves at five different Ca2+ concentrations. To assess the amount of rundown, the maximal current at 120 mV was measured at the start of the experiment (IINITIAL) during a brief (∼10 s) exposure to 40 μM Ca2+. The patch was then returned to <10 nM Ca2+ solution, except during the voltage clamp trials, when it was exposed to different [Ca2+] (from 170 nM to 40 μM). The amplitude of the current at 120 mV during the last voltage clamp trial in 40 μM Ca2+ (IFINAL) was compared with IINITIAL. In the case of the patch illustrated in Fig. 6 A, IINITIAL and IFINAL were virtually identical. Fig. 6 B is a plot of conductance versus Vm at different [Ca2+]. Comparison of this plot to the averages in Fig. 4 A shows that the general features and conclusions derived from Fig. 4 are valid, despite the presence of rundown.
Figure 6.

Voltage-dependent Ca2+ affinity of Ca2+-activated Cl channels. (A) Time course of current rundown in a champion patch. The amplitude of currents at +120 mV in the presence of different [Ca2+] are plotted with time after patch excision. The patch was exposed to Ca2+ only during the voltage-clamp episodes. (B) Voltage-dependent conductance of the champion patch. The experiment was performed as described in Fig. 4 A. (C) Voltage dependence of Ca2+ affinity of champion patch. The tail current amplitudes used to create the plot in B were replotted as a function of [Ca2+] and fitted to the Hill equation. (D) The best-fit parameters of the data in C to the Hill equation. (E) Demonstration that 40 μM Ca2+ produces a maximal Cl current. Steady state I-V curves are shown for Ca2+-dependent currents in 40 μM (•) and ∼900 μM (▪) Ca2+. (F) Average apparent affinity of the channel for Ca2+ at different voltages. Normalized conductance from Fig. 4 A was replotted as a function of [Ca2+]. Error bars are not shown for clarity but can be obtained from Fig. 4. The data for [Ca2+] < 2 μM were fitted to the Hill equation.
To determine the voltage dependence of the Ca sensitivity of the channel, we plotted the amplitude of the tail currents versus [Ca2+] for each voltage (Fig. 6 C), and the data were fitted to the Hill equation. This analysis shows that the apparent affinity of the channel for Ca2+ decreased approximately fourfold from 4 μM at −120 mV to 0.9 μM at +120 mV. The Hill coefficient ranged from 3.2 to 2.5 over the same voltage range (Fig. 6 D). This analysis assumes that 40 μM Ca2+ activated the current maximally. This assumption was tested in other patches by comparing the amplitudes of the currents in 40 and ∼900 μM Ca2+. The steady state current–voltage curves were the same at these two Ca2+ concentrations (Fig. 6 E).
The mean data from all patches including those exhibiting rundown (Fig. 6 F) were consistent with the conclusions obtained from the single patch in Fig. 6A–D. Because of rundown at high [Ca2+], data for [Ca2+] > 1.1 μM were not included when fitting the mean data to the Hill equation. This limitation plus the presence of variable amounts of rundown at lower [Ca2+] resulted in a smaller quantitative dependence of the apparent K d on voltage: the mean apparent K d differed only twofold between +120 and −120 mV (Fig. 6 F), whereas the champion patch (Fig. 6, A–D) exhibited a fourfold difference.
The finding that the Hill coefficient was >1 suggested that more than one Ca2+ ion bound to the channel to activate it. This suggests the existence of multiple Ca2+-liganded closed states in a voltage-dependent equilibrium with Ca2+-liganded open states. We propose Fig. 1 to describe the data.
Scheme S1.

In this scheme, channel opening is controlled by Ca2+ binding to more than one site in a voltage-independent manner. The voltage dependence of the currents is proposed to be due to the voltage dependence of the closing rate constants β (V). At low [Ca2+], where channel opening rate is slow, the current outwardly rectifies and exhibits time-dependent activation and deactivation, because hyperpolarization accelerates channel closure and shifts the equilibrium from the open to the closed states. In contrast, at high [Ca2+], the channel opening rate is rapid and there are multiple paths for channel opening because channels have more than one Ca2+ bound. Consequently, voltage-dependent changes in the closing rate will have less effect on the macroscopic currents. This scheme also explains why channels cannot be opened by depolarization in the absence of Ca2+ or why they cannot be closed by voltage in the presence of Ca2+.
Voltage Dependence of Current Activation and Deactivation
To test this model further, we examined in detail the kinetics of current activation and deactivation at different [Ca2+]. The deactivation was determined by exponential fitting of the tail current decay at various potentials after a depolarizing step to +120 mV (Fig. 7). At all [Ca2+] examined, the deactivating tail currents observed upon repolarization to different potentials from +120 mV were well fitted by single exponentials (superimposed, but hard to discern in Fig. 7). τdeact increased with depolarization and increased with increasing [Ca2+] within the submicromolar range (Fig. 8 A). The equivalent off gating charge movement, calculated by fitting plots of τdeact vs. Vm to the equation τdeact = Ae q F V/ RT + b, was 0.35 at 280 nM Ca2+, 0.27 at 460 nM, 0.26 at 680 nM, and 0.12 at 1 μM Ca2+ (Fig. 8 B). These data are consistent with a model in which there was a dominant rate-limiting transition in the backward direction from the open to the closed states, which was voltage sensitive at low [Ca2+]. At higher [Ca2+], the voltage sensitivity became less and deactivation was incomplete because the forward voltage-independent reaction shifted the equilibrium strongly towards open states, regardless of the backward voltage-dependent reaction.
Figure 7.

Kinetic analysis of deactivation of Ca2+-activated Cl− currents in a representative excised patch. Currents were elicited by voltage-clamp steps applied while the cytosolic face of the patch was bathed in solutions with different free [Ca2+]: (A) 280 nM Ca2+, (B) 460 nM Ca2+, (C) 670 nM Ca2+, (D) 1.1 μM Ca2+, and (E) 1.8 μM Ca2+. The patch was voltage clamped by depolarizing to +120 mV, and then stepping to various potentials between +120 and −120 mV. The tail currents were fitted to single exponentials (superimposed) and the time constants were plotted versus membrane potential. Solid curves in the right panels are best fits of the solid symbols to the equation τdeact = Ae q F V/ RT + b.
Figure 8.
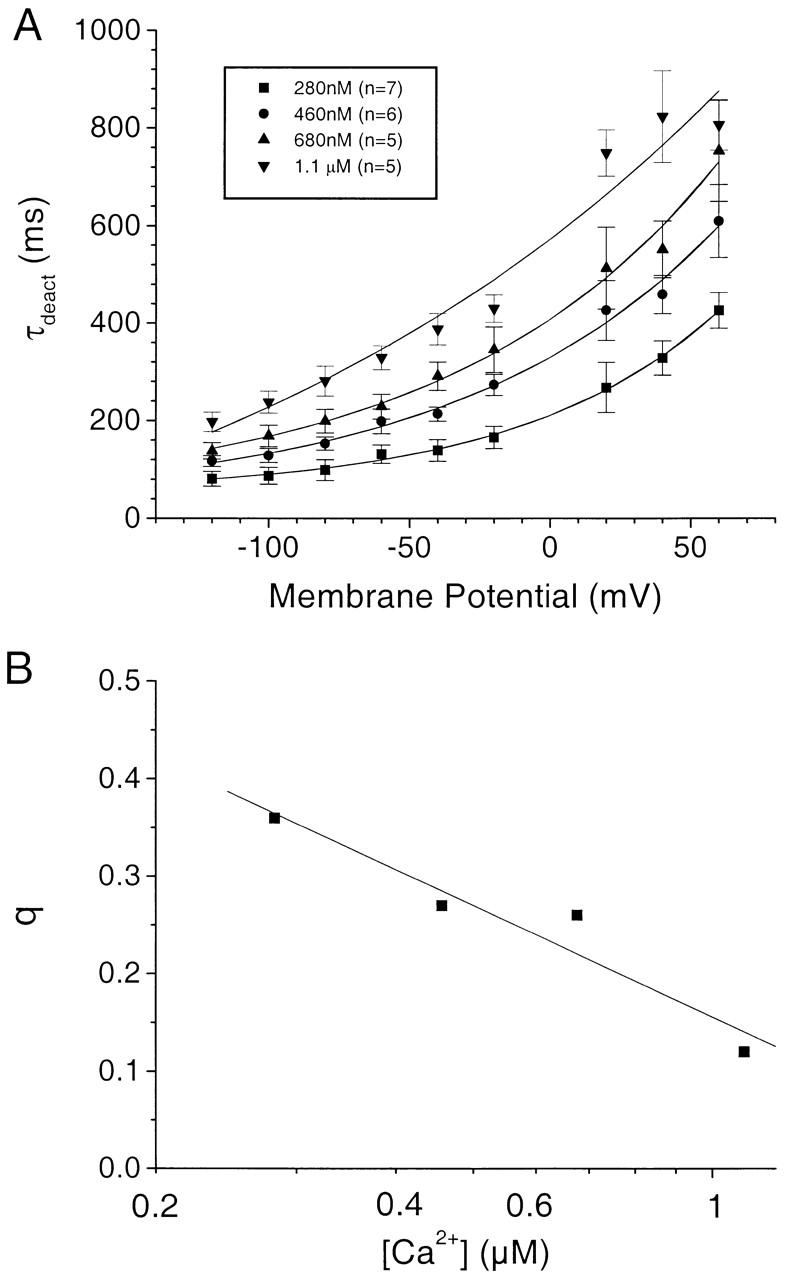
Average data for deactivation of Ca2+-activated Cl− currents. The experiments were performed as in Fig. 7. (A) The data were averaged for 280 nM Ca2+ (n = 7), 460 nM Ca2+ (n = 6), 680 nM Ca2+ (n = 5), and 1.1 μM Ca2+ (n = 5). The data were fitted to the equation τdeact = Ae q F V/ RT + b. (B) The q values calculated from the fits in A were plotted vs. [Ca2+].
We then examined the kinetics of current activation. Depolarizing steps elicited outward currents that exhibited a small instantaneous component followed by a slow activation that took ∼1 s to reach maximum (Fig. 9). Activation of the currents could be fitted with single exponentials, but the fits were often disappointing. Specifically, using least squares algorithms, if the rising phase of the current was well fit, the plateau was usually poorly fit. Using the Pade-LaPlace method (Yeramian and Claverie 1987; Bajzer et al. 1989) for fitting curves to sums of exponentials without a hypothesis about the number of components, one fast exponential component plus another slower nonexponential component were found. Regardless of the method used for fitting the activation, the time constants of the exponential components of the activation usually were weakly influenced by membrane potential or increased with depolarization (Fig. 9 and Fig. 10 A). If channel opening were voltage sensitive, we would expect channel activation to accelerate with depolarization. Although activation was not clearly voltage dependent, activation was Ca2+ dependent: activation became faster with increasing [Ca2+] (Fig. 10 B). We interpret the increased current produced by depolarization at low [Ca2+] as a consequence of a shift in the equilibrium between closed and open states as a result of changing the voltage-sensitive backward rate constant β. The time constant of the approach to the new equilibrium upon depolarization will approximate 1/(α [Ca2+] + β). Thus, as β becomes larger with hyperpolarization, the time constant of activation will become smaller for a constant α [Ca2+]. This is observed with the lowest [Ca2+] in Fig. 10 A. With higher [Ca2+], α [Ca2+] dominates the reaction and the effect of changing β is negligible. As the [Ca2+] becomes greater, the time constant of activation becomes smaller, as expected from the model.
Figure 9.

Kinetic analysis of activation of Ca2+-activated Cl− currents in a representative excised patch. Currents were elicited by voltage-clamp steps applied while the cytosolic face of the patch was exposed to solutions with different free [Ca2+]. The patch was voltage clamped by stepping to various potentials between +200 and +40 mV. The activating phase of the currents were fitted to single exponentials (superimposed) and the time constants were plotted versus membrane potential.
Figure 10.

Average data for activation of Ca2+-activated Cl− currents in excised patch. The experiments were performed as in Fig. 9. (A) Dependence of current activation on voltage at different [Ca2+]. (B) The data from A were replotted to show the dependence of current activation on free [Ca2+].
Current Activation and Deactivation in Response to Rapid Ca2+ Applications
As another test of this model, we examined the response of the current to rapid applications of Ca2+ at constant transmembrane potentials. The solution bathing the cytosolic face of the patch was changed from <10 nM Ca2 to various [Ca2+] in <3 ms (Fig. 11 A) as described in METHODS. The membrane potential was held at voltages between −120 and +120 mV and the Ca2+ concentration was jumped for a 5-s duration (Fig. 11 B). The turn-on and -off of the current with rapid Ca2+ perfusion were characterized by time constants, called τon and τoff to distinguish them from voltage-dependent activation τact and τdeact described in Fig. 7 Fig. 8 Fig. 9 Fig. 10. At 40 μM Ca2+, the current increased very rapidly (with a τon that was probably limited by the switching time of the solution) at all potentials (Fig. 11C and Fig. E). The τoff upon washing out Ca2+ was voltage dependent and was fit by a single exponential. The current turned off more slowly at more positive potentials (Fig. 11C and Fig. D). In a different patch, when the solution was switched from <10 nM Ca2+ to 400 nM Ca2+, τon was much slower (Fig. 11F and Fig. H), but τoff was very similar to that observed at 40 μM Ca2+ (F and G).
Figure 11.
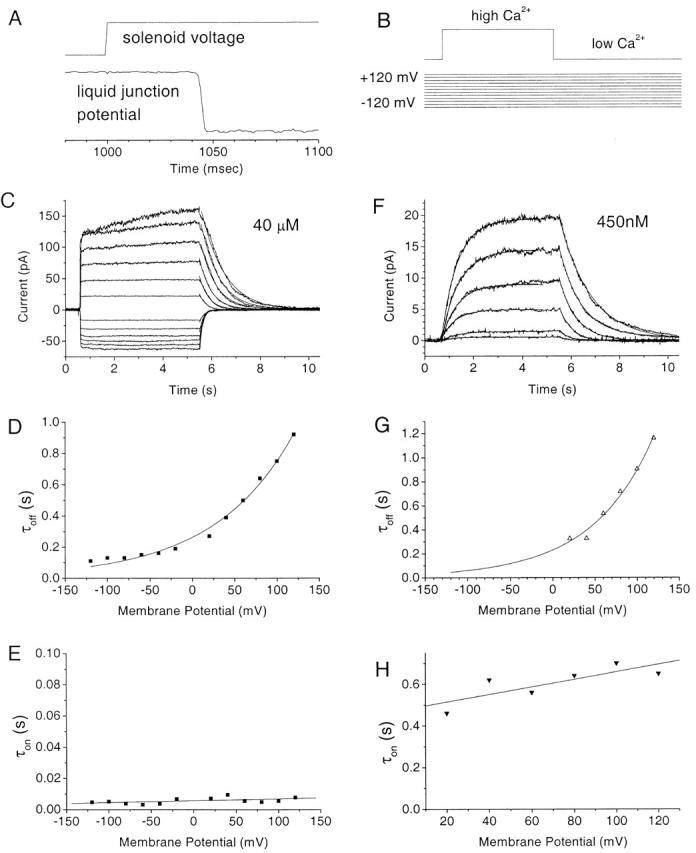
Activation of Ca2+-activated Cl− currents in an excised patch by rapid perfusion of Ca2+. (A) Calibration of rate of change of solution. The liquid junction potential of a high resistance (50 MΩ) electrode placed in the solution stream was measured as the solution was changed from 0.1 to 2 M KCl. (Top) Solenoid voltage, (bottom) liquid junction potential. There is an ∼40-ms lag between switching the solenoid and the onset of the change in junction potential due to the dead volume of the perfusion line. Once the potential begins to change, the time to change from 10 to 90% of maximum was ∼3 ms. (B) Protocol. The patch was switched to a voltage between +120 and −120 mV from the holding potential of 0 mV, 5 s before changing the perfusion from low to high [Ca2+]. (C) Current traces recorded upon switching from <10 nM Ca2+ to 40 μM Ca2+ (the activation and deactivation are fitted to single exponentials; superimposed). (D) The time constant of turn off (τoff) of the current was plotted versus potential. (E) The time constant of the turn on (τon) of the current was plotted versus potential. (F) Current traces recorded upon switching from <10 to 450 nM Ca2+. Single exponential fits to activation and deactivation are superimposed. (G and H) Time constants as a function of potential.
The mean data from many such experiments are shown in Fig. 12. Although there was some variability among experiments, τoff was independent of Ca2+ and was an exponential function of voltage, being greatest at depolarized potentials (Fig. 12 A). The plot of τoff versus voltage was quantitatively similar to the plot of τdeact versus voltage (Fig. 8 A) for low [Ca2+]. The value of q estimated from Fig. 12 A was 0.26. Both the data from voltage jumps and Ca2+ concentration jumps are consistent with deactivation of the current being dominated by a single voltage-dependent step.
Figure 12.
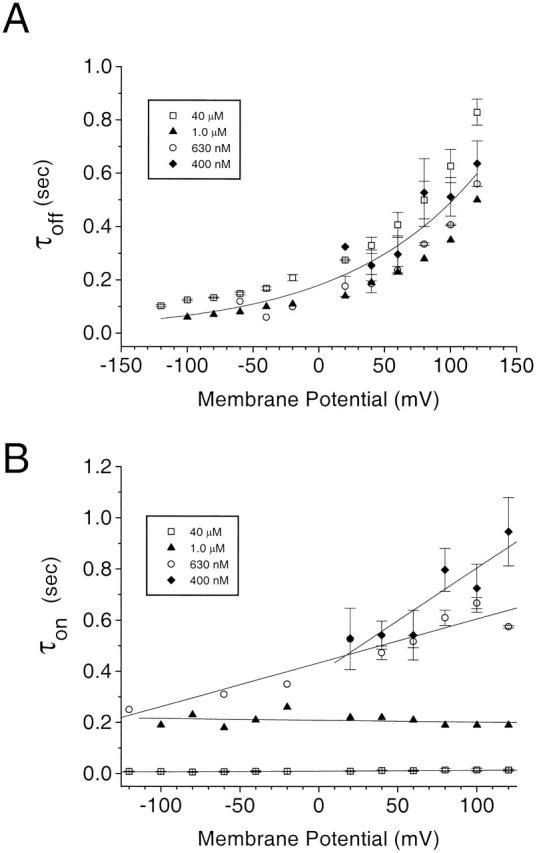
Average data (n = 3–15) from rapid perfusion experiments. Experiments were performed as described in Fig. 11. τoff (A) and τon (B) are plotted for 40 μM Ca2+ (□), 1 μM Ca2+ (▴), 630 nM Ca2+ (○), 400 nM Ca2+ (♦). The solid line in A is a single exponential fit to the average of all the data at different [Ca2+]: τoff = 0.064 * exp (0.26 * FV/RT).
In contrast to the Ca independence of τoff, τon was strongly dependent on [Ca2+]: activation was faster at higher [Ca2+] (Fig. 12 B). τon was voltage independent at high [Ca2+], but became progressively more voltage dependent as [Ca2+] was lowered. Because τon for a simple two-state model will be equal to 1/α + β (where α is the forward and β is the backward rate constant), as α becomes slower at low [Ca2+], τon will approach 1/β. Thus, the apparent voltage dependence of τon at low [Ca2+] can be explained by the voltage dependence of the backward reaction.
Ionic Selectivity of the Channel
Using two-microelectrode voltage clamp, we have previously shown that both inward (ICl2) and outward (ICl1-S and ICl1-T) Ca2+-activated Cl− currents have the same anionic selectivity sequence (I− > Br− > Cl−), which is consistent with sequence 1 of Eisenman (Wright and Diamond 1977). But there were quantitative differences between these three currents (Kuruma and Hartzell 1999). Although we questioned whether these differences might be explained by technical artifacts, we also raised the possibility that inward and outward currents might be carried by different species of channels. To examine this idea further, we measured the anionic selectivity of the inward and outward currents in different [Ca2+] in excised patches using the same voltage protocols we used in our two-microelectrode voltage-clamp study (Kuruma and Hartzell 1999).
Cytosolic Cl− was partially replaced with I− or Br− and the change in reversal potential of the instantaneous tail currents was measured. Fig. 13 shows the effects of changing from Cl− to I−-containing solutions with three different conditions: (a) outward current at low [Ca2+] (1 μM), where outward current shows time-dependent activation (mimicking ICl1-S) and inward current is small (Fig. 13, A–C); (b) outward current at high [Ca2+] (2 μM), where both outward and inward currents were fully developed (Fig. 13, D–F); and (c) inward current under the same condition as b (Fig. 13, G–I). We measured the shift in reversal potentials and the calculated permeability ratio using Goldman-Hodgkin-Katz equation (Hille 1992). As shown in Fig. 13 J, the anionic selectivity with the three different conditions was quantitatively identical to a relative anionic selectivity of I > Br > Cl 3.6:1.9:1.0. On this basis, we can exclude the hypothesis that there are two types of channels with different anionic selectivities.
Figure 13.
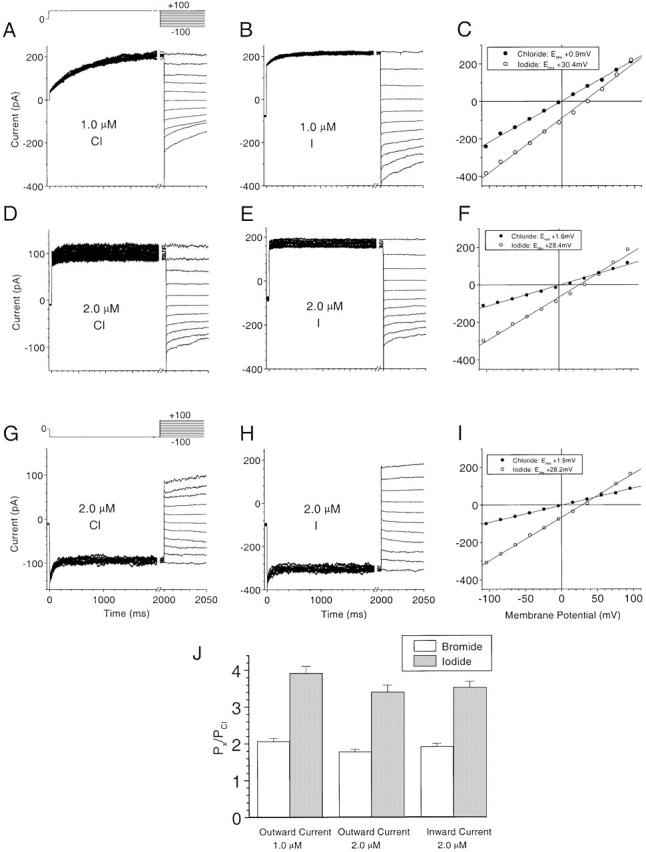
Anionic selectivity of the channel. The reversal potential of the outward currents activated by 1 (A–C) and 2 (D–F) μM Ca2+ were determined by measuring the instantaneous tail currents at different potentials following a pulse to +100 mV. The voltage protocol is shown above A. The reversal potential of the inward currents activated by 2 μM Ca2+ (G–I) were determined in the same way following a pulse to −100 mV. The voltage protocol is shown above G. The pipet solution contained 158.4 mM Cl−, the bath contained either 158.4 mM Cl− (A, D, and G) or 150 mM I− and 8.4 mM Cl− (B, E, and H). (C, F, and I) Tail current amplitudes for the symmetrical chloride solutions (•) and the low Cl−, high iodide solution (○). (J) Bar graph of the anionic permeability ratios (P x/P Cl) for outward currents at 1 and 2 μM Ca2+ and for inward current at 2 μM Ca2+.
Modeling the Experimental Data
To test whether the gating scheme proposed above could describe the kinetics of the Ca-activated Cl currents, we calculated the expected macroscopic currents using this gating scheme and the rate constants derived from our experiments.
We first calculated the currents activated by rapid Ca2+ application as in Fig. 11. We assumed three Ca2+-liganded states with identical and independent affinities for Ca2+. The Ca2+-dependent on rate per binding site was assumed to be 3 × 10⁶ mol−1 s−1 and the Ca2+-independent off rate was assumed to be 50 s−1. The rate constants α 1, α 2, and α 3 for conversion from closed states to open states were assumed to be Ca2+ and voltage independent and were assumed to be more rapid as the closed states became more heavily Ca2+ liganded (α 1 = 10, α 2 = 30, α 3 = 100). The backward rates from open to closed were assumed to be voltage dependent according to the equation β(V) = k * exp (V1 + Vm * V2). k, V1, and V2 were estimated by fitting the off rates derived from the data in Fig. 12 A to the equation. The values were k = 224, V1 = −3.8, and V2 = −10. For simplicity, we ignored transitions between open states.
Fig. 14 shows simulations of the macroscopic currents using a Monte-Carlo modeling program developed by Dr. Steve Traynelis (Emory University School of Medicine). The currents in response to Ca2+ jumps from <10 nM to 50 μM Ca2+ (Fig. 14 A) and 500 nM Ca2+ (Fig. 14 B) closely approximate the experimentally recorded currents in both waveform and rectification (compare with Fig. 11C and Fig. D). The τoff and τon of the simulated and actual currents are similar (compare Fig. 15E and Fig. F, with 11, D–H). The model also predicts well the currents observed in response to voltage-clamp steps (Fig. 14C and Fig. D). Simulated currents in excised patches in response to voltage pulses at 50 μM Ca2+ (Fig. 14 C) and 500 nM Ca2+ (D) also approximate the behavior of the actual currents (compare with Fig. 3). Also, the current–voltage relationship shifts from outwardly rectifying to linear within this range of [Ca2+] (Fig. 14 G), as was described in Fig. 3.
Figure 14.

Simulation of Ca2+-activated Cl currents using the model and rate constants described in the text. The macroscopic currents were modeled using a Monte-Carlo simulation program written by Dr. Steve Traynelis. (A and B) Simulated currents in response to Ca2+ steps from <10 nM to 50 μM (A) or 500 nM (B). (C and D) Simulated currents in response to voltage-clamp pulses from 0 mV to voltages between +120 and −120 mV (20-mV increments) at a steady 50 μM Ca2+ (C) or 500 nM Ca2+ (D). (E) Deactivation time constants measured from traces in A and B. (F) Activation time constants measured from simulated currents in A and B. (G) Steady state current–voltage relationship for simulated currents in C and D.
Figure 15.

Ca2+ concentration determines direction of Cl current in intact cells. Normal oocytes (A and B) or oocytes heterologously expressing iGluR3 (C–E) were bathed in normal Ringer solution (A and B) or NMDG-Ringer (C–E) and were voltage clamped with two microelectrodes, injected with 23 nl 1 mM IP3 (arrows), and exposed to 100 μM kainic acid (KA) in the bath as indicated (bar) (Kuruma and Hartzell 1999). The voltage protocol was an ∼1-s duration pulse to +40 mV, followed by an ∼1-s pulse to −120 mV from a holding potential of −35 mV. (A and C) Plot of current amplitudes during the experiment. (▪) Outward current at the end of the +40 mV pulse, (○ and •) peak inward current at end of the −120-mV pulse. (B and D) Traces a–c corresponding to times indicated in A and C. (E) Ca fluorescence in same oocyte shown in C and D. The oocyte was injected with Ca-green dextran and imaged by confocal microscopy during the +40-mV (▪) and −120-mV (○) voltage-clamp pulses, as previously described (Machaca and Hartzell 1999).
The model is a reasonable approximation to the data, but it fails quantitatively to predict the time course of current deactivation in response to voltage pulses from positive potentials to −120 mV at steady 500 nM Ca2+ (Fig. 14 E). The kinetics of simulated current deactivation were slower than we observed experimentally. Also, the model predicts that τoff is somewhat slower for 50 μM Ca2+ than for 500 nM Ca2+, which was not observed experimentally. Manipulation of the various rate constants were not able to correct these differences without introducing other discrepancies between the data and the model. Thus, although this gating scheme simulates the general features of the data, it is only a rough approximation. It is possible that rundown may contribute to the differences between the model and the data.
It was not possible to model the data with schemes in which the forward opening rate constants were voltage sensitive. It was possible to reproduce some of the general features of the actual currents with schemes having fewer states. A simple two-step closed–open reaction with the forward rate being Ca2+ sensitive and the backward rate being voltage sensitive was able to roughly model the currents, but the quantitative correspondence with the data was not as good as the multistate model presented here.
Cl Currents Can Be Excitatory or Inhibitory, Depending on the Ca2+ Signals
The data in this paper show that, depending on the level of cytosolic Ca2+, a single species of Cl channel can behave qualitatively differently. This could be important in excitable cells where, at low [Ca2+], these channels would carry mainly outward current and thus come into play in repolarizing the cell after an excitatory stimulus. In contrast, at high [Ca2+], these channels could also carry inward current at resting potentials below ECl (between −30 and −60 mV in most excitable cells) and become excitatory. We tested this hypothesis in the oocyte model by examining the ability of IP3-stimulated Ca2+ release from stores and Ca2+ influx to regulate the Cl− currents (Fig. 15). Ca2+ influx was controlled by the heterologously expressed ligand-gated inotropic glutamate receptor (iGluR3) that was activated by application of kainic acid under conditions where the only permeant cation present was Ca2+. In the absence of activation of iGluR3, injection of IP3 stimulated Ca2+ release from stores and activation of outward current at +40 mV (Fig. 15A and Fig. B). The inward current observed under these conditions was due to slow deactivation of the tail current (Fig. 15 B): very little steady state inward current was detectable. However, if iGluR3 was activated with kainic acid to induce a small amount of Ca2+ influx, injection of the same amount of IP3 now resulted in a large increase in both inward and outward currents (Fig. 15 C). Cytosolic Ca2+ was measured in the same oocyte simultaneously by confocal microscopy during the +40 and −120 mV voltage-clamp pulses (Machaca and Hartzell 1999) (Fig. 15 E). Application of kainic acid caused a small influx of Ca2+, detected as a voltage-dependent increase in fluorescence at −120 mV (larger at −120 mV where the driving force for Ca2+ influx was high). Injection of IP3 then stimulated a voltage-independent release of Ca2+ from stores. The small increase in Ca2+ influx after the peak Ca2+ signal was due to development of store-operated Ca2+ influx (Machaca and Hartzell 1999). These data show that altering the basal cytosolic [Ca2+] within a range that has little direct effect on the Ca2+-activated Cl− channels can strongly modulate the current produced by a larger Ca2+ signal and switch the Cl− current from outward only to both inward and outward. Thus, depending on the membrane potential and ECl (which may be modulated by other Cl− channels and transporters), the amplitude of the Ca2+ signal can result in an excitatory or inhibitory response mediated by the same ion channel.
DISCUSSION
Gating Mechanisms of Ca2+-activated Cl− Channels
The data presented here are consistent with the gating scheme proposed in RESULTS in which Ca2+-activated Cl− channels exist in multiple closed states having zero to three Ca2+ ions bound. This is supported by the data in Fig. 6 showing that the relationships between conductance and Ca2+ are fitted by curves with Hill coefficients between 2.5 and 3.2. The channel cannot open from the Ca2+-free state (C 0), because potentials as large as +200 mV do not activate current at <10 nM Ca2+ (Fig. 1 and Fig. 3). However, it is likely that the channel can open from each of the Ca-liganded closed states (C 1 ∼ Cn). The transition from the closed to open states is virtually voltage independent, as shown by the voltage independence of activation (Fig. 10 and Fig. 12 B). However, the transition from open to closed is voltage sensitive because the deactivation of the current by voltage or Ca2+ concentration jumps is fit by a single exponential and is voltage dependent (Fig. 8 and Fig. 12). The leftward shift of the conductance–voltage curve with increasing [Ca2+] is explained by the fact that as more channels bind Ca2+, the overall equilibrium is shifted towards open channels. At hyperpolarized potentials, the equilibrium can be shifted towards closed states by increasing the rate constant for channel closing. However, at high [Ca2+], β is slow relative to the opening rates so that voltage has little effect under these conditions.
This gating scheme is supported by data from other laboratories. Gomez-Hernandez et al. 1997, using excised patches from Xenopus oocytes, showed that activation of the current by Ca2+ concentration jumps at high [Ca2+] (1.8 mM and 27 μM) was voltage independent, whereas deactivation was voltage dependent, as we show in Fig. 12 A. But these authors did not examine the kinetics of currents exposed to lower [Ca2+]. Our data also complement whole-cell data from other laboratories on rat parotid gland cells (Arreola et al. 1996) and microvascular endothelial cells (Nilius et al. 1997b). Both of these laboratories perfused intact cells with solutions containing different [Ca2+] in the whole-cell mode and showed that the channels in these cells were regulated by both Ca2+ and voltage. Our data differs from theirs in one respect. They find that the Hill coefficient increases with depolarization, but we find that it decreases slightly.
It is interesting to compare this kinetic scheme with one proposed by Cui et al. 1997 for the large-conductance Ca2+-activated K (BK) channel. There are several fundamental differences between BK channel gating and our gating model of the Ca2+-activated Cl− channel. First, the BK channel exhibits intrinsic voltage dependence and can be opened by voltage in the absence of Ca2+ or closed by voltage in the presence of Ca2+. This is not true of the Ca2+-activated Cl− channel because the opening rate constant is not voltage sensitive. Because the voltage dependence of the Ca2+-activated Cl− channel results from the voltage dependence of the closing rate, the channel obviously cannot be opened in the absence of Ca2+ by altering the closing rate constant. Likewise, in the presence of Ca2+, there will always be an equilibrium level of open states, regardless of the value of β(V). Thus, voltage will not be capable of completely turning off the current.
Mechanisms of Regulation of Ca2+-activated Cl− Channels
There remains considerable uncertainty about whether Ca2+-activated Cl− channels are activated by direct binding of Ca2+, by binding of calmodulin (CaM) or other Ca2+-binding proteins, or by Ca2+-dependent enzymatic modification (phosphorylation/dephosphorylation). Some channels can be stably activated in excised patches by Ca2+ in the absence of ATP (Frizzell et al. 1986; Takahashi et al. 1987; Martin 1993; Collier et al. 1996; Gomez-Hernandez et al. 1997), suggesting that channels might be regulated directly by Ca2+ binding to the channel. In other experiments, however, channel activity runs down quickly after excision, suggesting the possibility that components in addition to Ca2+ are required to open the channel (Klöckner 1993; Morris and Frizzell 1993; VanRenterghem and Lazdunski 1993; Large and Wang 1996; Schlenker and Fitz 1996; Nilius et al. 1997a). In our experiments, the currents often ran down, in contrast to what has been reported by some other labs on the same preparation (Gomez-Hernandez et al. 1997; Takahashi et al. 1987). However, the possibility exists that in the experiments of these other labs, rundown had already occurred before recording began.
It has been shown that some types of Ca2+-activated Cl currents require Ca2+-dependent phosphorylation for activation. A role for CaMKII-dependent phosphorylation in the activation of certain Ca2+ activated Cl− currents has been suggested because the currents are inhibited by KN62 or a CaMKII-inhibitor peptide (Nishimoto et al. 1991; Tohda et al. 1991; Wagner et al. 1991; Worrell and Frizzell 1991; Morris and Frizzell 1993; Schumann et al. 1993; Chan et al. 1994; Braun and Schulman 1995; Chao et al. 1995; Xie et al. 1996; Arreola et al. 1998). CaMKII, however, is apparently not required for activation of all kinds of Ca2+-activated Cl channels: a recent study showed that, although macroscopic currents in parotid gland and T84 intestinal cells are very similar, the currents in T84 cells are inhibited by CaMKII inhibitors, whereas the currents in parotid cells are not (Arreola et al. 1998). These differences could possibly be explained by differences in the activity of protein phosphatases in the different cell types or to differences in the regulation of different kinds of Ca2+-activated Cl channels. To make the situation more complicated, in smooth muscle cells, CaMKII-dependent phosphorylation inhibits channel activity (Wang and Kotlikoff 1997) and in A6 kidney cells alkaline phosphatase (presumably via protein dephosphorylation) increases inward currents (Marunaka and Eaton 1990).
The experiments we present here show clearly that the channel can be activated by Ca2+ in the absence of ATP and thus show that the transition from the closed to the open state is not tightly coupled to phosphorylation and is probably due to direct Ca2+ binding to a channel subunit. The rundown phenomenon, however, could be due to dephosphorylation of channels that are phosphorylated before the patch is excised, but if this is the case, phosphorylation would only make the channel competent to be opened by Ca2+ and would not open the channel directly.
Physiological Significance
Ca2+-activated Cl− channels are certainly less well understood than cation channels or some other anion channels, such as CFTR, γ-aminobutyric acid receptors, or the ClC family (Jentsh and Gunther 1997). Nevertheless, it is clear that these channels are found in many cell types and play important roles in many tissues, including smooth muscle and epithelia (Large and Wang 1996; Morris 1999).
These data have a number of important physiological implications. In Xenopus egg, sperm entry during fertilization turns on Ca2+-activated Cl− channels as a consequence of Ca2+ release from internal stores. Opening these channels produces a transient depolarization of the egg cell membrane (the “fertilization potential”) to prevent polyspermy (the so-called “fast block to polyspermy”) (Webb and Nuccitelli 1985; Jaffe and Cross 1986; Fontanilla and Nuccitelli 1998). Our data predicts that increases in [Ca2+] above 1 μM would be required to produce the fertilization potential because the strong outward rectification of the Cl− current at lower [Ca2+] would strongly limit the inward current required for depolarization. This expectation is supported by measurements showing that [Ca2+] at the membrane reaches ∼1.2 μM after fertilization (Fontanilla and Nuccitelli 1998). Because the membrane potential of the egg is determined almost entirely by Cl− conductance, the voltage-dependent Ca2+ sensitivity of the Cl− channels in the egg may serve the rather simple function of ensuring a high Ca2+ threshold for activation of the fast block to polyspermy. The fertilization potential is transient and lasts only ∼15 min. As Ca2+ declines with time after fertilization, the outward rectification of the Ca2+-activated Cl− current may assist in repolarization of the membrane.
This difference in behavior of the channel at different [Ca2+] explains the complex behavior of Ca2+-activated Cl− currents in Xenopus oocytes, which we have previously described. We have previously shown (Hartzell 1996; Kuruma and Hartzell 1999; Machaca and Hartzell 1999) that there are two different macroscopic currents in these cells. One current (ICl2) is activated selectively by Ca2+ influx, whereas the other (ICl1-S and ICl1-T) is activated both by influx and release of Ca2+ from stores. We have confirmed that in oocytes without a vitelline membrane, these same currents develop in response to IP3 injection (data not shown). Although we have been ambivalent as to whether these different macroscopic currents are mediated by the same or different types of channels, we now feel confident that we can explain the currents by a single species of channel that is gated by the mechanisms described in this paper. The combination of different Ca2+ concentrations provided by Ca2+ released from stores (lower concentration) and Ca2+ influx (higher concentration) coupled with the voltage sensitivity of the channel at low [Ca2+] can generate complex macroscopic currents. This adds a new dimension to how Ca2+ signals may be interpreted by cells.
In excitable cells where the membrane potential regularly oscillates above and below ECl due to other conductances, these different behaviors of Ca2+-activated Cl− channels at different [Ca2+] could have very interesting consequences. For example, in some species, such as rabbit, an outward Ca2+-activated Cl− current normally plays a role in phase 1 repolarization of the cardiac action potential (Zygmunt and Gibbons 1992; Zygmunt 1994; Papp et al. 1995). However, under conditions of Ca2+ overload, this same channel may produce transient inward currents that are arrhythmogenic (January and Fozzard 1988; Berlin et al. 1989; Zygmunt et al. 1998). This Ca2+-activated Cl− channel in rabbit heart has many features including single channel conductance (Collier et al. 1996) and anionic selectivity (Kawano et al. 1995) in common with the Xenopus oocyte channel. Thus, the voltage and Ca2+ sensitivity of Ca2+-activated Cl− channels place these channels in a pivotal role for regulation of cellular excitability.
Acknowledgments
We thank Dr. Steve Traynelis for extensive madvice and discussion and for help with the modeling in 14, and we thank Drs. Anant Parekh, Rick Aldrich, Nael McCarty, Shawn Zeltwanger, Khaled Machaca, and Jonathan Davis for comments on the manuscript and helpful discussion. We also thank Elizabeth Lytle and Alyson Ellingson for expert technical assistance.
Supported by National Institutes of Health grant RO1 GM 55276.
Footnotes
Abbreviations used in this paper: CaM, calmodulin; iGluR3, inotropic glutamate receptor.
References
- Anderson M., Welsh M. Calcium and cAMP activate different chloride channels in the apical membrane of normal and cystic fibrosis epithelia. Proc. Natl. Acad. Sci. USA. 1998;88:6003–6007. doi: 10.1073/pnas.88.14.6003. [DOI] [PMC free article] [PubMed] [Google Scholar]
- Arreola J., Melvin J.E., Begenisich T. Activation of calcium-dependent chloride channels in rat parotid acinar cells. J. Gen. Physiol. 1996;108:35–47. doi: 10.1085/jgp.108.1.35. [DOI] [PMC free article] [PubMed] [Google Scholar]
- Arreola J., Melvin J.E., Begenisich T. Differences in regulation of Ca2+-activated Cl− channels in colonic and parotid secretory cells. Am. J. Physiol. 1998;274:C161–C166. doi: 10.1152/ajpcell.1998.274.1.C161. [DOI] [PubMed] [Google Scholar]
- Bajzer E., Myers A.C., Sedarous S.S., Prendergast F.G. Pade-Laplace method for analysis of fluorescence intensity decay. Biophys. J. 1989;56:79–93. doi: 10.1016/S0006-3495(89)82653-0. [DOI] [PMC free article] [PubMed] [Google Scholar]
- Barnes S., Deschenes M.C. Contribution of Ca and Ca-activated Cl channels to regenerative depolarization and membrane bistability of cone photoreceptors. J. Neurophysiol. 1992;68:745–755. doi: 10.1152/jn.1992.68.3.745. [DOI] [PubMed] [Google Scholar]
- Berlin J.R., Cannell M.B., Lederer W.J. Cellular origins of the transient inward current in cardiac myocytes. Role of fluctuations and waves of elevated intracellular calcium. Circ. Res. 1989;65:115–126. doi: 10.1161/01.res.65.1.115. [DOI] [PubMed] [Google Scholar]
- Bers D.M., Patton C., Nuccitelli R. A practical guide to the preparation of Ca2+ buffers. Methods Cell Biol. 1994;40:3–29. doi: 10.1016/s0091-679x(08)61108-5. [DOI] [PubMed] [Google Scholar]
- Boton R., Dascal N., Gillo B., Lass Y. Two calcium-activated chloride conductances in Xenopus laevis oocytes permeabilized with the ionophore A23187. J. Physiol. 1989;408:511–534. doi: 10.1113/jphysiol.1989.sp017473. [DOI] [PMC free article] [PubMed] [Google Scholar]
- Braun A.P., Schulman H. A non-selective cation current activated via the multifunctional Ca2+-calmodulin-dependent protein kinase in human epithelial cells. J. Physiol. 1995;488:37–55. doi: 10.1113/jphysiol.1995.sp020944. [DOI] [PMC free article] [PubMed] [Google Scholar]
- Chan H.C., Kaetzel M.A., Gotter A.L., Dedman J.R., Nelson D.J. Annexin IV inhibits calmodulin-dependent protein kinase II-activated chloride conductance. A novel mechanism for ion channel regulation. J. Biol. Chem. 1994;269:32464–32468. [PubMed] [Google Scholar]
- Chao A.C., Kouyama K., Heist E.K., Dong Y.-J., Gardner P. Calcium- and CaMKII-dependent chloride secretion induced by the microsomal Ca2+-ATPase inhibitor 2,5-Di-(tert-butyl)-1,4-hydroquinone in cystic fibrosis pancreatic epithelial cells. J. Clin. Invest. 1995;96:1794–1801. doi: 10.1172/JCI118225. [DOI] [PMC free article] [PubMed] [Google Scholar]
- Clarke L.L., Grubb B.R., Yankaskas J.R., Cotton C.U., McKenzie A., Boucher R.C. Relationship of a non–cystic fibrosis transmembrane conductance regulator-mediated chloride conductance to organ-level disease in Cftr(−/−) mice. Proc. Natl. Acad. Sci. USA. 1994;91:479–483. doi: 10.1073/pnas.91.2.479. [DOI] [PMC free article] [PubMed] [Google Scholar]
- Cliff W.H., Frizzell R.A. Separate Cl conductances activated by cAMP and Ca in Cl secreting epithelial cells. Proc. Natl. Acad. Sci. USA. 1990;87:4956–4960. doi: 10.1073/pnas.87.13.4956. [DOI] [PMC free article] [PubMed] [Google Scholar]
- Collier M.L., Levesque P.C., Kenyon J.L., Hume J.R. Unitary Cl− channels activated by cytoplasmic Ca2+ in canine ventricular myocytes. Circ. Res. 1996;78:936–944. doi: 10.1161/01.res.78.5.936. [DOI] [PubMed] [Google Scholar]
- Cui J., Cox D.H., Aldrich R.W. Intrinsic voltage dependence and Ca2+ regulation of mslo large conductance Ca-activated K+ channels. J. Gen. Physiol. 1997;109:647–673. doi: 10.1085/jgp.109.5.647. [DOI] [PMC free article] [PubMed] [Google Scholar]
- Cunningham S.A., Awayda M.S., Bubien J.K, Ismailov I.I., Arrate M.P., Berdiev B.K., Benos D.J., Fuller C.M. Cloning of an epithelial chloride channel from bovine trachea. J. Biol. Chem. 1995;270:31016–31026. doi: 10.1074/jbc.270.52.31016. [DOI] [PubMed] [Google Scholar]
- Dascal N. The use of Xenopus oocytes for the study of ion channels. CRC Crit. Rev. Biochem. 1987;22:317–387. doi: 10.3109/10409238709086960. [DOI] [PubMed] [Google Scholar]
- DeCastro F., Geijo-Barrientos E., Gallego R. Calcium-activated chloride current in normal mouse sympathetic ganglion cells. J. Physiol. 1997;498:397–408. doi: 10.1113/jphysiol.1997.sp021866. [DOI] [PMC free article] [PubMed] [Google Scholar]
- Fine B.P., Marques E.S., Hansen K.A. Calcium-activated sodium and chloride fluxes modulate platelet volumerole of Ca2+ stores. Am. J. Physiol. 1994;267:C1435–C1441. doi: 10.1152/ajpcell.1994.267.5.C1435. [DOI] [PubMed] [Google Scholar]
- Fontanilla R.A., Nuccitelli R. Characterization of the sperm-induced calcium wave in Xenopus eggs using confocal microscopy. Biophys. J. 1998;75:2079–2087. doi: 10.1016/S0006-3495(98)77650-7. [DOI] [PMC free article] [PubMed] [Google Scholar]
- Freeman L.C., Pacioretty L.M., Moise N.S., Kass R.S., Gilmour R.E., Jr. Decreased density of I(to) in left ventricular myocytes from German shepherd dogs with inherited arrhythmias. J. Cardiovasc. Electrophysiol. 1997;8:872–883. doi: 10.1111/j.1540-8167.1997.tb00848.x. [DOI] [PubMed] [Google Scholar]
- Frizzell R.A., Rechkemmer G., Shoemaker R.L. Altered regulation of airway epithelial cell chloride channels in cystic fibrosis. Science. 1986;233:558–560. doi: 10.1126/science.2425436. [DOI] [PubMed] [Google Scholar]
- Gomez-Hernandez J.-M., Stühmer W., Parekh A.B. Calcium dependence and distribution of calcium-activated chloride channels in Xenopus oocytes. J. Physiol. 1997;502:569–574. doi: 10.1111/j.1469-7793.1997.569bj.x. [DOI] [PMC free article] [PubMed] [Google Scholar]
- Gray M.A., Winpenny J.P., Verdon B., McAlroy H., Argent B.E. Chloride channels and cystic fibrosis of the pancreas. Biosci. Rep. 1995;15:531–541. doi: 10.1007/BF01204355. [DOI] [PubMed] [Google Scholar]
- Grubb B.R., Vick R.N., Boucher R.C. Hyperabsorption of Na+ and raised Ca2+-mediated Cl− secretion in nasal epithelia of CF mice. Am. J. Physiol. 1994;266:C1478–C1483. doi: 10.1152/ajpcell.1994.266.5.C1478. [DOI] [PubMed] [Google Scholar]
- Gruber A.D., Elble R.C., Ji H.-L., Schreur K.D., Fuller C.M., Pauli B.U. Genomic cloning, molecular characterization, and functional analysis of human CLCA1, the first human member of the family of Ca2+-activated Cl channel proteins. Genomics. 1998;54:200–214. doi: 10.1006/geno.1998.5562. [DOI] [PubMed] [Google Scholar]
- Han X., Ferrier G.R. Ionic mechanisms of transient inward current in the absence of Na+–Ca2+ exchange in rabbit cardiac Purkinje fibres. J. Physiol. 1992;456:19–38. doi: 10.1113/jphysiol.1992.sp019324. [DOI] [PMC free article] [PubMed] [Google Scholar]
- Han X., Ferrier G.R. Transient inward current is conducted through two types of channels in cardiac Purkinje fibres. J. Mol. Cell. Cardiol. 1996;28:2069–2084. doi: 10.1006/jmcc.1996.0200. [DOI] [PubMed] [Google Scholar]
- Hartzell H.C. Activation of different Cl currents in Xenopus oocytes by Ca liberated from stores and by capacitative Ca influx. J. Gen. Physiol. 1996;108:157–175. doi: 10.1085/jgp.108.3.157. [DOI] [PMC free article] [PubMed] [Google Scholar]
- Hille B. Ion Channels of Excitable Membranes 1992. Sinauer Associates, Inc; Sunderland, MA: pp. 341–344 [Google Scholar]
- Jaffe L.A., Cross N.L. Electrical regulation of sperm–egg fusion. Ann. Rev. Physiol. 1986;48:191–200. doi: 10.1146/annurev.ph.48.030186.001203. [DOI] [PubMed] [Google Scholar]
- January C.T., Fozzard H.A. Delayed afterdepolarizations in heart musclemechanisms and relevance. Pharmacol. Rev. 1988;40:219–227. [PubMed] [Google Scholar]
- Jentsh T., Gunther W. Chloride channels, an emerging molecular picture. Bioessays. 1997;19:117–126. doi: 10.1002/bies.950190206. [DOI] [PubMed] [Google Scholar]
- Ji H., Duvall M.D., Patton H.K., Satterfield C.L., Fuller C.M., Benos D.J. Functional expression of a truncated Ca activated Cl channel and activation by phorbol ester. Am. J. Physiol. 1998;455–464 doi: 10.1152/ajpcell.1998.274.2.C455. [DOI] [PubMed] [Google Scholar]
- Johnson L.G., Boyles S.E., Wilson J., Boucher R.C. Normalization of raised sodium absorption and raised calcium-mediated chloride secretion by adenovirus-mediated expression of cystic fibrosis transmembrane conductance regulator in primary human cystic fibrosis airway epithelial cells. J. Clin. Invest. 1995;95:1377–1382. doi: 10.1172/JCI117789. [DOI] [PMC free article] [PubMed] [Google Scholar]
- Kawano S., Hirayama Y., Hiraoka M. Activation mechanism of Ca2+-sensitive transient outward current in rabbit ventricular myocytes. J. Physiol. 1995;486:593–604. doi: 10.1113/jphysiol.1995.sp020837. [DOI] [PMC free article] [PubMed] [Google Scholar]
- Klöckner U. Intracellular calcium ions activate a low-conductance chloride channel in smooth muscle cells isolated from human mesenteric artery. Pflügers Arch. 1993;424:231–237. doi: 10.1007/BF00384347. [DOI] [PubMed] [Google Scholar]
- Kurahashi T., Yau K.-W. Olfactory transduction. Tale of an unusual chloride current. Curr. Biol. 1994;4:256–258. doi: 10.1016/s0960-9822(00)00058-0. [DOI] [PubMed] [Google Scholar]
- Kuruma A., Hartzell H.C. Dynamics of calcium regulation of Cl currents in Xenopus oocytes. Am. J. Physiol. 1999;276:C161–C175. doi: 10.1152/ajpcell.1999.276.1.C161. [DOI] [PubMed] [Google Scholar]
- Kuruma A., Hiraoka M., Kawano S. Activation of Ca2+-sensitive Cl− current by reverse mode Na+/Ca2+ exchange in rabbit ventricular myocytes. Pflügers Arch. 1998;436:976–983. doi: 10.1007/s004240050732. [DOI] [PubMed] [Google Scholar]
- Large W.A., Wang Q. Characteristics and physiological role of the Ca2+-activated Cl− conductance in smooth muscle. Am. J. Physiol. 1996;271:C435–C454. doi: 10.1152/ajpcell.1996.271.2.C435. [DOI] [PubMed] [Google Scholar]
- Machaca K., Hartzell H.C. Asymmetrical distribution of Ca-activated Cl channels in Xenopus oocytes. Biophys. J. 1998;74:1286–1295. doi: 10.1016/S0006-3495(98)77842-7. [DOI] [PMC free article] [PubMed] [Google Scholar]
- Machaca K., Hartzell H.C. Reversible Ca gradients between the sub-plasmalemma and cytosol differentially activate two distinct Cl channel effectors. J. Gen. Physiol. 1999;113:249–266. doi: 10.1085/jgp.113.2.249. [DOI] [PMC free article] [PubMed] [Google Scholar]
- Martin D.K. Small conductance chloride channels in acinar cells from rat mandibular salivary gland are directly controlled by a G-protein. Biochem. Biophys. Res. Commun. 1993;192:1266–1273. doi: 10.1006/bbrc.1993.1553. [DOI] [PubMed] [Google Scholar]
- Marty A., Tan Y.P., Trautmann A. Three types of calcium-dependent channel in rat lacrimal glands. J. Physiol. 1984;357:293–325. doi: 10.1113/jphysiol.1984.sp015501. [DOI] [PMC free article] [PubMed] [Google Scholar]
- Marunaka Y., Eaton D.C. Effects of insulin and phosphatase on a Ca2+-dependent Cl− channel in a distal nephron cell line (A6) J. Gen. Physiol. 1990;95:773–789. doi: 10.1085/jgp.95.5.773. [DOI] [PMC free article] [PubMed] [Google Scholar]
- Morris A.P. The regulation of epithelial cell cAMP- and calcium-dependent chloride channels. Adv. Pharmacol. 1999;46:209–251. doi: 10.1016/s1054-3589(08)60472-x. [DOI] [PubMed] [Google Scholar]
- Morris A.P., Frizzell R.A. Ca2+-dependent Cl− channels in undifferentiated human colonic cells (HT-29). II. Regulation and rundown. Am. J. Physiol. 1993;264:C977–C985. doi: 10.1152/ajpcell.1993.264.4.C977. [DOI] [PubMed] [Google Scholar]
- Naranjo D., Brehm P. Modal shifts in acetylcholine receptor channel gating confer subunit-dependent desensitization. Science. 1993;260:1811–1814. doi: 10.1126/science.8511590. [DOI] [PubMed] [Google Scholar]
- Neher E. Correction for liquid junction potentials in patch clamp experiments. Methods Enzymol. 1992;207:123–131. doi: 10.1016/0076-6879(92)07008-c. [DOI] [PubMed] [Google Scholar]
- Nelson M.T., Conway M.A., Knot H.J., Brayden J.E. Chloride channel blockers inhibit myogenic tone in rat cerebral arteries. J. Physiol. 1997;502:259–264. doi: 10.1111/j.1469-7793.1997.259bk.x. [DOI] [PMC free article] [PubMed] [Google Scholar]
- Nilius B., Prenen J., Szucs G., Wei L., Tanzi F., Voets T., Droogmans G. Calcium-activated chloride channels in bovine pulmonary artery endothelial cells J. Physiol. 498 1997. 381 396a [DOI] [PMC free article] [PubMed] [Google Scholar]
- Nilius B., Prenen J., Voets T., Van Den Bremt K., Eggermont J., Droogmans G. Kinetic and pharmacological properties of the calcium-activated chloride-current in microvascular endothelial cells Cell Calc. 22 1997. 53 63b [DOI] [PubMed] [Google Scholar]
- Nishimoto I., Wagner J., Schulman H., Gardner P. Regulation of Cl− channels by multifunctional CaM kinase. Neuron. 1991;6:547–555. doi: 10.1016/0896-6273(91)90057-7. [DOI] [PubMed] [Google Scholar]
- Papp Z., Sipido K., Callewaert G., Carmeliet E. Two components of [Ca2+]i-activated Cl− current during large [Ca2+]i transients in single rabbit heart Purkinje cells. J. Physiol. 1995;483:319–330. doi: 10.1113/jphysiol.1995.sp020588. [DOI] [PMC free article] [PubMed] [Google Scholar]
- Schlenker T., Fitz J.G. Ca2+-activated Cl− channels in human biliary cell lineregulation by Ca2+/calmodulin-dependent protein kinase. Am. J. Physiol. 1996;271:G304–G310. doi: 10.1152/ajpgi.1996.271.2.G304. [DOI] [PubMed] [Google Scholar]
- Schumann M.A., Gardner P., Raffin T.A. Recombinant human tumor necrosis factor alpha induces calcium oscillation and calcium-activated chloride current in human neutrophils. The role of calcium/calmodulin-dependent protein kinase. J. Biol. Chem. 1993;268:2134–2140. [PubMed] [Google Scholar]
- Takahashi T., Neher E., Sakmann B. Rat brain serotonin receptors in Xenopus oocytes are coupled by intracellular calcium to endogenous channels. Proc. Natl. Acad. Sci. USA. 1987;84:5063–5067. doi: 10.1073/pnas.84.14.5063. [DOI] [PMC free article] [PubMed] [Google Scholar]
- Taleb O., Feltz P., Bossu J.-L., Feltz A. Small-conductance chloride channels activated by calcium on cultured endocrine cells from mammalian pars intermedia. Pflügers Arch. 1988;412:641–646. doi: 10.1007/BF00583766. [DOI] [PubMed] [Google Scholar]
- Taleb O., Trouslard J., Demeneix B.A., Feltz P., Bossu J.-L., Dupont J.-L., Feltz A. Spontaneous and GABA-evoked chloride channels on pituitary intermediate lobe cells and their internal Ca requirements. Pflügers Arch. 1987;409:620–631. doi: 10.1007/BF00584663. [DOI] [PubMed] [Google Scholar]
- Tohda M., Nakamura J., Hidaka H., Nomura Y. Inhibitory effects of KN-62, a specific inhibitor of Ca/calmodulin-dependent protein kinase II, on serotonin-evoked C1-current and 36-C1-efflux in Xenopus oocytes. Neurosci. Lett. 1991;129:47–50. doi: 10.1016/0304-3940(91)90717-8. [DOI] [PubMed] [Google Scholar]
- Tsien R.Y., Pozzan T. Measurements of cytosolic free Ca2+ with Quin-2. Methods Enzymol. 1989;172:230–262. doi: 10.1016/s0076-6879(89)72017-6. [DOI] [PubMed] [Google Scholar]
- VanRenterghem C., Lazdunski M. Endothelin and vasopressin activate low conductance chloride channels in aortic smooth muscle. Pflügers Arch. 1993;425:156–163. doi: 10.1007/BF00374516. [DOI] [PubMed] [Google Scholar]
- Wagner J.A., Cozens A.L., Schulman H., Gruenert D.C., Stryer L., Gardner P. Activation of chloride channels in normal and cystic fibrosis airway epithelial cells by multifunctional calcium/calmodulin-dependent protein kinase. Nature. 1991;349:793–796. doi: 10.1038/349793a0. [DOI] [PubMed] [Google Scholar]
- Wang Y.X., Kotlikoff M.I. Inactivation of calcium-activated chloride channels in smooth muscle by calcium/calmodulin-dependent protein kinase. Proc. Natl. Acad. Sci. USA. 1997;94:14918–14923. doi: 10.1073/pnas.94.26.14918. [DOI] [PMC free article] [PubMed] [Google Scholar]
- Wang Z., Fermini B., Feng J., Nattel S. Role of chloride currents in repolarizing rabbit atrial myocytes. Am. J. Physiol. 1995;268:H1992–H2002. doi: 10.1152/ajpheart.1995.268.5.H1992. [DOI] [PubMed] [Google Scholar]
- Webb D., Nuccitelli R. Fertilization potential and electrical properties of the Xenopus laevis egg. Dev. Biol. 1985;107:395–406. doi: 10.1016/0012-1606(85)90321-5. [DOI] [PubMed] [Google Scholar]
- Worrell R.T., Frizzell R.A. CaMKII mediates stimulation of chloride conductance by calcium in T84 cells. Am. J. Physiol. 1991;260:C877–C882. doi: 10.1152/ajpcell.1991.260.4.C877. [DOI] [PubMed] [Google Scholar]
- Wright E.M., Diamond J.M. Anion selectivity in biological systems. Physiol. Rev. 1977;57:109–156. doi: 10.1152/physrev.1977.57.1.109. [DOI] [PubMed] [Google Scholar]
- Xie W., Kaetzel M.A., Bruzik K.S., Dedman J.R., Shears S.B., Nelson D.J. Inositol 3,4,5,6-tetrakisphosphate inhibits the calmodulin-dependent protein kinase II-activated chloride conductance in T84 colonic epithelial cells. J. Biol. Chem. 1996;271:14092–14097. doi: 10.1074/jbc.271.24.14092. [DOI] [PubMed] [Google Scholar]
- Yao Y., Parker I. Inositol trisphosphate–mediated Ca2+ influx into Xenopus oocytes triggers Ca2+ liberation from intracellular stores. J. Physiol. 1993;468:275–296. doi: 10.1113/jphysiol.1993.sp019771. [DOI] [PMC free article] [PubMed] [Google Scholar]
- Yeramian E., Claverie P. Analysis of multi-exponential functions without a hypothesis as to the number of components. Nature. 1987;326:169–174. [Google Scholar]
- Yuan X.J. Role of calcium-activated chloride current in regulating pulmonary vasomotor tone. Am. J. Physiol. 1997;272:L959–L968. doi: 10.1152/ajplung.1997.272.5.L959. [DOI] [PubMed] [Google Scholar]
- Zygmunt A., Gibbons W.R. Properties of the calcium-activated chloride current in heart. J. Gen. Physiol. 1992;99:391–414. doi: 10.1085/jgp.99.3.391. [DOI] [PMC free article] [PubMed] [Google Scholar]
- Zygmunt A.C. Intracellular calcium activates a chloride current in canine ventricular myocytes. Am. J. Physiol. 1994;267:H1984–H1995. doi: 10.1152/ajpheart.1994.267.5.H1984. [DOI] [PubMed] [Google Scholar]
- Zygmunt A.C., Gibbons W.R. Calcium-activated chloride current in rabbit ventricular myocytes. Circ. Res. 1991;68:424–437. doi: 10.1161/01.res.68.2.424. [DOI] [PubMed] [Google Scholar]
- Zygmunt A.C., Goodrow R.J., Weigel C.M. INaCa and ICl(Ca) contribute to isoproterenol-induced afterhyperpolarizations in midmyocardial cells. Am. J. Physiol. 1998;275:H1979–H1992. doi: 10.1152/ajpheart.1998.275.6.H1979. [DOI] [PubMed] [Google Scholar]