


Abstract
Hybridization of nucleic acids with secondary structure is involved in many biological processes and technological applications. To gain more insight into its mechanism, we have investigated the kinetics of DNA hybridization/denaturation via fluorescence resonance energy transfer (FRET) on perfectly matched and single-base-mismatched DNA strands. DNA hybridization shows non-Arrhenius behavior. At high temperature, the apparent activation energies of DNA hybridization are negative and independent of secondary structure. In contrast, when temperature decreases, the apparent activation energies of DNA hybridization change to positive and become structure dependent. The large unfavorable enthalpy of secondary structure melting is compensated for by concomitant duplex formation. Based on our results, we propose a reaction mechanism about how the melting of secondary structure influences the hybridization process. A significant point in the mechanism is that the rate-limiting step switches along with temperature variation in the hybridization process of structured DNA, because the free energy profile of hybridization in structured DNA varies with the variation in temperature.
INTRODUCTION
A nucleic acid strand recognizes its complementary strand according to the Watson–Crick rules for base pairing. The kinetic and thermodynamic properties of short oligonucleotides (1–4) and long DNAs (5) have been investigated in solution via UV absorbance hyperchromicity. The results indicate that, for duplex formation of oligonucleotides, the rate-limiting step is the formation of a transient intermediate with a few base pairs called nucleus, and then the rest of the bases form fully bound helix quickly (3). However, this simple model is only applicable to duplex formation from random-coil strands.
Already, many researchers (6–12) have focused on how secondary structure influences the thermodynamic stability and kinetic properties of double-stranded nucleic acids. A secondary structure forms when a single strand has two or more stretches of complementary sequences (we call it structured nucleic acid in this article). Among various secondary structures, hairpin is common and usually serves as a model for the study of structured nucleic acid. In recent years, hairpin probes have been widely used in DNA detection (13) and DNA microarray (14), because they are more specific in discriminating of single-base-mismatch (SM) strands from perfectly matched (PM) strands than random-coil DNA probes. In our previous work, we found that the specificity of hairpin probes is greatly enhanced when the probes are coupled with an electric field on silicon surface (15,16). Bonnet and co-workers (17,18) have given a quantitative analysis on the origin of the specific recognition of structured DNA. The effect of secondary structure on thermodynamics (6,8,9) and kinetics (7,9,10) of nucleic acid duplex has also been investigated, and some principles have been laid on how the secondary structure influences the hybridization process. However, to our knowledge, few models on the hybridization of structured strands have been proposed, and it is not very clear how a hairpin structure participates in the hybridization process. Systematic investigation on the influence of secondary structure on the kinetics of hybridization/denaturation is highly desired and beneficial.
Fluorescence resonance energy transfer (FRET) (19,20) is a powerful tool to monitor the conformational changes of biological molecules, such as proteins (21–23) and nucleic acids (24–28), in real time. FRET has the advantage of high sensitivity on monitoring conformational changes as its signal is inversely proportional to the sixth power of the distance between two dyes (19). Furthermore, the high signal sensitivity of fluorescence is helpful in the rate measurement on DNA hybridization (29). The molecular beacon (13) and FRET techniques have been used for studying the kinetics of hairpin opening/closing (24–26). FRET has also been applied to study DNA hybridization in solution (29), on microsphere (30) and on solid surface (31).
In this article, we have studied the effect of secondary structure on the kinetics and reaction mechanism of DNA hybridization by FRET technique using 5′-Atto-532-labeled DNA as a donor and 3′-Dabcyl-labeled DNA as a non-fluorescent quencher. Hybridization of DNA brings the quencher into close proximity with the fluorophore for efficient fluorescence quenching, while dissociation of DNA separates two moieties and the fluorescent signal is restored. By monitoring the fluorescent signals, we measured the thermodynamic melting curves and kinetic reaction curves of structured and random-coil DNAs with their PM and SM strands. At high temperature, both hairpin and random-coil DNAs had similar negative hybridization activation energies. However, at low temperature, the structured DNA had much higher hybridization activation energies than the random-coil ones. Our results were consistent with an intuitive scenario that it might not be necessary to fully open a hairpin for initiating the formation of a duplex. We proposed a model for the hybridization of structured DNA, in which the rate-limiting step switches with temperature variation. The entropy-controlled barrier of nucleation dominates at high temperature, while the enthalpy-controlled barrier of melting of secondary structure dominates at low temperature.
MATERIALS AND METHODS
Oligodeoxynucleic acid sequences and chemicals
All oligonucleotide strands were designed by ourselves and used as received. Thermodynamic prediction for the hairpin design and oligonucleotide hybridization was supported via Mfold software by Zuker (32) and HytherTM software from Santalucia's Laboratory (33). Table 1 lists all the DNA sequences used in this work. We took a random-coil strand (L0) and a six-stem hairpin strand (H6) with their PM (TP) and SM (TS) DNAs. For FRET detection, four strands were labeled with 3′-Atto-532 (L0A and H6A) or 5′-Dabcyl (TPD and TSD). Finally, a non-hairpin strand (L6), which had the same length and the same complementary sequence as H6 was chosen for comparison. L0A and H6A were purchased from ATTOTEC, Germany. The other DNAs were purchased from Sangon Company, China.
Table 1.
DNA sequences used in this article
| Index | Typea | Sequence | Modification |
|---|---|---|---|
| L0 | Probe | 5′-gtt tca gta tga cag ctg cgg-3′ | None |
| H6 | Probe | 5′-ccg cag tag tta gtt tca gta tga cag ctg cgg-3′ | None |
| L6 | Probe | 5′-ggc gtc tag tta gtt tca gta tga cag ctg cgg-3′ | None |
| TP | Target | 3′-caa agt cat act gtc gac gcc-5′ | None |
| TS | Target | 3′-caa agt cat aat gtc gac gcc-5′ | None |
| L0A | Probe | 5′-gtt tca gta tga cag ctg cgg-3′ | 3′-Atto-532 |
| H6A | Probe | 5′-ccg cag tag tta gtt tca gta tga cag ctg cgg-3′ | 3′-Atto-532 |
| TPD | Target | 3′-caa agt cat act gtc gac gcc-5′ | 5′-Dabcyl |
| TSD | Target | 3′-caa agt cat aat gtc gac gcc-5′ | 5′-Dabcyl |
The bold-faced letters stand for bases that form duplex, the underlined letters stand for bases that form intramolecular base pairs in hairpin structure and the bold italic letters stand for mismatch positions.
aDuplex can form between any probe strands and any target strands.
The secondary structure affects both thermo-stability of the species and kinetic profile of the reaction. We designed the DNA sequences carefully to isolate the influence of secondary structure on kinetics from the thermo-stability. While the hairpin structure decreases the thermo-stability of double-stranded DNA (dsDNA) (17,18), the 12 more bases in H6 series as compared to L0 serve as an overhang in the duplex, which increases the thermo-stability of dsDNA (34,35) and compensates for the influence of hairpin structure. We found approximately the same thermo-stability of duplexes composed of structured (H6 series) and random-coil (L0 series) single-stranded DNAs (ssDNAs), so that the influence of secondary structure on kinetics can be examined on isolated condition.
The buffer solution used in this work was TE (1×). The buffer solution TE (20×) was purchased from Molecular Probe and diluted with water. The composition of TE (20×) is 200 mM Tris-HCl and 20 mM EDTA, with pH 7.5. Water (18.2 MΩ · cm) was treated through PALL.
UV absorbance measurement
UV absorbance spectra were recorded using JASCO-810 Spectropolarimeter (JASCO Corporation, Japan). Equal molar complementary strands were pre-hybridized at a temperature well below the melting temperature (Tm) overnight to form stable dsDNAs. Absorbance hyperchromicity melting curves were recorded by monitoring absorbance at 260 nm in solution. Melting curves were recorded from a temperature well below Tm to a temperature well above Tm at a linear heating rate of 20°C/h.
Fluorescence measurement
Fluorescence signal was measured on a microscopic spectrometer (Renishaw 1000, Britain) with a temperature controller THMS 600 (Linkam Scientific Instruments Ltd, Britain). Atto-532 was excited at 514 nm, and the fluorescence emission spectra of Atto-532 were collected from 542 to 568 nm. The signal was defined as the integrated area of the fluorescent spectral curve.
Pre-hybridization was carried out to form stable dsDNA from equal molar complementary strands as in the absorbance measurement. Melting curves were recorded by increasing the temperature from well below Tm to well above Tm at a linear heating rate of 20°C/h.
DNA hybridization and dissociation rates were measured via three methods. Method 1: At a temperature well below Tm, Atto-labeled DNA and complementary Dabcyl-labeled DNA solutions were quickly mixed up, then DNA hybridization rate was measured through the variation of fluorescence signal with increasing time. Method 2: Pre-hybridized DNA duplex solution was quickly heated from a low temperature to a temperature near Tm. Both DNA hybridization and dissociation rates were obtained from fluorescence relaxation time with different concentrations of Dabcyl-labeled DNA. Method 3: DNA dissociation rate was detected by the label dilution technique developed by Morrison and Stols (29). Excess non-labeled DNA complementary to Dabcyl-labeled DNA was mixed up with pre-hybridized DNA solution before jumping temperature. The concentration of Atto-labeled DNA was 5 nM in Methods 1, 2 and 3. The concentrations of Dabcyl-labeled DNA were 250 nM in Method 1, 5 nM in Method 3, 100 nM, 400 nM, 700 nM and 1 μM in Method 2. The concentration of non-labeled DNA was 500 nM in Method 3.
Analysis of melting curve
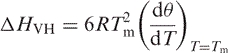
By assuming a two-state model for DNA hybridization and that the thermodynamic parameters Δ HVH and Δ S ° are temperature independent, Marky and Breslauer (36) have deduced the van't Hoff expression
 |
1 |
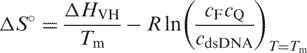
where Δ HVH is the van't Hoff enthalpy of DNA hybridization, R is the ideal gas constant and θ is the fraction of the remaining duplex. Then the entropy (Δ S °) and the free energy at temperature T ( ) of DNA hybridization can be calculated from
 |
2 |
| 3 |
where cF, cQ and cdsDNA are concentrations of Atto-labeled DNA, Dabcyl-labeled DNA and dsDNA, respectively.
Analysis of kinetic data
Dissociation rate constant (kd) of dsDNA and hybridization rate constant (kh) of two ssDNAs are associated with the reaction
| 4 |
We set the concentration of Dabcyl-labeled DNA to be in excess over the concentration of Atto-labeled DNA (at least 20 times larger), so that the DNA hybridization, which we have proved to be a second-order reaction, could be regarded as a quasi-first-order reaction. Then the relaxation time τ is expressed as
| 5 |
For Method 1, at low temperature, the dissociation rate can be ignored and Equation (5) becomes
| 6 |
When temperature approaches Tm, the dissociation rate increases and Equation (6) is no longer suitable. Then Method 2 is applied. Values of kd and kh are extracted from the concentration dependence of 1/τ in Equation (5). The plot of 1/τ against the concentration of Dabcyl-labeled DNA yields kh from the slope and kd from the Y-intercept.
In Method 3, by using the label dilution technique, only the dissociation rate is detectable (29), and the relaxation time τ is expressed as
| 7 |
Apparent activation energies of hybridization (Eah) and dissociation (Ead) are determined according to the Arrhenius equation
| 8 |
by a linear fit of ln(kh) or ln(kd) versus 1/RT in a suitable temperature range.
Simulation of hybridization energy profiles using nearest neighbor parameters
The nearest neighbor model has been used to predict thermodynamic parameters of duplex (33,37,38) and energy profiles of helix formation (39), approximately. By assuming a DNA hybridization pathway involving formation of n base pairs between two single strands, the intermediate values for  ,
,  and
and  were predicted with nearest neighbor parameters (33) (at a condition of 10 mM Na+). Then, the enthalpy and free energy profiles of DNA hybridization were drawn by plotting and against n. For structured DNA, the contribution of hairpin melting in and was predicted using the Mfold program (32). To address major features, the small humps between intermediates (40) were neglected in the simulated profiles.
RESULTS
dsDNA melting curves and thermodynamics of DNA hybridization
Melting curves of non-labeled dsDNA were recorded by absorbance method at a duplex concentration of 2 μM, while melting curves of dye-labeled dsDNA were recorded by both absorbance and fluorescence methods at a duplex concentration of 1 μM. Typical melting curves are shown in Figure 1, and all thermodynamic parameters fitted from melting curves and predicted from software (33) are listed in Table 2. All the melting curves were corrected for sloping baselines as in Marky and Breslauer's article (36). We checked the reversibility and the reliability of the measurements. The cooling curve overlapped with the melting curve, which showed that the dissociation and hybridization processes were reversible under our experimental condition (Supporting Information). The thermodynamic parameters fitted from the single melting curve through Equations (1) and (2) were in agreement with more laborious measurements of Tm variation upon concentration variation (Supporting Information).
Figure 1.

Typical extent-of-melting curves of L0/TP and H6/TP via absorbance method, and L0A/TPD and H6A/TPD via fluorescence method.
Table 2.
Thermodynamic values predicted from nearest neighbor parameters (33) and determined from absorbance- and fluorescence-based melting curves in TE buffer
| Oligomera | Detection methodb | ΔHVH (kcal mol−1) | ΔS° (cal mol−1 K−1) | Tm (°C) |
 (kcal mol−1) (kcal mol−1) |
|---|---|---|---|---|---|
| L0/TP | pred | −167.2 | −487.4 | 51.7 | −21.9 |
| abs | −169 | −494 | 50.9 | −22 | |
| L0A/TPD | abs | −150 | −432 | 52.3 | −21 |
| flu | −155 | −451 | 50.2 | −21 | |
| L0/TS | pred | −146.9 | −434.5 | 44.9 | −17.4 |
| abs | −146 | −434 | 43.2 | −17 | |
| L0A/TSD | abs | −123 | −358 | 44.7 | −16 |
| flu | −141 | −416 | 44.0 | −17 | |
| L6/TP | abs | −192 | −561 | 53.0 | −25 |
| L6/TS | abs | −172 | −512 | 45.6 | −19 |
| H6/TP | abs | −158 | −461 | 50.4 | −21 |
| H6A/TPD | abs | −141 | −406 | 51.1 | −20 |
| flu | −157 | −457 | 50.1 | −21 | |
| H6/TS | abs | −118 | −347 | 42.2 | −15 |
| H6A/TSD | abs | −123 | −360 | 43.6 | −15 |
| flu | −134 | −394 | 43.8 | −17 |
Standard errors for experimental ΔHVH, ΔS°, Tm and were 5%, 10%, 0.38C and 10%, respectively.
aConcentrations of non-labeled and labeled dsDNA were 2 and 1 μM, respectively.
bpred, predicted by the method of nearest neighbor parameters at  = 10 mM; abs, absorbance; flu, fluorescence.
Some observations can be made from the results. First, the thermodynamic parameters of non-labeled DNA are consistent with those of prediction using software. Second, the duplexes of L6 with overhang bases are more stable than the duplexes of L0. The thermo-stability of H6 series is approximately the same as the thermo-stability of L0 series, which is in agreement with our design. Also, H6A series have the same stability as L0A series. Finally, our results indicated that labeling of Atto-532 at the 3′ end of one strand and Dabcyl at the 5′ end of the complementary strand reduces the enthalpy of duplex dissociation and increases the thermo-stability (reflected through Tm) of duplex by 1.4 ± 0.4°C. This phenomenon is consistent with previous studies (29,41). Generally speaking, the effect of dye labeling on stability of dsDNA is not substantial. We assumed that dye labeling also has minor effect on kinetics of DNA hybridization/denaturation.
Kinetic data of DNA dissociation and hybridization
Some typical kinetic data are presented in Figure 2. In most cases, the data were well fitted by single exponential curve. However, when the temperature was too low, the kinetic data deviated from single exponential curve but could be fitted by double exponential one. The source of deviation at low temperature was not clear. It could be due to the formation of some intermediate configurations. We chose the temperature ranges in which all the kinetic data were in accordance with single exponential curves. Care was taken at the high-temperature end so that the rate measurement was reliable within the time resolution of the apparatus. We checked the reaction orders of the oligonucleotide hybridization and dissociation under our condition. Consistent with previous studies (5,29,42), our results verified that hybridization is a second-order reaction and dissociation is a first-order reaction (Supporting Information).
Figure 2.

Typical kinetic curves of L0A/TPD in different experimental methods. Dots are experimental results and lines are fits with first-order reaction equation.
In the region around Tm, Methods 2 and 3 were applicable. The dissociation rate constants measured from the two methods were plotted in Figure 3 and they agree well with each other on kd. The large relative error in Method 2 comes from the fact that the value of absolute error in Y-intercept remains almost constant while the value of Y-intercept (kd) goes down quickly. In the temperature range we studied, kd exhibits Arrhenius behaviors. Ead is ∼140 kcal/mol for dissociation of PM duplex, while it is ∼120 kcal/mol for dissociation of SM duplex (Table 3), no matter whether ssDNA has a secondary structure or not.
Figure 3.

Arrhenius plots for dissociation rate constant of L0A/TPD and H6A/TPD determined from Methods 2 and 3.
Table 3.
Apparent activation energies determined from different methods at respective temperature ranges
| Method 1 | Method 2 | Method 3 | ||
|---|---|---|---|---|
| Duplex | Eah (kcal mol−1)a | Eah (kcal mol−1)b | Ead (kcal mol−1)c | Ead (kcal mol−1)d |
| L0A/TPD | 9.2 ± 0.8 | −19 ± 6 | 140 ± 6 | 138 ± 4 |
| L0A/TSD | 9.3 ± 0.7 | −16 ± 3 | 117 ± 7 | 116 ± 4 |
| H6A/TPD | 23.7 ± 1.0 | −6 ± 4 | 139 ± 2 | 151 ± 6 |
| H6A/TSD | 47.4 ± 2.3 | −14 ± 3 | 126 ± 3 | 124 ± 4 |
aThe fitting temperature ranges were 28–42°C for L0A/TPD, 26–37°C for L0A/TSD, 26–43°C for H6A/TPD and 32–41°C for H6A/TSD. bThe fitting temperature ranges were 45–52°C for L0A/TPD, 39–45°C for L0A/TSD, 45–51°C for H6A/TPD and 41–45°C for H6A/TSD. cThe fitting temperature ranges were 48–53°C for L0A/TPD, 40–45°C for L0A/TSD, 48–53°C for H6A/TPD and 40–45°C for H6A/TSD. dThe fitting temperature ranges were 46–53°C for L0A/TPD, 40–47°C for L0A/TSD, 47–55°C for H6A/TPD and 39–47°C for H6A/TSD.
Hybridization rates were measured with Methods 1 and 2. Method 2 was only suitable for temperatures around Tm, while Method 1 was applied from temperature below Tm to room temperature. When the temperature was close to Tm, kd contributed a great deal to 1/τ in Method 1, and subtraction of kd was made by using the values obtained from Method 2. Although Methods 1 and 2 were mostly applied in different temperature ranges, they overlapped slightly, which allowed us to check the consistency (Figure 4). We found that when temperature decreased from Tm to room temperature, the apparent activation energies of hybridization (Eah) (Table 3) changed from negative to positive, and hybridization rate constant showed a non-Arrhenius behavior (Figure 4). It was observed that at high temperature, values of Eah were similar and satisfied the equation
| 9 |
for all four duplexes. At low temperature, Eah of structured DNAs were higher than those of random-coil DNAs. Furthermore, Eah of SM DNA was higher than that of PM DNA for structured strands, while for random-coil strands, Eah of SM DNA and PM DNA were approximately the same.
Figure 4.

Arrhenius plots of hybridization rate constant determined from Methods 1 and 2 for L0A/TPD, L0A/TSD, H6A/TPD and H6A/TSD.
DISCUSSION
General features
In our study, the hybridization rate constant exhibited non-Arrhenius behavior and the apparent activation energies of hybridization changed from negative at high temperature to positive at low temperature. Porschke and co-workers (3,4) reported negative hybridization activation energies (∼−15 kcal/mol) for simple An–Tn duplex and positive hybridization activation energies (∼10 kcal/mol) for duplex containing GC base pairs by UV method at temperatures around Tm. Morrison and Stols (29) also reported positive hybridization activation energies for 10 mer (9.94 kcal/mol) and 20 mer (16.4 kcal/mol) by FRET method at temperatures well below Tm. Our results are in overall agreement with the above observations. Porschke and co-workers (3,4) proposed that at low temperature, diffusion-controlled nucleation process is the origin of positive Eah. This could also be applied to our random-coil DNA. At high temperature, the negative apparent hybridization activation energy is compatible with the model that nucleation is the rate-limiting step (3,43). As temperature decreases, the rate-limiting step switches to diffusion-controlled process, so that the apparent activation energies of hybridization become positive as in Porschke's work. According to standard chemical kinetic theory (44), a negative apparent activation energy is an indication of the existence of a metastable intermediate in the rate-limiting step and of a barrier between this metastable intermediate and the product. Based on the previous theory of DNA hybridization and our observation of the negative apparent activation energy, the barrier at high temperature is due to nucleation.
Similar negative activation energies at high temperature among PM, SM, random coil and structured strands suggest that they should all go through the nucleation process. A nucleus usually contains a few base pairs. Nucleation may occur at different sites (1) and prefers to begin from GC base pairs (4,5). Chu and Tinoco suggested that mismatch bases, bulge bases and bases next to them do not take part in the nucleation (7). Obviously, the stem bases in hairpin cannot participate in nucleus formation. Except for these restricted bases, other ‘free’ bases may form nucleus when the length of continuous ‘free’ bases is long enough. The more the number of appropriate base-pair combinations, the faster the nucleation is. The drop of the fastest hybridization rate of SM strands from that of PM could be due to the reduction in the number of nucleation sites caused by the interruption of mismatched position. On the same bases, the fastest hybridization rate of structured strands is smaller than that of random-coil strands.
Influence of secondary structure on DNA hybridization
In our study, the Tm (50.6°C) of structured DNA (H6/H6A) was higher than most temperatures at which we carried out kinetic rate measurements, which means that H6/H6A kept their secondary structures when they were involved in hybridization process at those temperatures. Thus, the low value of Eah of structured PM DNA (23.7 kcal/mol) compared with the energy necessary to melt the hairpin (49.2 kcal/mol) at low temperature suggests that a partial duplex is formed before the melting of the hairpin structure, so that the large unfavorable enthalpy of hairpin melting is compensated by the energy of concomitant partial duplex formation (6).
At high temperature, both structured DNA and random-coil DNA have negative Eah, and the difference between them is rather small compared with the additional melting energy of the hairpin stem. This indicates that the major source of the difference is not hairpin melting, and the melting of secondary structure should occur after the rate-limiting step. In contrast, the difference between kinetics of structured and random-coil oligonucleotides shows up at low temperature. Not only structured and random-coil duplexes have different Eah, but also PM- and SM-structured dsDNAs have different Eahs. The higher Eah of structured DNA at low temperature implies that the dissociation of the stem, which is an energy consuming process, is involved in the rate-limiting step, and this fact has to be incorporated into our kinetic models. Furthermore, the difference of Eah between structured H6A/TPD and H6A/TSD dsDNAs is almost the same as the difference between respective enthalpies of formation (ΔH°), which equals the enthalpy change induced by mismatch base. This phenomenon suggests that, at low temperature, the mismatch position in TSD is involved in the rate-limiting step of hybridization for structured DNA. Additional experiment on a different SM strand shows that the kinetics of oligonucleotide hybridization/dissociation is very sensitive to the mismatch position in the case of structured DNA with mismatch (Supporting Information).
Effect of temperature on reaction mechanism
According to the transition state theory (44), the reaction rate is controlled by the activation free energy (ΔG≠) through
| 10 |
where k0 is a constant. ΔG≠, in turn, is determined by the activation enthalpy (ΔH≠) and activation entropy (ΔS≠) through ΔG≠ = ΔH≠ − TΔS≠, where ΔH≠ and ΔS≠ are approximately constant. Although people normally use potential barrier, activation energy or activation enthalpy to identify the rate-limiting step, the true rate-limiting step should be the one with the slowest reaction rate, which is determined by the activation free energy as illustrated in Equation (10). According to Equation (10), the rate-limiting step should have the highest ΔG≠. Only when the contribution of ΔS≠ is not important, one may use the largest ΔH≠ to identify the rate-limiting step. Therefore, the analysis on the free energy profile will be helpful to understand the mechanism of reaction.
Let us first focus on the random-coil DNA. As discussed before, the hybridization of random-coil DNA is controlled by nucleation at high temperature and becomes a diffusion-controlled process at low temperature. According to this model, the schematic potential profile and different profiles of activation free energy at high and low temperatures can be drawn as in Figure 5a and b.
Figure 5.

Schematic view on the profiles of potential energy (solid line), and free energy at high temperature (dotted line) and at low temperature (dashed line) versus an effective reaction coordinate for hybridization of random-coil DNA (a and b) and structured DNA (c and d).
For the structured DNA, we propose the following schematic picture for the potential profile (Figure 5c) and free energy profiles (Figure 5d) for the reaction. Similar to random-coil DNA, nucleus is firstly formed. After overcoming the barrier of nucleation, more base pairs are formed. However, different from random-coil DNA, in order to go further, the hairpin structure has to be destructed which creates the second reaction barrier, otherwise the extension of the more rigid dsDNA configuration is not possible. After crossing over the second barrier, the full length of duplex forms quickly. Whether the character of the stem-loop structure contributes to the apparent activation energy depends on which of the two barriers is involved in the rate-limiting step. At low temperature, the free energy profile is mainly controlled by the potential energy, so that the rate-limiting step is hairpin opening. Melting of hairpin structure is an entropy-increasing process, which leads to reduction of the second free energy barrier when temperature increases. In contrast, nucleation is an entropy-reducing process, so that the first free energy barrier increases as temperature increases. At some point, the height of the first peak in free energy profile becomes larger than the second one (Figure 5d), and then according to Equation (10) the rate-limiting step switches from the melting of hairpin to the nucleation. As a result, the kinetic characters of structured and random-coil dsDNAs become identical at high temperature, exhibiting negative apparent activation energies.
Nucleation model for random-coil DNA
The number of base pairs formed in the nucleation process can be estimated using the nucleation model (43). In this model
| 11 |
where Eah is the apparent activation energy of random-coil DNA hybridization,  is the enthalpy of first base-pair formation between two free ssDNAs,
  is the mean enthalpy of one base-pair formation except for the first one, Eh is the association activation energy of one pair formation and nN is the number of base pairs formed in the nucleation process. Because destruction of hydrogen bonds between bases and water compensates the energy from forming hydrogen bonds between base pairs, should be very small without stacking energy (43). Eh is positive as it is for an elementary reaction and should not be very large (43). is known to be on the order of −6 to −10 kcal/mol depending on the conditions (33,45). Plugging in our experimental Eah, nN is found to be ∼3–4. Our results via FRET method are similar to previous reports via absorbance method (3,43).
Concerted model for structured DNA
Inspired by the nucleation model, we extend Equation (11) to handle the structured DNA and to determine how and when the hairpin structure opens. The energy of the intermediate during hairpin opening can be expressed as
| 12 |
where nC is the number of base pairs formed between two single strands in this intermediate, ns is number of stem base pairs in the intermediate and  is the mean enthalpy of one base-pair formation in the hairpin. The meaning of other symbols is the same as those in Equation (11). The maximum value of
  is −49.2 kcal/mol according to the Mfold program (32). Eah is 23.7 kcal/mol for PM-structured strand. By using the same parameters as in the previous section to fit our experimental Eah, the value nC ≤ 5–6 is obtained. On the other hand, the difference between hybridization activation energies of PM and SM strands at low temperature implies that the mismatched base-pair is involved in the step of hairpin opening, but the mismatch point cannot participate in the nucleation process, which has 3–4 bp. Therefore, one or two more base pairs are needed to form in order to extend the duplex to the mismatch position. In other words, the concerted opening of hairpin occurs when ∼5–6 bp are formed, which include the mismatch position.
Simulation with nearest neighbor parameters
Our models are tested by calculating the enthalpy and free energy profiles during the course of hybridization with the nearest neighbor parameters (32,33), which is described in the Materials and methods section. A representative simulation is presented below by assuming that base pairs form one by one and the first 10 bp form in the order of g15-t14-a13-t12-g11-a10-c9-a8-g7-a16. Symbol xN stands for the base that is at the Nth position counted from the 3′ end of L0 or H6 and whose component is x (=a, g, c or t). With assumed pathways, typical energy profiles are computed with the nearest neighbor parameters, which are shown in Figure 6. The potential energy and free energy profiles for the random-coil DNA behave quite normally, as predicted (Figure 6a). In the hybridization of structured DNA, correct activation energy is reproduced only by assuming that hairpin concertedly opens after the formation of the sixth base pair a10 and before the formation of the seventh base pair c9 (Figure 6b). The simulation only considers one by one base-pair formation and is a simple and rough estimation. Nevertheless, the simulated results support our reaction mechanism quite well. There are many other possible pathways for base-pair formation. We tested some of them, and they all delivered similar energy profiles. Especially, the agreement with the experimental activation energies in structured DNA for both SM and PM sequences was reached when assuming that concerted hairpin opening occurred at the sixth base-pair formation and the most probable first six base pairs were g15t14a13t12g11a10. The simulation on free energy profiles also confirms our assumption shown in Figure 5d. First, the bulging of free energy reaction curve at the ∼3–4 bp position increases with the increase of temperature, which results from the entropy penalty of nucleation. Second, the free energy barrier of hairpin opening slightly drops with the increase of temperature, because of entropy release. Third, the opening of hairpin has to be concerted in order to reproduce experimental results. Fourth, the free energy barrier of nucleation is higher than that of hairpin opening at high temperature, while it is lower than that of hairpin opening at low temperature. Indeed, the rate-limiting step switches along with the variation of temperature in the structured DNAs.
Figure 6.

Simulated enthalpy and free energy profiles according to (a) the nucleation model for L0A/TPD and (b) the concerted model for H6A/TPD with the nearest neighbor parameters (10 mM Na+ concentration). The number in abscissa is the number of base pairs that have already been formed between complementary double strands, and hairpin structure opens in a concerted manner between 6 and 7 bp in H6A/TPD.
As a complicated reaction, DNA dissociation and hybridization are influenced by many factors, such as secondary structure, temperature, salt concentration and microenvironment of DNA molecule. The more details we know about these processes, such as those in PCR, DNA microarray, gene replication, transcription and regulation, the more controllable they are. Inspired by our investigation, more questions can be raised. For instance, our results show that the structured DNA is more sensitive to the discrimination of mismatch than random-coil DNA, and strands with different mismatch positions behave very differently in hybridization/dissociation. This phenomenon suggests that structured strand may be a useful tool to learn about hybridization by using different mismatch strands or to make high specific recognition of DNA sequences. How does the mismatch position take part in the intermediate of hybridization process for structured DNA? We wish to address these issues in our future investigation.
CONCLUSION
In this study, we have examined the effect of secondary structure on kinetics and reaction mechanism of oligonucleotide hybridization via FRET method. For the structured DNA, high unfavorable energy of hairpin melting is compensated by the favorable energy of partial duplex formation. The change of apparent hybridization activation energy may be due to the switch of rate-limiting step at different temperatures. Furthermore, we proposed a model for hybridization of structured DNA, in which melting of the hairpin structure is concerted. At high temperature, the rate-limiting step is controlled by entropy of nucleation, whereas at low temperature, the rate-limiting step is dominated by enthalpy of melting of secondary structure.
Supplementary Material
ACKNOWLEDEGEMENTS
This research was supported by National Key Basic Research Support Foundation of China (NKBRSF) (2006CB910304) and National Natural Science Foundation of China (NSFC) (20333010, 20403001, 20673002). Permission to use Mfold from Dr Michael Zuker and HytherTM from Dr Santalucia is highly appreciated. We also wish to thank the referees for many valuable comments and suggestions. Funding to pay the Open Access publication charges was provided by NSFC.
Conflict of interest statement. None declared.
REFERENCES
- 1.Craig ME, Crothers DM, Doty P. Relaxation kinetics of dimer formation by self complementary oligonucleotides. J. Mol. Biol. 1971;62:383–401. doi: 10.1016/0022-2836(71)90434-7. [DOI] [PubMed] [Google Scholar]
- 2.Eigen M, Porschke D. Co-operative non-enzymic base recognition 1. Thermodynamics of the helix-coil transition of oligoriboadenylic acids at acidic pH. J. Mol. Biol. 1970;53:123–141. doi: 10.1016/0022-2836(70)90049-5. [DOI] [PubMed] [Google Scholar]
- 3.Porschke D, Eigen M. Co-operative non-enzymic base recognition 3. Kinetics of the helix-coil transition of the oligoribouridylic oligoriboadenylic acid system and of oligoriboadenylic acid alone at acidic pH. J. Mol. Biol. 1971;62:361–381. doi: 10.1016/0022-2836(71)90433-5. [DOI] [PubMed] [Google Scholar]
- 4.Porschke D, Uhlenbeck OC, Martin FH. Thermodynamics and kinetics of the helix-coil transition of oligomers containing GC base pairs. Biopolymers. 1973;12:1313–1335. [Google Scholar]
- 5.Wetmur JG, Davidson N. Kinetics of renaturation of DNA. J. Mol. Biol. 1968;31:349–370. doi: 10.1016/0022-2836(68)90414-2. [DOI] [PubMed] [Google Scholar]
- 6.Scheffler IE, Elson EL, Baldwin RL. Helix formation by dAT oligomers. 1. Hairpin and straight-chain helices. J. Mol. Biol. 1968;36:291–304. doi: 10.1016/0022-2836(68)90156-3. [DOI] [PubMed] [Google Scholar]
- 7.Chu YG, Tinoco I., Jr Temperature-jump kinetics of the dC-G-T-G-A-A-T-T-C-G-C-G double helix containing a GT base pair and the dC-G-C-A-G-A-A-T-T-C-G-C-G double helix containing an extra adenine. Biopolymers. 1983;22:1235–1246. doi: 10.1002/bip.360220415. [DOI] [PubMed] [Google Scholar]
- 8.Vesnaver G, Breslauer KJ. The contribution of DNA single-stranded order to the thermodynamics of duplex formation. Proc. Natl. Acad. Sci. USA. 1991;88:3569–3573. doi: 10.1073/pnas.88.9.3569. [DOI] [PMC free article] [PubMed] [Google Scholar]
- 9.Kushon SA, Jordan JP, Seifert JL, Nielsen H, Nielsen PE, Armitage BA. Effect of secondary structure on the thermodynamics and kinetics of PNA hybridization to DNA hairpins. J. Am. Chem. Soc. 2001;123:10805–10813. doi: 10.1021/ja016310e. [DOI] [PubMed] [Google Scholar]
- 10.Chien FC, Liu JS, Su HJ, Kao LA, Chiou CF, Chen WY, Chen SJ. An investigation into the influence of secondary structures on DNA hybridization using surface plasmon resonance biosensing. Chem. Phys. Lett. 2004;397:429–434. [Google Scholar]
- 11.Zhao Y, Kan ZY, Zeng ZX, Hao YH, Chen H, Tan Z. Determining the folding and unfolding rate constants of nucleic acids by biosensor. Application to telomere G-quadruplex. J. Am. Chem. Soc. 2004;126:13255–13264. doi: 10.1021/ja048398c. [DOI] [PubMed] [Google Scholar]
- 12.Walton SP, Stephanopoulos GN, Yarmush ML, Roth CM. Thermodynamic and kinetic characterization of antisense oligodeoxynucleotide binding to a structured mRNA. Biophys. J. 2002;82:366–377. doi: 10.1016/S0006-3495(02)75401-5. [DOI] [PMC free article] [PubMed] [Google Scholar]
- 13.Tyagi S, Kramer FR. Molecular beacons: probes that fluoresce upon hybridization. Nat. Biotechnol. 1996;14:303–308. doi: 10.1038/nbt0396-303. [DOI] [PubMed] [Google Scholar]
- 14.Riccelli PV, Merante F, Leung KT, Bortolin S, Zastawny RL, Janeczko R, Benight AS. Hybridization of single-stranded DNA targets to immobilized complementary DNA probes: comparison of hairpin versus linear capture probes. Nucleic Acids Res. 2001;29:996–1004. doi: 10.1093/nar/29.4.996. [DOI] [PMC free article] [PubMed] [Google Scholar]
- 15.Wei F, Chen CL, Zhai L, Zhang N, Zhao XS. Recognition of single nucleotide polymorphisms using scanning potential hairpin denaturation. J. Am. Chem. Soc. 2005;127:5306–5307. doi: 10.1021/ja043661v. [DOI] [PubMed] [Google Scholar]
- 16.Wei F, Qu P, Zhai L, Chen CL, Wang HF, Zhao XS. Electric potential induced dissociation of hybridized DNA with hairpin motif immobilized on silicon surface. Langmuir. 2006;22:6280–6285. doi: 10.1021/la060602h. [DOI] [PubMed] [Google Scholar]
- 17.Bonnet G, Tyagi S, Libchaber A, Kramer FR. Thermodynamic basis of the enhanced specificity of structured DNA probes. Proc. Natl. Acad. Sci. USA. 1999;96:6171–6176. doi: 10.1073/pnas.96.11.6171. [DOI] [PMC free article] [PubMed] [Google Scholar]
- 18.Bonnet G, Libchaber A. Optimal sensitivity in molecular recognition. Physica A. 1999;263:68–77. [Google Scholar]
- 19.Forster T. Zwischemolekulare energiewanderung und fluoreszenz. Ann. Phys. Berlin. 1948;437:55–75. [Google Scholar]
- 20.Chirio-Lebrun MC, Prats M. Fluorescence resonance energy transfer (FRET): theory and experiments. Biochem. Educ. 1998;26:320–323. [Google Scholar]
- 21.Heyduk T. Measuring protein conformational changes by FRET/LRET. Curr. Opin. Biotech. 2002;13:292–296. doi: 10.1016/s0958-1669(02)00332-4. [DOI] [PubMed] [Google Scholar]
- 22.Deniz AA, Laurence TA, Beligere GS, Dahan M, Martin AB, Chemla DS, Dawson PE, Schultz PG, Weiss S. Single-molecule protein folding: diffusion fluorescence resonance energy transfer studies of the denaturation of chymotrypsin inhibitor 2. Proc. Natl. Acad. Sci. USA. 2000;97:5179–5184. doi: 10.1073/pnas.090104997. [DOI] [PMC free article] [PubMed] [Google Scholar]
- 23.Mekler V, Kortkhonjia E, Mukhopadhyay J, Knight J, Revyakin A, Kapanidis AN, Niu W, Ebright YW, Levy R, et al. Structural organization of bacterial RNA polymerase holoenzyme and the RNA polymerase-promoter open complex. Cell. 2002;108:599–614. doi: 10.1016/s0092-8674(02)00667-0. [DOI] [PubMed] [Google Scholar]
- 24.Ying LM, Wallace MI, Klenerman D. Two-state model of conformational fluctuation in a DNA hairpin-loop. Chem. Phys. Lett. 2001;334:145–150. [Google Scholar]
- 25.Bonnet G, Krichevsky O, Libchaber A. Kinetics of conformational fluctuations in DNA hairpin-loops. Proc. Natl. Acad. Sci. USA. 1998;95:8602–8606. doi: 10.1073/pnas.95.15.8602. [DOI] [PMC free article] [PubMed] [Google Scholar]
- 26.Goddard NL, Bonnet G, Krichevsky O, Libchaber A. Sequence dependent rigidity of single stranded DNA. Phys. Rev. Lett. 2000;85:2400–2403. doi: 10.1103/PhysRevLett.85.2400. [DOI] [PubMed] [Google Scholar]
- 27.Klostermeier D, Millar DP. Time-resolved fluorescence resonance energy transfer: a versatile tool for the analysis of nucleic acids. Biopolymers. 2001;61:159–179. doi: 10.1002/bip.10146. [DOI] [PubMed] [Google Scholar]
- 28.Antony T, Subramaniam V. A molecular beacon strategy for real-time monitoring of triplex DNA formation kinetics. Antisense Nucleic Acid Drug Dev. 2002;12:145–154. doi: 10.1089/108729002760220743. [DOI] [PubMed] [Google Scholar]
- 29.Morrison LE, Stols LM. Sensitive fluorescence-based thermodynamic and kinetic measurements of DNA hybridization in solution. Biochemistry. 1993;32:3095–3104. doi: 10.1021/bi00063a022. [DOI] [PubMed] [Google Scholar]
- 30.Epstein JR, Leung APK, Lee KH, Walt DR. High-density, microsphere-based fiber optic DNA microarrays. Biosens. Bioelectron. 2003;18:541–546. doi: 10.1016/s0956-5663(03)00021-6. [DOI] [PubMed] [Google Scholar]
- 31.Du H, Disney MD, Miller BL, Krauss TD. Hybridization-based unquenching of DNA hairpins on Au surfaces: prototypical ‘molecular beacon’ biosensors. J. Am. Chem. Soc. 2003;125:4012–4013. doi: 10.1021/ja0290781. [DOI] [PubMed] [Google Scholar]
- 32.Zuker M. Mfold web server for nucleic acid folding and hybridization prediction. Nucleic Acids Res. 2003;31:3406–3415. doi: 10.1093/nar/gkg595. [DOI] [PMC free article] [PubMed] [Google Scholar]
- 33.SantaLucia J. A unified view of polymer, dumbbell, and oligonucleotide DNA nearest-neighbor thermodynamics. Proc. Natl. Acad. Sci. USA. 1998;95:1460–1465. doi: 10.1073/pnas.95.4.1460. [DOI] [PMC free article] [PubMed] [Google Scholar]
- 34.Datta B, Armitage BA. Hybridization of PNA to structured DNA targets: quadruplex invasion and the overhang effect. J. Am. Chem. Soc. 2001;123:9612–9619. doi: 10.1021/ja016204c. [DOI] [PubMed] [Google Scholar]
- 35.Bommarito S, Peyret N, SantaLucia J. Thermodynamic parameters for DNA sequences with dangling ends. Nucleic Acids Res. 2000;28:1929–1934. doi: 10.1093/nar/28.9.1929. [DOI] [PMC free article] [PubMed] [Google Scholar]
- 36.Marky LA, Breslauer KJ. Calculating thermodynamic data for transitions of any molecularity from equilibrium melting curves. Biopolymers. 1987;26:1601–1620. doi: 10.1002/bip.360260911. [DOI] [PubMed] [Google Scholar]
- 37.Borer PN, Dengler B, Tinoco I, Jr, Uhlenbeck OC. Stability of ribonucleic acid double-stranded helices. J. Mol. Biol. 1974;86:843–853. doi: 10.1016/0022-2836(74)90357-x. [DOI] [PubMed] [Google Scholar]
- 38.Turner DH, Sugimoto N, Freier SM. RNA structure prediction. Annu. Rev. Biophys. Biophys. Chem. 1988;17:167–192. doi: 10.1146/annurev.bb.17.060188.001123. [DOI] [PubMed] [Google Scholar]
- 39.Ohmichi T, Nakamuta H, Yasuda K, Sugimoto N. Kinetic property of bulged helix formation: analysis of kinetic behavior using nearest-neighbor parameters. J. Am. Chem. Soc. 2000;122:11286–11294. [Google Scholar]
- 40.Bloomfield VA, Crothers DM, Tinoco I. Nucleic Acids: Structure, Properties and Functions. Sausalito, CA: University Science Books; 2000. Chapter 8. [Google Scholar]
- 41.Moreira BG, You Y, Behlke MA, Owczarzy R. Effects of fluorescent dyes, quenchers, and dangling ends on DNA duplex stability. Biochem. Biophys. Res. Commun. 2005;327:473–484. doi: 10.1016/j.bbrc.2004.12.035. [DOI] [PubMed] [Google Scholar]
- 42.Blake RD, Fresco JR. Polynucleotides. 7. Spectrophotometric study of the kinetics of formation of the two-stranded helical complex resulting from the interaction of polyriboadenylate and polyribouridylate. J. Mol. Biol. 1966;19:145–160. doi: 10.1016/s0022-2836(66)80057-8. [DOI] [PubMed] [Google Scholar]
- 43.Blake RD, Klotz LC, Fresco JR. Polynucleotides. 9. Temperature dependence of kinetics of complex formation in equimolar mixtures of polyriboadenylate and polyribouridylate. J. Am. Chem. Soc. 1968;90:3556–3562. doi: 10.1021/ja01015a047. [DOI] [PubMed] [Google Scholar]
- 44.Laidler KJ. Chemical Kinetics. , 3rd. New York: Harper and Row Publishers, Inc.; 1987. [Google Scholar]
- 45.Neumann E, Ackermann T. Calorimetric measurement of transition enthalpies in the polynucleotide system poly A-poly U. J. Phys. Chem. 1967;71:2377–2379. [Google Scholar]
Associated Data
This section collects any data citations, data availability statements, or supplementary materials included in this article.