Abstract
By using titin as a model system, we have demonstrated that fluorescence quenching can be used to study protein folding at the single molecule level. The unfolded titin molecules with multiple dye molecules attached are able to fold to the native state. In the native folded state, the fluorescence from dye molecules is quenched due to the close proximity between the dye molecules. Unfolding of the titin leads to a dramatic increase in the fluorescence intensity. Such a change makes the folded and unfolded states of a single titin molecule clearly distinguishable and allows us to measure the folding dynamics of individual titin molecules in real time. We have also shown that fluorescence quenching can signal folding and unfolding of a small protein with only one immunoglobulin domain.
The folding dynamics of protein and RNA molecules are complex. The molecules may fold along a multitude of pathways toward the native states, and each pathway may traverse through a number of intermediate folding states (1–3). Even at equilibrium, the molecules may fluctuate between different conformational states. The multiple folding pathways, intermediate folding states, and conformational fluctuations can be directly observed in the time trajectories of individual protein or RNA molecules. Thus, single molecule folding studies are very desirable for a better understanding of the folding dynamics and mechanism. Recently, folding and unfolding of protein and RNA have been studied at the single molecule level by using fluorescence resonance energy transfer (FRET) (4, 5), atomic force spectroscopy (6–8), and laser tweezers (9, 10). Multiple folding pathways and folding intermediate states have been directly observed (4).
Here, we demonstrate that fluorescence quenching between identical molecules, hereafter referred to as fluorescence self-quenching, can be a powerful technique for single-molecule-folding studies. Fluorescence self-quenching has been applied to ensemble studies of protease and nuclease activities (11), membrane fusion (12), and protein-dimer formation (13). We adapt this method to study the folding/unfolding of individual protein molecules. When two identical fluorescent molecules are in close proximity, their fluorescence emission is quenched due to the intermolecular interaction. Increasing the distance between the two molecules will decrease their interaction and thus increase their fluorescence intensity. Attaching the two fluorophores to a host molecule then allows us to sense the conformational change of the host molecule. Because self-quenching requires conjugation of only one type of fluorophore, instead of the two required by FRET, the labeling procedure is much simpler.
In this work, we covalently attached multiple fluorescent dye molecules to a titin molecule. The conjugation of dye molecules did not prevent the folding of titin. In the native state of titin, the fluorescence from the dye molecules was severely quenched. When protein unfolded, the fluorescence increased several-fold. Such a dramatic change was easily measurable at the single molecule level, permitting the study of folding dynamics of individual titin molecules in real time.
Titin is a large protein of about 30,000 amino acid residues. Ninety percent of the titin mass is composed of 200–300 of the Ig-like and fibronectin type III (FNIII)-like modules, and the rest is made of unique sequence insertions (14). In situ, titin forms a >1-μm long filament in muscle sarcomere. The A-band segment of titin binds to other proteins in the thick filament of sarcomere, participating in the regulation of the A-band structure (15, 16). The I-band segment of titin acts as an extensible spring to account for the elasticity of muscle myofibrils (15, 17, 18). Studying the folding and unfolding of titin can reveal the stability of the Ig and FNIII modules, which is important for regulatory function of titin in the thick filament (19). It has also been suggested that long-term over-stretch conditions such as chronic heart failure may cause structural damage of the I-band of titin by unfolding the Ig-like domains (20, 21).
The titin samples used here were extracted from the skeletal muscle of longissismus dorsi of New Zealand White rabbit (kindly provided by Henk L. Granzier group of Washington State University, Pullman, WA). The fluorescent dye used was Oregon green 488 maleimide (absorption maximum: 491 nm; emission maximum: 515 nm; Molecular Probes). The dye molecules were conjugated to the cysteine residues of titin following the conjugation protocol provided by Molecular Probes (http://www.probes.com/media/pis/mp00003.pdf). Unless otherwise mentioned, all of the experiments were performed on a sample with 85% labeling efficiency, i.e., 85% of the cysteine residues were attached with dye.
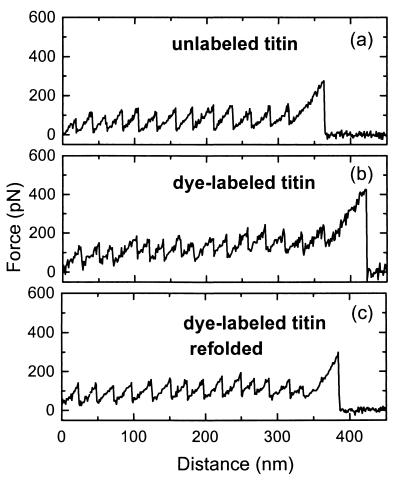
We first showed that the unfolded titin molecules attached with dye molecules were able to fold to the native state by using single-molecule-force spectroscopy (6). In the experiment, the titin molecules were absorbed onto a gold surface from solution (100 μg/ml in Buffer A: 30 mM K-phosphate, pH 7.0, 0.6 M KCl, 0.1% NaN3, 40 μg/ml Leupeptin, and 20 μM E-64). The sample was then probed under Buffer A by a Si3N4 tip of an atomic force microscope (Molecular Imaging, Phoenix, AZ). The tip was pushed against the surface for a few seconds to allow adsorption of titin to the tip and then retracted from the surface. In 40% of the cases, the force extension spectra exhibited a characteristic sawtooth pattern (Fig. 1a). Each sudden force-drop (≈100 pN, except for the last one) corresponds to the unfolding event of an Ig or FNIII module of a single titin molecule attached between the tip and the gold substrate (6). The distance periodicity (≈25 nm) is consistent with the contour length of the unfolded module (6). The same results were obtained with the dye-labeled titin (Fig. 1b): 40% of the force-extension spectra showed the periodic sawtooth pattern; the average number of force-drops per trace, the average force-drop magnitude, and the distance periodicity were identical to those of the unlabeled titin. After we denatured the dye-labeled titin with Buffer B (Buffer A + 8 M urea), none of the recorded force-extension spectra showed the periodic sawtooth pattern. We then tried to refold the protein with Buffer A. Again, 40% of the recorded force-extension spectra showed the sawtooth pattern, with the average number of force-drops, the average force-drop magnitude, and the distance periodicity identical to those of the native titin (Fig. 1c). These results demonstrate that the dye-labeled titin was able to refold to the native structure after denaturation.
Figure 1.
Force vs. distance curve of single titin molecules. (a) Unlabeled titin in Buffer A; (b) titin labeled with Oregon green in Buffer A; (c) titin labeled with Oregon green prepared in Buffer A, unfolded in Buffer B, and then refolded in Buffer A.
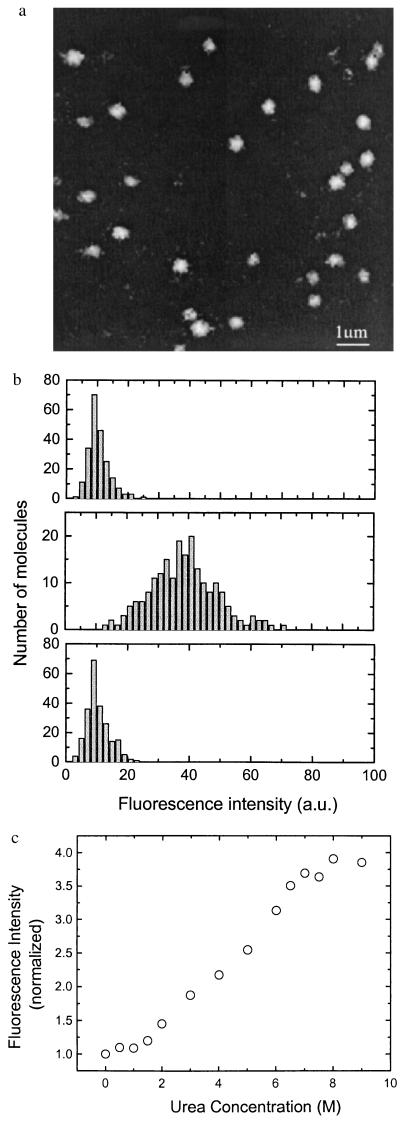
We then studied the folding dynamics of single titin molecules with fluorescence self-quenching. For single molecule fluorescence studies, the labeled titin molecules were immobilized on a glass surface together with the unlabeled molecules at a ratio of 1:100. The resulting surface densities of the labeled and unlabeled titin molecules were 0.2 and 20 molecules/μm2, respectively. Such an immobilization scheme minimizes the surface denaturation effect as shown later. Fluorescence images of the titin molecules were obtained by using a scanning confocal microscope with an Ar-ion laser at 488 nm as the excitation source. A typical image of single titin molecules taken under Buffer A is shown in Fig. 2a. The histograms of the fluorescence intensity of single titin molecules under different conditions are shown in Fig. 2b. The average fluorescence intensity increased by 3.9-fold after we unfolded the titin molecules with Buffer B. On buffer-exchange back to Buffer A, the fluorescence resumed the original value as the titin molecules refolded. This result is identical to the ensemble measurement result of freely floating titin molecules in solution. But, when labeled-titin molecules were immobilized on the surface at a density of 0.2 molecules/μm2 without unlabeled titin, the increase in fluorescence intensity induced by Buffer B was significantly less than 3.9-fold, indicating that the titin molecules were denatured by the surface. Presumably, at the high surface density, 20 molecules per μm2, the titin molecules supported each other and made minimal contact with the surface, thus not suffering from surface denaturation effect.
Figure 2.
(a) Confocal image of single titin molecules labeled with Oregon green. (b) Histogram of fluorescence intensity of single titin molecules labeled with Oregon green. (Upper) Prepared in Buffer A; (Middle) prepared in Buffer A and then unfolded in Buffer B; (Lower) prepared in Buffer A, unfolded in Buffer B, and then refolded in Buffer A. (c) Average fluorescence intensity of single titin molecules vs. urea concentration. The fluorescence intensities were normalized to the value at 0 M urea concentration.
Fig. 2c shows the average fluorescence intensity as a function of urea concentration. The gradual change over a broad range of urea concentration (2–7 M) is consistent with the fact that the urea concentrations required to unfold different modules in titin are widely different (19, 22).
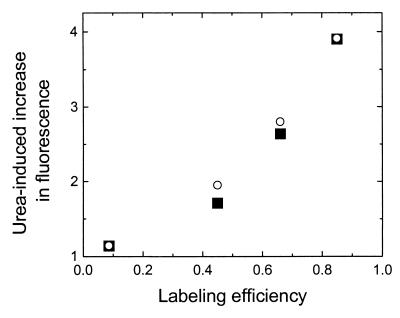
The urea-induced increase in fluorescence intensity was not observed with free Oregon green molecules or the Oregon green-labeled titin molecules with low labeling efficiency. Lowering the dye-labeling efficiency, we found that the urea-induced increase in fluorescence intensity reduced rapidly to an insignificant level (Fig. 3). This clearly shows that the change of fluorescence intensity on buffer exchange is due to self-quenching between dye molecules, instead of change in fluorescence properties of the dye under different solution conditions. Because of the compactness of the three-dimensional structure of native titin, the dye molecules are in close proximity with each other and their fluorescence is severely quenched. After unfolding, the protein swells and reduces the proximity among dye molecules, thus leading to a dramatic increase in fluorescence.
Figure 3.
Urea-induced increase in fluorescence (defined as the ratio between the average fluorescence intensity of single titin molecules in Buffer B and that in Buffer A) vs. labeling efficiency. Filled squares are the experimental results and open circles are the calculated results by using an intradomain quenching model.
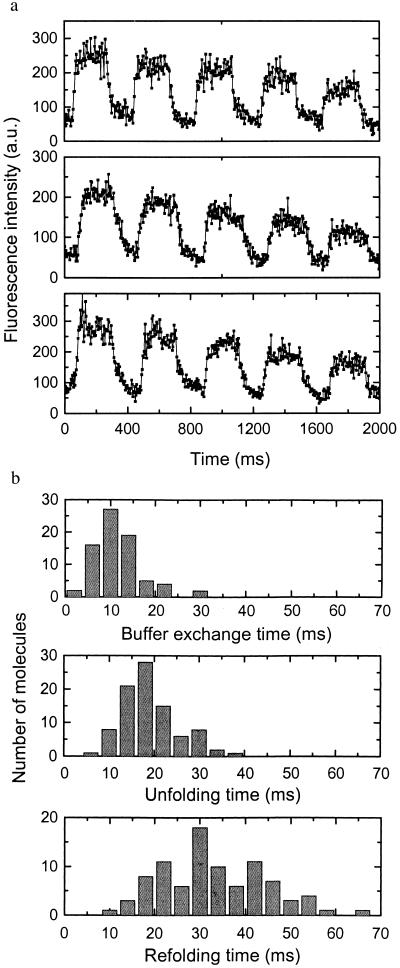
We next probed the real-time unfolding/folding dynamics of single titin molecules on buffer exchange. We measured the fluorescence intensity of single titin molecules while exchanging the buffers between Buffers A and B repetitively. The single-molecule fluorescence time traces clearly show the signal increase on the arrival of urea and recovery when urea was removed (Fig. 4a). The gradual decrease of fluorescence intensity over time was due to the photobleaching of dye molecules.
Figure 4.
(a) Three time traces of fluorescence intensity of single titin molecules on buffer exchange between Buffers A and B. (b) Histogram of the buffer exchange time (Upper), the observed unfolding time (Middle), and refolding time (Lower) of titin. The buffer exchange time is obtained in the following way: We immobilized Oregon green-labeled streptavidin on a biotinylated surface and measured the fluorescence time trace while rapidly exchanging between buffers with pH 4 and pH 5.5. The fluorescence is high at pH 5.5 and low at pH 4. The buffer exchange time was obtained by fitting the rising and falling edges of the time traces with single exponential decays. The observed unfolding and refolding times of titin were obtained from fitting the rising and falling edges of the time traces, respectively, with single exponential decays. Each time trace gave one count.
From the time traces, we calculated the unfolding and refolding time. As shown in Fig. 4b, the observed refolding time (average 32 ms) is resolvable from the buffer exchange dead time (≈10 ms). Its broad distribution is beyond the experimental error. When we did similar experiments on a sample with a higher surface density of labeled titin, with several labeled-titin molecules under the laser beam spot simultaneously, the refolding time histogram shows a rather narrow distribution with an average of 31 ms and a width similar to that of the buffer exchange time histogram. Therefore, we interpret the broad distribution of refolding dynamics as being due to inhomogeneity. The reasons for inhomogeneity can be either intrinsic (multiple folding pathways) or extrinsic (a microenvironmental difference that leads to different folding rates). Presently, the unfolding dynamics are not well resolved from the buffer exchange time.
An interesting issue is whether the quenching of fluorescence was mainly between the dye molecules on the same module (intradomain quenching) or the dye molecules on different modules (interdomain quenching). We now argue that intradomain quenching is a more likely scenario. The titin used here has about 500 cysteines, with more than 90% of them on the 297 Ig or FNIII modules. The ratios between the number of modules that have 0, 1, 2, 3, 4, and 5 cysteines are 1:1.9:1.9:0.9:0.3:0.08. [These ratios are calculated from the rabbit sequence of the I-band titin and the human sequence of the whole titin (European Molecular Biology Laboratory data library entries Y18102, Y14852, and X64696). Comparison of the human sequence with rabbit sequence in the Z-disk, I-band, and A-band shows that the cysteine content is highly conserved between the two species.] Assuming that all cysteines were equally accessible for labeling, we found that, for the titin with 85% labeling efficiency, 75% of the dye molecules had at least one partner dye molecule on the same module (Type-I) and that 25% are by themselves (Type-II). Because the dyes on the same module can get significantly closer than those on different modules, they are more likely to quench each other. Assuming that the fluorescence from Type-I dyes is completely quenched and the fluorescence from Type-II dyes is not quenched in the folded state of titin, while the fluorescence from both types is not quenched in the unfolded state, we calculated the unfolding-induced increase in fluorescence at different labeling efficiencies. The calculated results are shown in Fig. 3, in excellent agreement with the experimental values.
The above observations support the intradomain quenching model. They also suggest that protein with only one or a few domains, if properly labeled, can exhibit similar fluorescence quenching and thus increase in fluorescence intensity when the protein is unfolded. This is confirmed by our ensemble measurement results on a single domain protein. This protein is a single Ig domain (I65) expressed from titin. I65 has two cysteine residues. For a sample that had 80% labeling efficiency, unfolding of the protein led to an average increase in fluorescence intensity of almost 3-fold. In contrast, no significant increase in fluorescence was observed for a sample with 2% labeling efficiency.
Finally, we discuss the mechanism of fluorescence self-quenching. Although proximity-induced fluorescence self-quenching has been observed for decades, a complete understanding of self-quenching remains elusive. The underlying mechanisms for self-quenching can be very diverse and system-dependent. Mechanisms such as cross relaxation between fluorescent-particle pairs (23, 24) exciton migration to trap-sites (25), exciton–exciton recombination (26), dimer formation (27, 28), and excimer formation (29, 30) have been suggested. In our experiment, the excitation intensity was about 10 W/cm2. Under this condition, less than 0.01% of dye molecules were excited simultaneously. The average distance between two excited dye molecules was a few tens of nanometers. Therefore, the chance of exciton–exciton recombination was negligible. This was further confirmed by the fact that change in fluorescence due to quenching was independent of the excitation intensity. Dimer formation was also unlikely to be responsible for the observed fluorescence quenching. The fractions of dye molecules forming dimers in both dye-labeled multidomain titin and single-domain I65 were determined to be <10% by comparing their absorption spectra with those previously measured monomer and dimer spectra (28). The fluorescence spectra of dye-labeled titin and I65 showed no detectable excimers, which would give a fluorescence emission band red-shifted from that of the monomer (29, 30). Thus, we can exclude exciton–exciton recombination, dimer formation, and excimer formation as the mechanisms for quenching in our case. However, the exact mechanism is still unknown.
To summarize, we have demonstrated that fluorescence self-quenching between identical dye molecules can be used to study protein folding at the single molecule level. We have applied this technique to study the folding of titin and observed real-time folding dynamics of individual titin molecules. Currently, we are extending the study to smaller proteins that have only one or a few domains. Our preliminary results show that unfolding of a single domain protein labeled with two identical dye molecules also led to a large increase in fluorescence intensity. We also expect fluorescence self-quenching to find its application in studying other biological processes, such as RNA folding or conformational changes of enzymes during functioning.
Acknowledgments
This research was supported by National Science Foundation Grant PHY-9970018 and Air Force Office of Scientific Research Grant GM49423 (to S.C.). X.Z. is supported by the Marvin Chodorow Fellowship of the Stanford Applied Physics Department and a National Institutes of Health postdoctoral fellowship. H.D.K. was supported by a Stanford University graduate fellowship. T.C. and S.L. thank the Deutsche Forschungsgemeinschaft and Human Frontier Science Program Organization for support.
References
- 1.Baldwin R L. Nature (London) 1994;369:183–184. doi: 10.1038/369183a0. [DOI] [PubMed] [Google Scholar]
- 2.Onuchic J N, Luthey-Schulten Z, Wolynes P G. Annu Rev Phys Chem. 1997;48:545–600. doi: 10.1146/annurev.physchem.48.1.545. [DOI] [PubMed] [Google Scholar]
- 3.Dill K A, Chan H S. Nat Struct Biol. 1997;4:10–19. doi: 10.1038/nsb0197-10. [DOI] [PubMed] [Google Scholar]
- 4.Zhuang X, Bartley L E, Babcock H P, Russell R, Ha T, Herschlag D, Chu S. Science. 2000;288:2048–2051. doi: 10.1126/science.288.5473.2048. [DOI] [PubMed] [Google Scholar]
- 5.Deniz A A, Laurence T A, Beligere G S, Dehan M, Martin A B, Chemla D S, Dawson P E, Schultz P G, Weiss S. Proc Natl Acad Sci USA. 2000;97:5179–5184. doi: 10.1073/pnas.090104997. . (First Published May 2, 2000; 10.1073/pnas.090104997) [DOI] [PMC free article] [PubMed] [Google Scholar]
- 6.Rief M, Gautel M, Oesterhelt F, Fernandez J M, Gaub H E. Science. 1997;276:1109–1112. doi: 10.1126/science.276.5315.1109. [DOI] [PubMed] [Google Scholar]
- 7.Oberhauser A F, Marszalek P E, Erickson H P, Fernandez J M. Nature (London) 1998;393:181–185. doi: 10.1038/30270. [DOI] [PubMed] [Google Scholar]
- 8.Oesterhelt D, Oesterhelt F, Pfeiffer M, Engel A, Gaub H E, Müller D J. Science. 2000;288:143–146. doi: 10.1126/science.288.5463.143. [DOI] [PubMed] [Google Scholar]
- 9.Kellermayer M S Z, Smith S B, Granzier H L, Bustamante C. Science. 1997;276:1112–1116. doi: 10.1126/science.276.5315.1112. [DOI] [PubMed] [Google Scholar]
- 10.Tskhovrebova L, Trinick J, Sleep J A, Simmons R M. Nature (London) 1997;387:308–312. doi: 10.1038/387308a0. [DOI] [PubMed] [Google Scholar]
- 11.Jones L J, Upson R H, Haugland R P, Panchuk-Voloshina N, Zhou M, Haugland R P. Anal Biochem. 1997;251:144–152. doi: 10.1006/abio.1997.2259. [DOI] [PubMed] [Google Scholar]
- 12.Weinstein J N, Ralston E, Leserman L D, Klausner R D, Dragsten P, Henkart P, Blumenthal R. In: Liposomen Technology. Gregoriadis G, editor. Boca Raton, FL: CRC; 1984. pp. 183–204. [Google Scholar]
- 13.Wendt H, Berger C, Baici A, Thomas R M, Bosshard H R. Biochemistry. 1995;34:4097–4107. doi: 10.1021/bi00012a028. [DOI] [PubMed] [Google Scholar]
- 14.Labeit S, Kolmerer B. Science. 1995;270:293–296. doi: 10.1126/science.270.5234.293. [DOI] [PubMed] [Google Scholar]
- 15.Fürst D O, Osborn M, Nave R, Weber K. J Cell Biol. 1988;106:1563–1572. doi: 10.1083/jcb.106.5.1563. [DOI] [PMC free article] [PubMed] [Google Scholar]
- 16.Labeit S, Gautel M, Lakey A, Trinick J. EMBO J. 1992;11:1711–1716. doi: 10.1002/j.1460-2075.1992.tb05222.x. [DOI] [PMC free article] [PubMed] [Google Scholar]
- 17.Magid A, Law D J. Science. 1985;230:1280–1282. doi: 10.1126/science.4071053. [DOI] [PubMed] [Google Scholar]
- 18.Granzier H L, Irving T C. Biophys J. 1995;68:1027–1044. doi: 10.1016/S0006-3495(95)80278-X. [DOI] [PMC free article] [PubMed] [Google Scholar]
- 19.Politou A S, Thomas D J, Pastore A. Biophys J. 1995;69:2601–2610. doi: 10.1016/S0006-3495(95)80131-1. [DOI] [PMC free article] [PubMed] [Google Scholar]
- 20.Helmes M, Trombitas K, Centner T, Kellermayer M, Labeit S, Linke W A, Granzier H. Circ Res. 1999;84:1339–1352. doi: 10.1161/01.res.84.11.1339. [DOI] [PubMed] [Google Scholar]
- 21.Linke W A, Rudy D E, Centner T, Gautel M, Witt C C, Labeit S, Gregorio C C. J Cell Biol. 1999;146:631–644. doi: 10.1083/jcb.146.3.631. [DOI] [PMC free article] [PubMed] [Google Scholar]
- 22.Politou A S, Gautel M, Improta S, Vangelista L, Pastore A. J Mol Biol. 1996;255:604–616. doi: 10.1006/jmbi.1996.0050. [DOI] [PubMed] [Google Scholar]
- 23.Broer M M, Huber D L, Yen W M, Zwicker W K. Phys Rev Lett. 1982;49:394–398. [Google Scholar]
- 24.Malinowski M. Phys Rev. 1986;B34:7578–7586. doi: 10.1103/physrevb.34.7578. [DOI] [PubMed] [Google Scholar]
- 25.Lawson C M, Powell R C, Zwicker W K. Phys Rev. 1982;B26:4836–4844. [Google Scholar]
- 26.Benderskii V A, Brikneshtein V Kh, Lavrushko A G, Filippov P G. Phys Status Solidi. 1978;B86:449–458. [Google Scholar]
- 27.Agranovich, V. M. & Galanin, M. D. Electronic Excitation Energy Transfer in Condensed Matter (North–Holland, Amsterdam).
- 28.Chen R F, Knutson J R. Anal Biochem. 1988;172:61–77. doi: 10.1016/0003-2697(88)90412-5. [DOI] [PubMed] [Google Scholar]
- 29.Stevens B. Adv Photochem. 1971;8:161–226. [Google Scholar]
- 30.Birks J B. Rep Prog Phys. 1975;38:903–974. [Google Scholar]


