Abstract
Electron tomography is the only technique available that allows us to visualize the three-dimensional structure of unfixed and unstained cells currently with a resolution of 6–8 nm, but with the prospect to reach 2–4 nm. This raises the possibility of detecting and identifying specific macromolecular complexes within their cellular context by virtue of their structural signature. Templates derived from the high-resolution structure of the molecule under scrutiny are used to search the reconstructed volume. Here we outline and test a computationally feasible two-step procedure: In a first step, mean-curvature motion is used for segmentation, yielding subvolumes that contain with a high probability macromolecules in the expected size range. Subsequently, the particles contained in the subvolumes are identified by cross-correlation, using a set of three-dimensional templates. With simulated and real tomographic data we demonstrate that such an approach is feasible and we explore the detection limits. Even structurally similar particles, such as the thermosome, GroEL, and the 20S proteasome can be identified with high fidelity. This opens up exciting prospects for mapping the territorial distribution of macromolecules and for analyzing molecular interactions in situ.
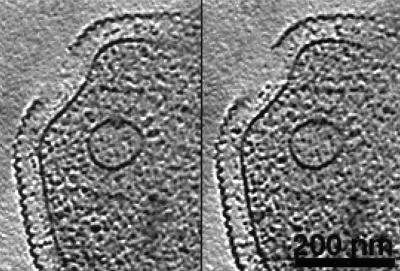
It has been a dream of cell biologists to catch a glimpse of the molecular architecture inside cells or cellular organelles, ideally by using a noninvasive technique (1–3). Rapid freezing techniques have been developed, which allow the “vitrification” of biological materials and thus ensure their close-to-life preservation (4, 5). With the advent of automated electron tomography (6–9) it has become possible to obtain three-dimensional (3D) data sets of whole ice-embedded cells or organelles (10, 11) with subcritical doses. Currently, the resolution obtained in electron tomography of cellular structures (Fig. 1) is in the range of 6 to 8 nm. It is reasonable to expect that high-end instrumentation will bring us into the realm of molecular resolution (2–4 nm). The goal of cellular electron tomography is not to obtain a high-resolution structure of a particular macromolecule; the goal is to identify a molecule by virtue of its structural signature and to locate it in the context of its cellular environment. Inevitably, the electron tomograms will suffer from a low signal-to-noise ratio (SNR), and so-called denoising techniques (12, 13) can provide only partial remedy. However, if we have high- or medium-resolution structures of the molecule under scrutiny, furnished by x-ray crystallography, electron microscopy, or any combination of structural biology techniques, these can be used as templates to search the reconstructed cellular volume. This type of scan will make it possible not only to map the distribution of molecules within the cell; it also will reveal the spatial relationships of molecules in functional modules.
Figure 1.
Two x-y slices of a tomographic reconstruction of a whole ice-embedded Pyrodictium abyssi cell. The plasma membrane and intracellular vesicles are clearly recognizable. The vesicles are surrounded by dark protein masses, probably macromolecular assemblies involved in exo- or endocytosis. The resolution of the tomographic data set, obtained with a CM 120 Biofilter, is about 8 nm.
The purpose of this paper is to outline a computationally feasible strategy for the detection and identification of macromolecules in tomographic reconstructions. Using real and simulated data we explore the fidelity of the approach and the limits of detection. In principle it is certainly possible to scan the entire reconstructed volume by 3D cross-correlation with a molecular template. However, such a “brute force” approach is computationally very expensive, because the orientation of the particles will be random and, consequently, the whole angular range has to be scanned by rotating the templates and calculating the cross-correlation coefficient (CCC) for all independent combinations of Eulerian angles. As an alternative, we explore a two-step approach. In the first step, the tomographic volume is segmented by use of a nonlinear anisotropic diffusion procedure, referred to as mean-curvature motion (MCM) (14). This particular diffusion process equilibrates uncorrelated structures and highly curved features (e.g., small proteins, noise) faster with their environment than particles exhibiting surfaces with a lower curvature (e.g., macromolecules, cellular compartments). The appropriate adjustment of the number of iterations makes it possible to selectively detect the position of particles with a specific curvature, yielding subvolumes containing particles in the size range of interest with a high probability.
In a second step, the particles contained in the subvolumes are compared with known structures by calculating the 3D cross-correlation of the segmented volumes with known protein templates. Compared with the brute force approach, the number of necessary correlation functions is significantly reduced. Nevertheless, these scans have to be carried out for every segmented subvolume, for every template to be searched for and for every independent set of Eulerian angles. The maximum of a set of correlation peaks is assumed to yield the correct type of particle, as well as its precise position and orientation.
To test this object identification algorithm quantitatively, we applied it to simulated tomographic volumes. Depending on the resolution and the SNR, the detection limits were analyzed, knowing the correct positions, orientations, and types of particles to be detected. This part of the study provides quantitative measures for the reliability of the detection procedure. The feasibility of the algorithm for real data was analyzed by scanning electron-tomographic volumes, containing specific purified macromolecules, with several structurally similar templates.
Methods
Artificial Volumes.
In single-axis electron tomography, a set of projection images is recorded by tilting the specimen holder stepwise about one axis. The projections are translationally aligned and backprojected into a common volume to reconstruct the 3D volume of the object (15–17). Two major restrictions apply. Cryo-specimen holders do not allow to tilt the specimen beyond ± 70°. The radiation sensitivity of the ice-embedded biological materials limits the number of projections that can be recorded without damaging the sample, and thus the cumulative dose should not exceed 2,000–5,000 e−/nm2. As a result, the 3D reconstructions suffer from a low SNR, an elongation of the point-spread function in the z-direction (missing wedge) and ultimately a limitation in resolution because of the limited number of angular samples. All of these effects must be taken into account when simulating tomographic reconstructions realistically.
Synthetic tomographic volumes were generated by randomly positioning and orienting low-frequency filtered crystal structures of three types of macromolecules within a test volume. The frequency cut-offs were set to 2-, 4-, and 8-nm resolution, respectively, which covers the range between the resolution that is currently attainable with cellular structures (6–8 nm) and the resolution we expect to achieve with high-end instrumentation (2–4 nm). Projecting the test volumes perpendicular to a virtual tilt axis with 5° increments from −60° to +60° resulted in a simulated data set of a single-axis tilt series. The images were convoluted with a contrast transfer function corresponding to a Philips Twin-lens electron microscope operated at 300 kV and 4 μm underfocus. The projections were shifted randomly in the x-y plane to model alignment errors of the projections with a variance of 1 pixel, a value typical for experimental data. The volumes were reconstructed by weighted back projection. Colored noise [with a cut-off at (3.6 nm)−1, corresponding to 1/4 of the Nyquist frequency], again reconstructed from projections in the range from −60° to +60° with 5° increments, was added to the particle volume. The SNR equaled 0.5, a realistic value for tomographic reconstructions obtained with an energy filtering microscope at 4 μm underfocus as measured for real data sets using SNR = CCC/(CCC − 1) (17). The SNR of the simulated volumes was determined by using 343 pixels per volume and a pixel size corresponding to 0.45 nm, leading to volumes just slightly larger than the particles (SNR = σs2/σn2 with σs2 and σn2 being the variances of the signal and the noise, respectively).
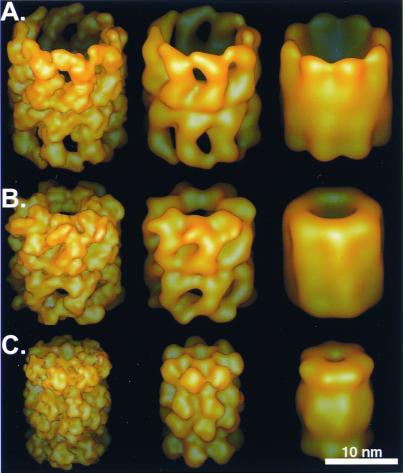
Three test molecules of similar size and shape were used: the 20S proteasome (721 kDa, ref. 18), the group I chaperonin GroEL (840 kDa, ref. 19), and the thermosome, representing the group II chaperonins (933 kDa, ref. 20). Fig. 2 shows isosurface representations of the crystal structures of the test molecules filtered to 2-, 4-, and 8-nm resolution, respectively. Slices through the simulated volumes containing the three molecules filtered to 4-nm resolution are shown in Fig. 3. All image processing steps described here were carried out by using the em program package (21).
Figure 2.
The three macromolecular assemblies used as test particles: (A) the thermosome (℘ ≈16 nm) with an 8-fold rotational symmetry, (B) GroEL (℘ ≈15 nm) with a 7-fold rotational symmetry, and (C) the 20S proteasome (℘ ≈12 nm) with a 7-fold rotational symmetry. The particles were filtered to 2-, 4-, and 8-nm resolution (from left to right).
Figure 3.
Artificial electron-tomographic volumes of (A) thermosome, (B) 20S proteasome, and (C) GroEL macromolecules. The particles were randomly distributed and oriented within the volumes. To simulate electron-tomographic data acquisition, the volumes were projected perpendicular to a virtual tilt axis from −60° to + 60° with 5° increments. The projections were shifted in the x-y plane, convoluted with a realistic contrast transfer function, backprojected and obscured by “colored noise” with a SNR of 0.5.
Protein Isolation, Sample Preparation, and Data Acquisition.
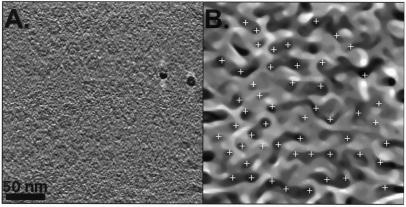
Molecules of the same type as used in the simulations (20S proteasomes and thermosomes) also were used in recording real tomographic data sets. The α-only thermosomes were expressed in Escherichia coli (22, 23). The sample was applied to a holey carbon film grid. After blotting, the samples were vitrified by plunging them into liquid ethane (4). Single-axis tilt-series of the thermosomes were recorded by using a CM 200 FEG (Philips, Eindhoven, The Netherlands) at 120 kV accelerating voltage and a nominal underfocus of 2 μm. Data were recorded from −54° to + 54° with 6° angular increments. The cumulative dose used for recording the tilt series was ≈2,000 e−/nm2. The experimental setup for automated tomographic data collection has been described (6, 7). A slice through the reconstruction is shown in Fig. 4A.
Figure 4.
(A) Slice from the tomographic reconstruction of ice-embedded thermosome particles. The particles are preferentially arranged in a top-view orientation at the water-air interface before freezing. Two high-contrast gold particles, used for aligning the projections, are visible in the right half of the left image. (B) A projection of the MCM-processed version of A after 10 iterations. The peaks detected by the peak search algorithm described are shown as white crosses. The particles close to the border of the volume were excluded from detection.
The 20S proteasomes were isolated from Drosophila melanogaster embryos as described (24), and the method of sample preparation was the same as described for the thermosome. Tomographic data sets were recorded by using a Philips CM 120 Biofilter at an underfocus of 3 μm. To achieve a uniform spacing of the projections in the z*-direction within the resolution sphere in Fourier space, the angular increment followed the Saxton scheme (25) with an initial tilt increment of 2.5° from −69° to +66°. After the alignment using gold markers, the 3D reconstruction was computed by weighted back projection.
Generation of Templates.
To generate the templates required in the search algorithms, the atomic coordinates of the yeast 20S proteasome and E. coli GroEL were downloaded from the Protein Data Bank (http://www.rcsb.org/pdb/index.html). For the thermosome in the open, substrate-accepting conformation, as it is observed in cryo-electron micrographs (26), only a pseudoatomic model is available (20). For all templates, the gray-scale value of each voxel was assigned according to the sum of atomic numbers of atoms contained in that voxel. The voxel size was chosen corresponding to the sampling of the reconstructed tomographic volumes. Next, the templates were filtered to the resolutions expected for tomographic reconstructions (2, 4, and 8 nm, respectively). The cut-off in Fourier space at the frequency fc was smoothed by a Gaussian kernel with width of fc/2.
Volume Segmentation by MCM.
Segmentation techniques allow us to reduce the amount of data significantly by extracting the information that is relevant for a given purpose. In electron tomography, conventional segmentation techniques (e.g., multiple thresholding criteria, iso-elevation contour lines; ref. 27) usually fail because of the low SNR and tomographic artifacts (2). Here, we applied MCM for tomographic volume segmentation. The method does not rely on high-contrast features nor is it very sensitive to noise or artifacts. Only the size and the shape of objects are relevant and not the structure; unlike correlation techniques, MCM does not require a reference. Moreover, it outperforms standard correlation techniques by far in terms of computation time.
MCM can be considered as the evolution of level lines, which are driven by forces depending on the local curvature (14, 28). Following a theorem by Grayson (29), such a level line collapses to a point and finally disappears. The process can be described by the following equation:
 |
with I being the 3D density distribution, t the time, and κ the curvature (28). For the implemented discretization technique see the supplemental material that is published on the PNAS web site, www.pnas.org.
It is assumed that the volume exhibits objects, e.g., macromolecules,
which are identified on the basis of gray levels different from those
of the background. Starting with a complex volume, features of interest
and the noise are degraded in parallel at decreasing resolution levels,
resulting in a constant gray-value volume. As all isointensity surfaces
move depending on their curvature, highly curved features, such as
sharp edges or uncorrelated noise are smoothed out and eliminated
first. Extended features are degraded more slowly and thus can be
distinguished from their surroundings. When applying MCM, the radius of
a spherical particle r is a function of iteration time
(e.g., the number of iterations t). The number of iterations
t until an isointensity surface of a structure with an
initial radius r(0) vanishes follows from the equation:
r(t) =
 . The
starting radius r(0) corresponds to the boundary radius
of the feature in pixels, c is a constant. Objects of the
same diameter shrink and disappear at the same iteration step, and
small objects disappear faster than larger ones. For particle
detection, the singularity points of the vanishing isointensity
surfaces are determined and used as pointers to the position of the
particles. To automatically detect the peaks corresponding to the
coordinates of a particle we applied the following algorithm. First,
the maximum of an area is determined. A sphere with the diameter of the
particle under scrutiny is cut out and the maximum of the boundary is
calculated. If the maximum satisfies a certain threshold, the peak is
going to be further classified. This procedure ensures that only
objects falling into the predetermined size range will be detected.
Particle Identification.
Once subvolumes containing particles in the size range of interest are cut out, cross-correlation techniques are used to measure the degree of overall similarity of the particles under scrutiny to structurally well-defined templates. In the case of electron tomograms of cellular structures, the orientation of the particles is expected to be random. To yield the absolute maximum of all cross-correlation coefficients, the whole angular range needs to be scanned with each template. Rotating the templates to every independent combination of Eulerian angles with 10° increments coarsely scans the three rotational degrees of freedom. The particle then is translationally aligned with the templates and the angular scan is refined by a ± 5° fine-scan with 1° increment around the Eulerian angles derived from the previous cycle. The massive amount of correlation functions that needs to be calculated for this step typically results in approximately 1 h of computation time for each particle and for each template on a SGI R10000 processor (SGI, Mountain View, CA). The analysis of a whole tomographic volume, containing several hundred particles that need to be compared with an array of different templates, would require several weeks or even months of computation time. To perform the computation within reasonable time, the algorithm was adapted to a Cray T3E-600 with 784 processors, using the parallelized version of the em program package. Every processor reads one template and one particle volume into memory and performs the angular scan. The maximum of all CCCs is determined before the next particle volume is read into the memory. After all particles have been subjected to cross-correlation, the next template is read and the peak search is repeated. As communication between the processors is minimal, this task lends itself to parallelization. The computation time scales inversely with the number of processors being used.
Results
Performance of MCM.
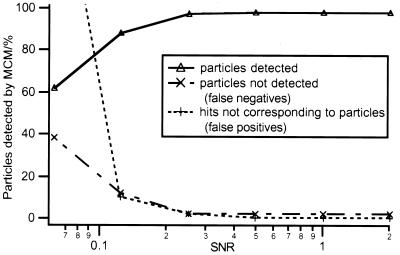
MCM was used to segment the tomographic volumes before calculating the cross-correlation functions with the templates. The reliability of the particle detection by MCM was analyzed by using artificial volumes with SNRs ranging from 0.06 to 2 (Fig. 5). An MCM-processed image of real thermosomes and the corresponding peak detection is shown in Fig. 4B.
Figure 5.
Performance of MCM on the detection of macromolecules in simulated electron-tomographic volumes. The percentage of particles located correctly, of existing particles not detected (false negatives) and nonexisting particles detected (false positives) was measured at different SNRs.
For SNRs better than 0.2, the ratio of correct versus incorrect detections turned out to be satisfactory (> 90% detected). The detection reliability is affected when particles are in close contact with each other. In this case the particle images become confluent and vanish later than expected considering the radius of the particles. Conversely, problems arise also when images of multisubunit complexes display poor connectivity; the corresponding blobs will disappear after relatively few iteration steps and thus escape the detection.
When subjecting noisy electron-tomographic data to a MCM procedure, areas corresponding to particle images shrink to small, noise-free blobs, which can be detected automatically by a peak search routine. The process preserves the center of mass of each particle. Therefore the subsequent correlation analysis can be performed for each particle within a small volume around the center of mass. When compared with the overall volume of a tomogram, an enormous data reduction is achieved. Furthermore, the algorithm is computationally very efficient. For example, only 15 s are needed for one iteration with a 2563 volume on a R10000 SGI processor. The preknown size of the particles of interest can be used to adjust the number of necessary iterations accordingly (typically 20–30).
Protein Identification.
The main goal of the approach presented here is to test the feasibility of identifying known proteins in tomographic reconstructions of small cells. For an assessment of the quality of the identification, two methods are used.
First, the height of the correlation peaks is used as an identification criterion. The maximum correlation coefficient of a volume containing only one particle of type i (Voli) scanned with a template of the same type of particle (Templi) is determined: CCCmax(Voli, Templi). As the particle volume and the template were generated by using the same type of particle, CCCmax(Voli, Templi) measures the maximum correlation height one can expect for a template and a reconstructed volume containing an identical molecule in the presence of noise. Next, the particle volume Voli is correlated with a template generated by using a different type of particle (Templj), resulting in CCCmax(Voli, Templj). This number is compared with CCCmax(Voli, Templi) by calculating the ratio of the two numbers. Thus, we measure the relative heights hij of the cross-correlation peaks of a particle volume scanned with the “correct” template (meaning that particle and template are the same molecule, e.g., i = j) versus an “incorrect” template particle (meaning that particle and template are a different molecule, i ≠ j):
 |
if hij > 1 we assign that the particle was identified; if hij < 1 we assign that the particle was not identified.
As a second measure for the identification fidelity, we analyze the statistical distribution of the correlation peaks. Assuming a normal distribution of the correlation peak heights, we determine the significance level α of the detection results, i.e., the probability that an existing particle is not identified (30), by using:
 |
with
 |
with  being the average of
correlation peaks for a particle i scanned with template
i and j. σ is the standard deviation of CCCs,
and n is the number of CCCs.
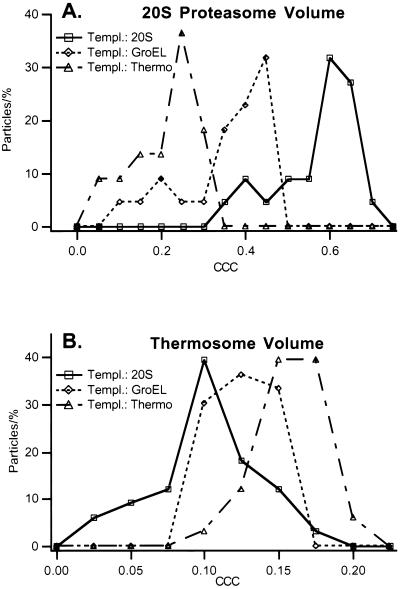
With real tomographic data sets containing thermosomes, the height of the maximum correlation peak was on average 1.67 times smaller for subvolumes scanned with a 20S proteasome template instead of the correct thermosome template, and it was 1.28 times smaller when GroEL was used as the template (Fig. 6A). With the 20S proteasome data set (Fig. 6B), the differences were even more pronounced. The maximum correlation peaks are three times smaller if the volume was scanned with a thermosome template instead of the correct 20S proteasome template, or 1.65 times smaller when GroEL was used as a template. With both reconstructed volumes of purified protein complexes, h was greater than 1 for every particle scanned and thus the algorithm yielded the correct identification in all cases.
Figure 6.
Distribution of the CCC peak-heights for the reconstructed 20S proteasomes (A) and thermosome (B) particles. The reconstructed volumes were independently correlated with a 20S proteasome, a GroEL, and a thermosome template. The correlation peaks are distinctively higher if particle volume and template correspond to each other and thus the correct particle can be discriminated. Upon visual inspection, the particles corresponding to the left tails of the distribution appear to have structural defects. All particles have been identified correctly.
For the thermosome/GroEL comparison q was calculated to be 7.9, and for the thermosome/20S proteasome comparison q was 6.3. Again, with the 20S proteasome data, the detection quality is higher: q = 13.8 for the 20S proteasome/thermosome comparison and 7 for the 20S proteasome/GroEL comparison. The calculated values for q in turn are used to derive the significance levels α. The tabulated values for α all are found to be smaller than 0.01%. Following the criterion of significance levels, more than 99% of all particles are identified correctly. The higher overall correlation levels observed with the 20S proteasome volume reflect the limited resolution of the data set, obtained by using a Philips CM 120 Biofilter with a tomographic setup that was optimized for cellular but not molecular structures.
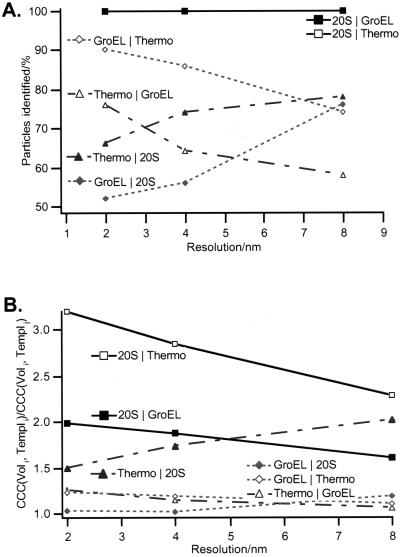
For exploring the detection limits we used simulated tomographic reconstructions (Fig. 7). When two related particles are very similar in size and shape, such as the thermosome and GroEL, and the main discriminating feature is their symmetry (8-fold vs. 7-fold), the fidelity of identifying them correctly improves at higher resolutions. At resolutions better than 4 nm, the significance level drops below 10%; nevertheless, when relative CCC peak heights are used as detection criterion, more than 80% of the particles are identified correctly. It is not surprising that the discrimination of the 20S proteasome from the other particles is less demanding; the proteasome has the same 7-fold symmetry as GroEL, but deviates markedly from the two chaperonins in its diameter (approximately 12 nm compared with 15 nm and 16 nm, respectively). It is surprising, though, that the fidelity of discriminating the 20S proteasome from the two chaperonins does not improve at higher resolutions. It appears that the differences in the low-frequency range are strong enough to ensure a correct identification.
Figure 7.
Identification results for simulated volumes at different resolutions. (A) The percentage of particles detected correctly is shown. The detection criterion was the following. The correlation peak of particle volume i and template i was calculated. The result was divided by the correlation peak of particle volume i and template j. If the result was > 1, the identification was assumed to be correct. (B) The average of this ratio over all particles is plotted. Because of the difference in diameter, the 20S proteasome can be easily discriminated from the two other particles. To distinguish the thermosome and GroEL, a good resolution is obligatory as the low-resolution information of the two particles is basically identical (same size and shape), whereas the high-resolution data differ because of the distinct symmetry (8-fold vs. 7-fold). The opposite is true for the discrimination of GroEL and the 20S proteasome: the two particles are identical in symmetry, but differ in size, therefore a resolution of 8 nm is sufficient for a successful identification.
Discussion
Currently, the resolution of electron tomograms of whole ice-embedded prokaryotic cells and organelles is limited to 6–8 nm. However, with more advanced instrumentation an improvement in resolution by a factor of 2 can be expected in the near future. This will set the stage for an analysis of in situ molecular architecture. Obviously, the reconstructions will suffer from a low SNR, and tomographic artifacts will degrade the quality of reconstructions further (e.g., missing wedge, discrete angular sampling). Therefore, we cannot expect to be able to interpret such tomograms by visual inspection. Provided that high-resolution structures of the molecules of interest are available, we can, however, generate templates that allow us to search the reconstructed volumes and to map out the spatial distribution of structures that match the templates. If we perform the search with multiple templates, we can analyze the spatial relationships of molecules in functional modules with unprecedented resolution. Hitherto, the physical isolation of many types of supramolecular structures remained elusive, because they are not held together by forces strong enough to withstand biochemical separation techniques. Once the position and the orientation of a macromolecular complex has been identified, subvolumes can be extracted and subjected to standard averaging and image classification procedures; this will provide additional means to analyze functionally relevant molecular interactions.
A single tomographic reconstruction, even of a small prokaryotic cell or an organelle of the size of a mitochondrion, is represented by a huge data set exceeding 2 gigabytes. Because the molecules under scrutiny will occur in all possible orientations, a search must scan the whole reconstructed volume over the full angular range. A brute-force approach, calculating cross-correlation functions for all possible Eulerian angles and for every single template is computationally extremely demanding. Scanning a 512 × 512 × 512 pixel volume with a single template and a 5° angular increment would result in approximately 2,000 days of computation time on a single SGI R10000 processor.
Therefore, we have developed and explored a two-step approach. First, we use a curvature-dependent anisotropic diffusion process, MCM, yielding subvolumes that contain particles in the size range of interest. This procedure has been applied to real and simulated data. Although the method is not error-free, in particular when particles are in close contact with each other, it is sufficiently reliable, especially because the hits that do not correspond to a particle are, most likely, eliminated in the subsequent particle identification step. In the second step, the content of the subvolumes determined by MCM is compared with several templates by cross-correlation, yielding a set of peaks, the height of which is a measure of similarity to the templates. The limits for particle identification were investigated by analyzing the detection behavior for simulated volumes at different resolutions. A resolution of 4 nm turned out to be sufficient to distinguish macromolecular complexes with a similar shape and geometry, but differing in their dimensions as do the 20S proteasome and GroEL. In this case, the differences of low-frequency components result in a higher detection efficiency at 8-nm resolution than at 2 nm, and therefore make an identification easier at a low resolution. A tomographic reconstruction and a template with a resolution better than 4 nm are required, however, for discriminating particles as similar as the group I chaperonin GroEL and the group II chaperonin thermosome. Beyond this resolution, the detection results are very satisfactory and high detection reliability is achieved.
Nevertheless, the question remains as to the extent that this study and the promising results can be transferred to real tomographic volumes of whole cells. Several problems will arise when proceeding from relatively thin molecular specimens to several 100 nm thick, densely packed cells, or organelles. Considering inelastic scattering, the number of electrons being detected is proportional to e-d/Λ (d = thickness of specimen, Λ = mean free path). Additionally, the concentration of macromolecules in the cytoplasm of bacteria is assumed to be 0.3–0.4 g/ml (31), thus reducing the detection probability compared with molecular specimens in physiologic buffer. Plural scattering and energy transfer from the high-voltage electron beam to the sample must be taken into account. Balancing the SNR and the effects of radiation damage will be of major importance for the identification of molecules in vivo and finally will determine whether identification is possible.
The computational difficulty of detecting and identifying molecules is further increased if they exist in more than one functional state. Many molecular machines undergo large-scale conformational changes as they proceed through their functional states. The thermosome, for example, alternates between an open, substrate-acceptor state and a closed, folding-active state (20, 26). If the mass movement is quite small, it may be difficult to distinguish between the two conformers. On the other hand, if it turns out to be feasible to discriminate between the two conformers by means of appropriate templates, this opens up exciting possibilities to monitor their activity in situ.
Different groups, including ours, are setting up high-end tomographic systems, and reconstructions with improved resolution will be available soon. Despite the aforementioned difficulties, we expect that a reliable identification of single molecules in frozen-hydrated cells will become feasible at a resolution better than 4 nm, sometimes even at lower resolutions. Thus, cellular electron tomography, in conjunction with the detection and identification techniques described in this paper, will bridge the gap between structural biology and cell biology.
Supplementary Material
Acknowledgments
We thank R. Grimm and M. Nitsch for providing electron-tomographic data, as well as the Rechenzentrum Garching for the use of the Cray T3E in Garching. We are grateful to R. Glaeser for carefully reading the manuscript as well as for useful discussions. J.B. was supported by European Union Grant ERBB104CT960099, A.S.F. was supported by Deutsche Forschungsgemeinschaft Grant He 1409/9–1, and S.N. was supported by Deutsche Forschungsgemeinschaft Grant SFB 266 A2.
Abbreviations
- 3D
three-dimensional
- CCC
cross-correlation coefficient
- MCM
mean-curvature motion
- SNR
signal-to-noise ratio
Footnotes
This paper was submitted directly (Track II) to the PNAS office.
Article published online before print: Proc. Natl. Acad. Sci. USA, 10.1073/pnas.230282097.
Article and publication date are at www.pnas.org/cgi/doi/10.1073/pnas.230282097
References
- 1.Hart R G. Science. 1968;159:1464–1467. doi: 10.1126/science.159.3822.1464. [DOI] [PubMed] [Google Scholar]
- 2.Koster A J, Grimm R, Typke D, Hegerl R, Stoschek A, Walz J, Baumeister W. J Struct Biol. 1997;120:276–308. doi: 10.1006/jsbi.1997.3933. [DOI] [PubMed] [Google Scholar]
- 3.Baumeister W, Grimm R, Walz J. Trends Cell Biol. 1999;9:81–85. doi: 10.1016/s0962-8924(98)01423-8. [DOI] [PubMed] [Google Scholar]
- 4.Dubochet J, Adrian M, Chang J, Homo J C, Lepault J, McDowall A C, Schulz P. Q Rev Biophys. 1988;21:129–228. doi: 10.1017/s0033583500004297. [DOI] [PubMed] [Google Scholar]
- 5.Michel M, Hillmann T, Muller M. J Microsc (Oxford) 1991;163:3–18. [Google Scholar]
- 6.Dierksen K, Typke D, Hegerl R, Koster A J, Baumeister W. Ultramicroscopy. 1992;40:71–87. [Google Scholar]
- 7.Dierksen K, Typke D, Hegerl R, Baumeister W. Ultramicroscopy. 1993;49:109–120. [Google Scholar]
- 8.Koster A J, Chen H, Sedat J W, Agard D A. Ultramicroscopy. 1992;46:207–227. doi: 10.1016/0304-3991(92)90016-d. [DOI] [PubMed] [Google Scholar]
- 9.Braunfeld M B, Koster A J, Sedat J W, Agard D A. J Microsc (Oxford) 1994;174:75–84. doi: 10.1111/j.1365-2818.1994.tb03451.x. [DOI] [PubMed] [Google Scholar]
- 10.Grimm R, Singh H, Rachel R, Typke D, Zillig W, Baumeister W. Biophys J. 1998;74:1031–1042. doi: 10.1016/S0006-3495(98)74028-7. [DOI] [PMC free article] [PubMed] [Google Scholar]
- 11.Nicastro D, Frangakis A S, Typke D, Baumeister W. J Struct Biol. 2000;129:48–56. doi: 10.1006/jsbi.1999.4204. [DOI] [PubMed] [Google Scholar]
- 12.Stoschek A, Hegerl R. J Struct Biol. 1998;120:257–265. doi: 10.1006/jsbi.1997.3925. [DOI] [PubMed] [Google Scholar]
- 13.Frangakis A S, Hegerl R. Lect Notes Comput Sci Scale Space Theories Comput Vis. 1999;1682:386–397. [Google Scholar]
- 14.Alvarez L, Guichard F, Lions P L, Morel J M. Arch Rational Mech Anal. 1993;123:199–257. [Google Scholar]
- 15.Hoppe W, Hegerl R. In: Three-Dimensional Structure Determination by Electron Microscopy. Hawkes P W, editor. Heidelberg: Springer; 1980. pp. 127–186. [Google Scholar]
- 16.Frank J. Electron Tomography. New York: Plenum; 1992. [Google Scholar]
- 17.Frank J. Three-Dimensional Electron Microscopy of Macromolecular Assemblies. San Diego: Academic; 1996. [Google Scholar]
- 18.Groll M, Dietzel L, Lowe J, Stock D, Bochtler M, Bartunik H D, Huber R. Nature (London) 1997;386:463–471. doi: 10.1038/386463a0. [DOI] [PubMed] [Google Scholar]
- 19.Boisvert D C, Wang J, Otwinowski Z, Horwich A L, Sigler P B. Nat Struct Biol. 1996;3:170–174. doi: 10.1038/nsb0296-170. [DOI] [PubMed] [Google Scholar]
- 20.Nitsch M, Walz J, Typke D, Klumpp M, Essen L O, Baumeister W. Nat Struct Biol. 1998;5:855–857. doi: 10.1038/2296. [DOI] [PubMed] [Google Scholar]
- 21.Hegerl R. J Struct Biol. 1996;116:30–34. doi: 10.1006/jsbi.1996.0006. [DOI] [PubMed] [Google Scholar]
- 22.Nitsch M, Klumpp M, Lupas A, Baumeister W. J Mol Biol. 1997;267:142–149. doi: 10.1006/jmbi.1996.0849. [DOI] [PubMed] [Google Scholar]
- 23.Waldmann T, Nitsch M, Klumpp M, Baumeister W. FEBS Lett. 1995;376:67–73. doi: 10.1016/0014-5793(95)01248-8. [DOI] [PubMed] [Google Scholar]
- 24.Walz J, Erdmann A, Kania M, Typke D, Koster A J, Baumeister W. J Struct Biol. 1998;121:19–29. doi: 10.1006/jsbi.1998.3958. [DOI] [PubMed] [Google Scholar]
- 25.Saxton W O, Baumeister W, Hahn M. Ultramicroscopy. 1984;13:57–70. doi: 10.1016/0304-3991(84)90057-3. [DOI] [PubMed] [Google Scholar]
- 26.Gutsche I, Holzinger J, Röβle M, Heumann H, Baumeister W, May R P. Curr Biol. 2000;10:405–408. doi: 10.1016/s0960-9822(00)00421-8. [DOI] [PubMed] [Google Scholar]
- 27.Russ J C. The Image Processing Handbook. Boca Raton, FL: CRC; 1995. [Google Scholar]
- 28.Sethian J A. Commun Math Phys. 1985;101:487–499. [Google Scholar]
- 29.Grayson M W. J Differ Geometry. 1987;26:285–314. [Google Scholar]
- 30.Papoulis A. Probability, Random Variables, and Stochastic Processes. New York: McGraw–Hill; 1991. [Google Scholar]
- 31.Zimmerman S B, Trach S O. J Mol Biol. 1991;222:599–620. doi: 10.1016/0022-2836(91)90499-v. [DOI] [PubMed] [Google Scholar]
Associated Data
This section collects any data citations, data availability statements, or supplementary materials included in this article.


