Abstract
Mice lacking DNA topoisomerase 3β are predisposed to a shortened lifespan, infertility, and lesions in multiple organs resulting from inflammatory responses. Examination of the immune system of 6- and 52-week-old top3β−/− mice revealed no significant aberrations in their central and peripheral tolerance or in T lymphocyte activation. However, the older but not the younger cohort shows a high incidence of serum autoantibodies relative to their TOP3β+/+ age-mates. The mutant mice also show an increase in numerical aberrations of chromosomes in splenocytes and bone marrow cells, as well as an increase in apoptotic cells in the thymus. Thus, it appears plausible that the inflammatory lesions in top3β−/− mice are caused by the development of autoimmunity as they age: Chromosomal abnormalities in top3β−/− mice might lead to a persistent increase in apoptotic cells, which might in turn lead to the progression of autoimmunity.
Keywords: aneuploidy, knockout mice, genome instability, systemic inflammation, shortened lifespan
The type IA subfamily of DNA topoisomerases catalyze the transport of one DNA strand through another by an “enzyme-bridging” mechanism (1–4). In this reaction, an enzyme molecule first cleaves a DNA strand and bridges the resulting DNA ends by binding covalently to one and noncovalently to the other. A gate in the scissile DNA strand is then opened, by relative movements of the protein domains bound to the DNA ends, for the passage of another DNA strand. Finally, the enzyme rejoins the broken DNA strand and resets itself for the next reaction cycle (5). All living organisms examined to date possess at least one type IA DNA topoisomerase (1–3), and the presence of a type IA enzyme in mitochondria has also been shown (6). The ubiquity of the type IA DNA topoisomerases presumably reflects their indispensable role in DNA metabolism. Genetic studies in yeasts and Escherichia coli strongly support this notion (7–12), and studies of extragenic suppressors of yeast and E. coli type IA DNA topoisomerase mutants in particular, suggest that the essentiality of these enzymes is related to their role in the resolution of an intermediate or intermediates in a homologous recombination pathway (13–17; for reviews, see refs. 2 and 18–20): If such structures are not properly resolved, damage to DNA or missegregation of chromosomes may ensue. Among the known suppressor genes, those encoding DNA helicases of the RecQ family have attracted much attention, following the identification of Bloom and Werner syndrome genes BLM and WRN as members of the RECQ family (21, 22). A third human RECQ homologue, REQL4, has also been implicated in a subset of Rothmund–Thomson syndrome (23, 24). All these syndromes are characterized by genome instability and predisposition to different forms of cancer (25, 26), and Werner and Rothmund–Thomson syndromes also exhibit symptoms of premature aging (26). In the budding yeast, DNA topoisomerase 3 has been shown to physically interact with the RecQ helicase Sgs1 (13, 15, 27–29). Interestingly, the Blm protein has also been found to physically interact with human DNA topoisomerase 3α (Top3α) (30, 31), one of the two human type IA enzymes.
The link between the type IA DNA topoisomerases and human diseases resulting from defective RecQ helicases prompted us to embark on genetic studies of the type IA DNA topoisomerases in the mouse model. Deletion of the mouse TOP3α gene encoding Top3α leads to embryonic death around the time of implantation (32). By contrast, mice lacking Top3β develop to maturity with no apparent defects. There is a progressive decrease in the fecundity of top3β−/− mutant mice, however, over time and through successive generations (33). In addition, the top3β−/− mice also have an average lifespan about one-half as long as their TOP3β+/+ or top3β+/− littermates (34). This early death appears to correlate with inflammation in multiple organs, which increases in severity as the mutant animals age (34).
The early embryonic lethality of top3α−/− mice makes it difficult to study the molecular consequences of Top3α deficiency. Nevertheless, this phenotype is consistent with an important role of the type IA enzyme in chromosome untanglement and hence cell viability. The phenotype of top3β−/− mice is more puzzling, and the link between missing an enzyme catalyzing DNA strand passage and the age-dependent development of inflammatory responses is unclear. We have therefore examined the immune system of age-matched top3β−/− and TOP3β+/+ mice. Although peripheral T cell subsets and T cell activation appear normal, the mutant animals appear to develop autoimmunity as they age. Relative to 1-year-old TOP3β+/+ mice, 1-year-old top3β−/− animals show a high incidence of an elevated level of circulating autoantibodies, as well as a higher abundance of apoptotic cells in the thymus. These results suggest that incomplete resolution of interchromosomal DNA structures owing to Top3β inactivation may lead to the development of autoimmunity, possibly triggered by a persistent increase in apoptotic cell death.
Results
Functionality of the Immune System of top3β−/− Mice.
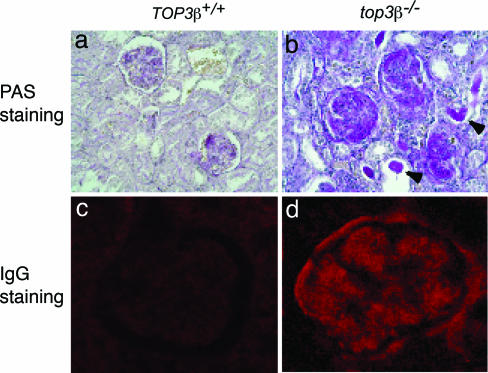
As previously reported, top3β−/− mice often develop lesions of progressive severity in various organs, including ulcerative dermatitis, enlargement of the spleen and lymph nodes, hyperplasia of pancreatic islet tissues, glomerulonephritis, and infiltration of lymphocytic cells in the skin, lungs, salivary glands, pancreas, spleen, kidneys, and stomach (34). An example illustrating the deposition of immune complexes in the renal glomeruli of a top3β−/− mouse that died at 12 months of age is depicted in Fig. 1. Kidney sections stained with periodic acid/Schiff, or with antibodies against IgG, showed prominent staining of the glomeruli (Fig. 1 b and d). Similar staining patterns were also seen in diseased top3β−/− mice (data not shown), but no significant staining was seen in sections of age-matched TOP3β+/+ mice (Fig. 1 a and c). In a comparison of five TOP3β+/+ or top3β+/− and five top3β−/− mice ranging from 16 to 25 months of age, serum blood urea nitrogen (BUN) was found to be significantly increased in the top3β−/− group (20.3 mg/dl vs. 29.8 mg/dl; P = 0.039), suggesting that kidney function is impaired in the context of Top3β deficiency.
Fig. 1.
Immunocomplexes in the glomeruli of top3β−/− mice. (a and b) Periodic acid/Schiff (PAS) and hematoxylin staining of kidney sections at ×400 magnification in TOP3β+/+ and top3β−/− animals reveals significant amounts of magenta-colored protein deposits in the latter (b), but not the former (a). Proteinaceous infiltrates, two of which are marked by arrowheads in b, are often observed in the renal tubules of the mutant animals. (c and d) Two higher magnification (×1,000) photomicrographs of kidney sections stained with fluorescence-labeled rabbit anti-mouse IgG antibodies. Background and intense fluorescence were seen, respectively, in a glomerulus of TOP3β+/+ (c) and top3β−/− (d) mice.
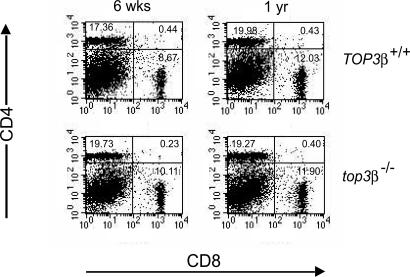
The lesions described above for top3β−/− mice are suggestive of a systemic inflammatory reaction (34), which in turn raises the possibility that the mutant mice might be prone to an inherent or age-dependent immune system dysfunction. Cohorts of top3β−/− and TOP3β+/+ mice, 6 weeks and 12 months of age and with no sign of disease, were therefore examined for plausible aberrations in central tolerance, peripheral tolerance, or lymphocyte activation. In one experiment, splenocytes harvested from trios of each age group were stained with differently tagged CD4 and CD8 antibodies and analyzed by fluorescence-activated cell sorting. The results are depicted in Fig. 2. In each case, three sets of cell-sorting results were combined because there were no significant differences among individual sets. Normal populations of immature T cells expressing both CD4 and CD8, and mature T cells expressing either CD4 or CD8, were observed in both top3β−/− and their TOP3β+/+ age-mates, indicating that T cell maturation is normal in the mutant animals. Similar experiments with cells harvested from thymus and lymph nodes also showed largely normal populations of T cells in all cohorts; no significant difference in the percentages of CD4+, CD8+, CD25+, CD44+, or CD69+ cells was observed between samples from top3β−/− and TOP3β+/+ mice of either age group, and no significant difference in the numbers of CD4+ or CD8+ splenic T cells was found (data not shown). Sorting for CD4+ T cells expressing several variable domains of the β polypeptide of the αβ T cell receptors, using specific antibodies against Vβ3, Vβ5, Vβ11, or Vβ17, also revealed no significant difference between samples from age-matched top3β−/− and TOP3β+/+ mice (data not shown).
Fig. 2.
Unchanged proportion of CD4+ and CD8+ T cells in top3β−/− mice. Splenocytes of groups of TOP3β+/+ and top3β−/− mice 6 weeks and 1 year of age were first treated with FITC-tagged antibodies against CD4 and PE-tagged antibodies against CD8, and then analyzed by flow cytometry. For each group, data from sorting of cells from three mice were combined and displayed. The calculated percentage of each cell population is shown in the corresponding quadrant of the figure. All mice in this experiment exhibited no apparent sign of disease.
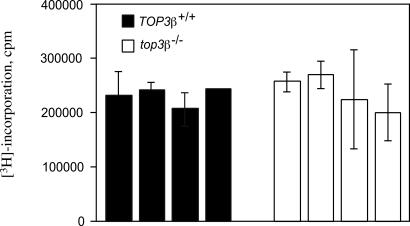
Activation of T cell proliferation by antibody binding to the CD3 surface receptor also appeared normal in the mutant mice. In this experiment, splenocytes were first prepared from individual 6- and 52-week-old top3β−/− and TOP3β+/+ mice and assayed for T cell contents by fluorescence-activated cell sorting. Aliquots of the preparations were then incubated with different concentrations of antibodies specific to CD3, and [3H]thymidine was added 1 to 3 days later to pulse-label proliferating cells. In Fig. 3, the levels of [3H] incorporation 2 days after the addition of 0.1 μg/ml of CD3 antibody to cells from 6-week-old top3β−/− and TOP3β+/+ mice are depicted. No difference between any of the four pairs of top3β−/− and TOP3β+/+ samples is evident. Similar analysis of all other pairs of samples from 6- and 52-week-old age-mates that had been treated with different concentrations of anti-CD3 antibodies also showed no significant difference after either 1, 2, or 3 days of incubation (data not shown).
Fig. 3.
An example of T cell proliferation on stimulation with anti-CD3 antibodies. In this experiment, four 6-week-old TOP3β+/+ mice and the same number of their top3β−/− age-mates were used. Growth of T cells purified from the spleens of individual animals was stimulated by the addition of anti-CD3 antibodies to a final concentration of 0.1 μg/ml, and [3H]thymidine was added 48 h later to pulse-label replicating DNA. Data represent the average of triplicate cell samples from each of the four individual TOP3β+/+ and top3β−/− mice, and error bars represent standard deviations of the samples.
In a parallel series of experiments, supernatants were collected each day from triplicate samples incubated with 0, 0.01, 0.1, or 1 μg/ml anti-CD3 antibodies, and the amounts of the cytokines IL-2, IL-4, and IFN-γ in these supernatants were determined. The results indicate that comparable amounts of the cytokines are secreted by top3β−/− and TOP3β+/+ T cells, and that the kinetics of cytokine production correlates well with the proliferation rate of the cells (data not shown).
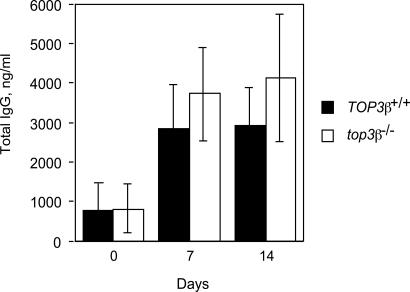
B cell-mediated production of specific antibodies on exposure to an antigen also appears normal in the mutant mice. After i.p. injection of 2,4,6,-trinitrophenol (TNP) conjugated to keyhole limpet hemocyanin (KLH), comparable increases in the total amounts of TNP-specific immunoglobulins were seen, over a 2-week period, in sera of 6-week-old top3β−/− and TOP3β+/+ mice (Fig. 4).
Fig. 4.
Total Ig level in sera of TOP3β+/+ and top3β−/− mice collected 0, 7, or 14 days after immunization. Individual mice were immunized with TNP-conjugated KLH on day 0. Each bar represents the average value from three individual TOP3β+/+ (filled bars) or three top3β−/− (empty bars) mice; error bars represent standard deviations of the samples.
Elevated Circulating Autoantibodies in top3β−/− Mice.
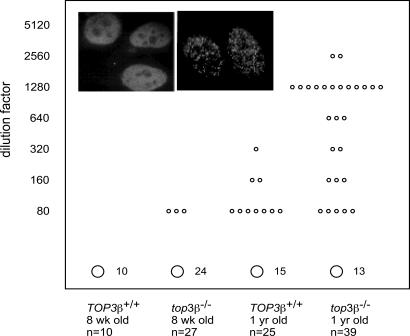
The results described in the previous sections indicate that mature lymphocyte populations appear normal in top3β−/− mice. To test whether the observed systemic inflammatory response in mutant mice might reflect the development of autoimmunity, we examined the level of circulating autoantibodies in 1-year-old top3β−/− and TOP3β+/+ mice. Sera from both groups of mice with no evidence of disease were serially diluted, and the diluted samples were incubated with HEp-2 cells. Autoantibody binding to HEp-2 cells was then examined after staining the treated cells with FITC-conjugated anti-mouse antibodies. As shown in Fig. 5, the incidence of elevated autoantibody titers is much higher in the mutant animals. Whereas only 1 of 15 1-year-old TOP3β+/+ animals examined showed a detectable level of autoantibodies at a dilution of 1:320, sera from 14 of 39 mutant animals tested positive even at four to eight times higher dilutions. There is also a significant difference in the staining patterns of sera from the two groups. All nine serum samples from TOP3β+/+ animals that showed detectable staining of HEp-2 cells, at a minimal dilution of 1:80, displayed a diffuse nuclear staining pattern (Fig. 5 Left Inset). In contrast, more than half of the positive sera from top3β−/− mice showed a speckled pattern of intranuclear staining (Fig. 5 Right Inset).
Fig. 5.
Autoantibody levels in sera of TOP3β+/+ and top3β−/− mice. Blood samples were collected from four groups of mice with no overt sign of disease: 8-week-old TOP3β+/+, 8-week-old top3β−/−, 1-year-old TOP3β+/+, and 1-year-old top3β−/−, with the total number (n) of animals in each group specified under each datum column. 2-fold serial dilutions of sera were incubated with HEp-2 cells, and autoantibodies bound to the indicator cells were visualized at a magnification of ×1,000 in a fluorescence microscope by the binding of fluorochrome-conjugated anti-mouse Fcγ antibodies. The signal from undiluted sera from the 8-week-old TOP3β+/+ group was taken as the background level, and the maximal dilution, in the range from 80 to 5,120, which gave a visual indication of a higher level of autoantibodies, was recorded for each serum and marked as a small circle in the figure. The total number of serum samples of each group that showed background levels of autoantibodies is specified next to a large circle at the bottom of each column. (Insets) Two distinct patterns of staining of HEp-2 cell nuclei by autoantibodies in the sera tested: A diffuse signal (Left Inset) or a speckled pattern (Right Inset). Fluorescence-labeled rabbit antibodies against murine IgG were used in this experiment.
Chromosome Loss and Apoptosis in Somatic Tissues of top3β−/− Mice.
The prior results suggest a plausible causal relation between the absence of DNA top3β and the manifestation of an autoimmune response, which in turn led us to consider mechanisms that could link an enzyme participating in DNA strand passage to autoimmunity. There is no indication that autoimmunity in top3β−/− mice might be related to defective expression of the Fas protein, which is responsible for the autoimmune phenotype of lpr−/− mice (35). Fluorescence-activated sorting of thymocytes, splenocytes, and lymphocytes using antibodies against Fas showed that the number of Fas-expressing cells were similar in top3β−/− and TOP3β+/+ 6-week or 1-year-old mice (data not shown).
We next considered whether the induction of autoimmunity in top3β−/− mice might be related to the effect of Top3β on cell viability. It is known that the viability of yeast cells is severely compromised on inactivation of DNA topoisomerase 3, a homologue of mammalian Top3α and Top3β and the sole type IA DNA topoisomerase in yeasts (7–11). Whereas murine cells lacking Top3β are apparently viable (33), a high incidence of abnormal chromosome numbers in spermatocytes of top3β−/− mice, especially aneuploidy, was observed (33). These aberrations in chromosome number are most likely related to missegregation of chromosomes connected by improperly resolved structures (33). Because chromosome missegregation is likely to occur in mitotic as well as meiotic cells lacking Top3β, it seemed plausible that it might lead to a high incidence of apoptotic cell death in somatic tissues of top3β−/− mice, which could in turn trigger an autoimmune response in the mutant animals (for discussions on a plausible role of apoptosis in autoimmunity, see refs. 36–40).
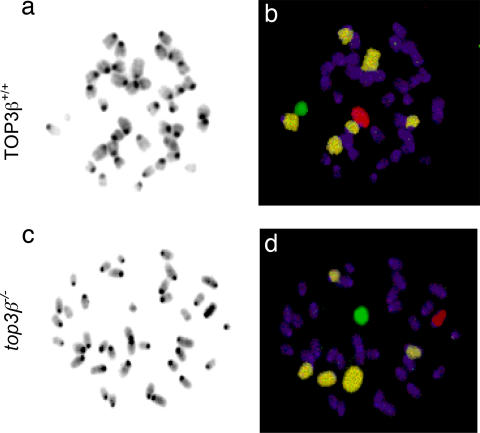
To examine whether aberrations in chromosome numbers occur in somatic cells, metaphases in Colcemid-treated splenocytes and bone marrow cells of 3- to 6-month-old top3β−/− and TOP3β+/+ mice were examined by chromosome painting. Using fluorescent probes that specifically detect the sex chromosomes and autosomes 1, 3, and 16, a higher incidence of numerical aberrations was indeed observed in metaphases from top3β−/− mice relative to the TOP3β+/+ controls. Whereas no numerical abnormality was found among 100 sets of TOP3β+/+ meta phases, among 150 sets of top3β−/− metaphases, 4 (2.7%) were found to have lost one of the five painted chromosomes and 2 (1.3%) were found to have gained an extra painted chromosome. Two representative sets of micrographs showing the metaphases of a TOP3β+/+ and a top3β−/− bone marrow cell are illustrated in Fig. 6.
Fig. 6.
Aberrations in chromosome numbers in somatic top3β−/− cells. Two sets of bone marrow cell metaphases, one from a TOP3β+/+ and the other from a top3β−/− animal, are illustrated. Metaphase spreads were hybridized with a mixture of fluorescence-labeled probes to mark the autosomes 1, 3, and 16 in one color and the sex chromosomes in different colors; all chromosomes were further stained with DAPI before viewing in a fluorescence microscope. (a and c) The DAPI-stained chromosomes were more easily visualized as black-and-white images. In the examples shown, the TOP3β+/+ cell contained the full complement of 20 pairs of chromosomes, but one of the painted autosomes is missing in the top3β−/− bone marrow cell. (b and d) Separate fluorescent images of each set were merged to show the Cy5-labeled autosomes 1, 3, and 16 in pale yellow; the Cy3-labeled X chromosome in red; the FITC-labeled Y chromosome in green; and all of the other chromosomes in purple.
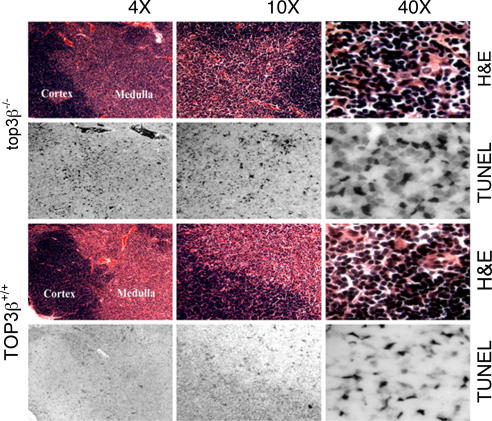
To determine whether there is an increase in the incidence of apoptosis in tissues of top3β−/− mice relative to their TOP3β+/+ age-mates, thymus sections of 10- to 12-month-old mice were examined by terminal deoxynucleotidyl transferase-mediated labeling of fragmented DNA (41). As shown in Fig. 7, there is a significantly higher incidence of apoptotic cell death in the top3β−/− samples relative to the TOP3β+/+ controls. When viewed at a higher magnification, an abundance of cells with a condensed nuclear morphology, which is typical of apoptotic cells, was also evident in thymus sections of the top3β−/− mice, but not in the TOP3β+/+ samples.
Fig. 7.
Increased apoptotic cells in the thymus of top3β−/− compared to TOP3β+/+ mice. Presence of apoptotic cells was detected by TUNEL staining. H&E stains of parallel sections are shown for both TOP3β+/+ and top3β−/− thymi, with the darker staining thymic cortex and lighter medulla indicated.
Discussion
For young top3β−/− mice 6 weeks of age, our experiments uncovered no defect in their immune system. Normal populations of immature and mature T cells are present. Antigen stimulation of T cell proliferation and cytokine secretion appear normal, and T cell-dependent B cell responses to immunization are also indistinguishable from those in the age-matched TOP3β+/+ animals. To a large extent, the lymphocyte lineage of top3β−/− mice postmaturity appears normal, as revealed by experiments with healthy 1-year-old mutant and TOP3β+/+ animals. The presence of comparable populations of several αβ T cell receptors examined in wild-type and mutant mice is also consistent with the notion that gene rearrangements in the T cell lineage are not substantially affected by the absence of Top3β.
One important immunologic characteristic of the older group of top3β−/− mice uncovered in this work is the prevalence of animals with a high titer of autoantibodies against nuclear antigens. Among the 1-year-old animal studies, the majority of the top3β−/− mice showed much higher titers of circulating autoantibodies relative to their TOP3β+/+ age-mates (Fig. 5). We suspect that this high serum level of autoantibodies is directly linked to the lack of Top3β. The absence of Top3β greatly increases numerical aberrations in chromosomes in both germ-line (33) and somatic cells presumably because of a key role of the enzyme in the resolution of chromosome pairs that have become connected during recombinational repair. These chromosomal abnormalities could, in turn, lead to apoptotic cell death (42, 43). There is increasing evidence that exposure to a high level of apoptotic cells can facilitate autoantibody production and glomerular disease development in mice (44). Mutations in the C1q, Axl, Mer, and Tyro3 genes, which affect clearance of apoptotic cells, have been shown to elevate autoantibody levels (45–47). In the case of mice defective in C1q, the increase in autoantibodies correlates well with the development of glomerular disease (46). Also, i.v. or i.p. injection of apoptotic cells has been observed to elevate autoantibody levels (48, 49). The increase in apoptotic cells, owing to the absence of Top3β, may lead to the development of autoimmunity (36, 39, 40, 44, 50). It is also interesting that a speckled pattern of nuclear staining of HEp-2 cells was observed with ≈50% of the positive sera samples from top3β−/− mice compared to 0% of those from TOP3β+/+ mice. Such a speckled staining pattern had previously been noted for autoantibodies induced by apoptotic cells and is also associated with autoimmune disease in humans (48, 49).
Because of the known interaction between the type IA DNA topoisomerases and the RecQ family helicases, it is of interest to note reports of an increase in autoantibody titers in a number of Werner syndrome patients relative to normal individuals of the same age (51–53). Thus, the shortened lifespan and early development of high titers of autoantibodies in top3β−/− mice are also two characteristics of the Werner syndrome. It should be emphasized, however, that these common characteristics do not necessarily imply a direct interaction between Top3β and Werner syndrome helicase; rather, they are more likely to reflect roles of these enzymes in the repair of DNA damage and the maintenance of genome stability. To date there has been no indication that the WRN helicase directly interacts with either Top3α or Top3β.
In conclusion, the results reported here indicate that B and T lymphocytes of mice lacking DNA Top3β are largely normal, and the development of inflammatory responses in these animals, most likely the cause of their shortened life span, might be related to an increase in apoptotic cell death resulting from chromosomal abnormalities. These and earlier studies of various type IA DNA topoisomerases (1–3) have firmly established the importance of these ubiquitous enzymes in the maintenance of genome stability. The manifestation of mouse Top3β deficiency in autoimmunity and aging presents fascinating new arenas in the study of the functions of DNA topoisomerases in complex organisms.
Materials and Methods
Flow Cytometry.
Two groups of apparently healthy TOP3β+/+ and top3β−/− mice 6 weeks and 12 months of age were used. Cells from thymus, spleen, and lymph nodes were collected from three animals in each group, and individual samples were washed with PBS containing 1% BSA and 0.01% sodium azide and resuspended in the same buffer. The presence of various lymphocyte surface markers on cells from each individual mouse was quantitated by fluorescence-activated cell sorting by using a Becton Dickinson (San Jose, CA) FACSCalibur flow cytometer equipped with CellQuest (BD Biosciences, San Jose, CA) software. Various fluorochrome-conjugated antibodies and isotype controls (BD Biosciences PharMingen, San Diego, CA) were used to specifically stain one or a pair of the markers.
T Cell Proliferation Responses and Cytokine Production.
Thymus, spleen, and lymph node cells from individual mice described earlier were suspended in the RPMI plating medium (Gibco/BRL, Gaithersburg, MD) supplemented with 10% FBS, 2 mM l-glutamine, 0.01 M Hepes, and 6 × 10⁻⁵ M 2-mercaptoethanol. To monitor T cell proliferation on stimulation by the binding of anti-CD3 antibodies, ≈2 × 10⁵ T cells in 100 μl of the medium were plated in each well of 96-well microtiter plates, and anti-CD3 antibodies were added to triplicate sets of wells to a concentration of 0, 0.01, 0.1, or 1 μg/ml. The plates were incubated for 1, 2, or 3 days, and 1 μCi of [3H]thymidine (New England Nuclear Research Products, Boston, MA) was then added to each well. Incubation was continued for 6 h to pulse-label the replicating DNA, and the plates containing the labeled cells were then stored in a −20°C freezer until processing. Cells in individual wells of each microtiter plate were washed with PBS and transferred to a nylon membrane, and [3H] incorporation in the cells was determined by counting in a 96-well format scintillation counter (Wallace, Turku, Finland). Results from triplicate samples were averaged for each datum point. For determination of cytokine secretion by cells treated with anti-CD3 antibodies, supernatants were manually removed from triplicate rows of sample wells on each day, following the addition of 0, 0.01, 0.1, or 1 μg/ml anti-CD3 antibodies to the wells. Concentrations of IL-2, IL-4, and IFN-γ were quantified by ELISA.
Antibody Production in Response to Immunization.
Each trio of TOP3β+/+ and top3β−/− mice 6 weeks of age was immunized by i.p. injection of 50 μg of TNP-conjugated KLH (TNP-KLH; BD Biosciences PharMingen) in incomplete Freund's adjuvant. Serum samples were collected retroorbitally from the immunized animals 0, 7, and 14 days postinjection, and TNP-specific Ig titers in the serum samples were quantified by ELISA.
Visualization of Individual Metaphase Chromosomes in Mitotic Cells.
TOP3β+/+ and top3β−/− mice 3 to 6 months of age were killed and their spleens and femurs were harvested. Splenocytes and bone marrow cells were separately placed in MEM (Gibco/BRL) containing 0.5 μg/ml Colcemid and incubated at 37°C for 30 to 60 min. Preparation of metaphase spreads and in situ hybridization with fluorochrome-tagged probes were carried out as described previously (33).
Histochemical and Immunohistochemical Examination of Tissues.
Tissues fixed in 10% neutralized formalin and embedded in paraffin were cut into 7-μm sections and stained with H&E or periodic acid/Schiff and hematoxylin following standard protocols. Detection of IgG in paraffin-embedded kidney sections was done by first soaking the sections, for 30 min at 37°C, in an antibody diluent containing 10% goat serum, 3% BSA, and 0.05% Triton X-100 in PBS. The sections were then incubated for 2 h at 37°C in the same buffer plus 1:500 dilution of Cy3-conjugated goat anti-mouse IgG antibodies (Jackson ImmunoResearch Laboratories, West Grove, PA). The stained sections were successively washed in PBS, PBS plus 0.1% Triton X-100, and again in PBS; briefly air-dried; and mounted for viewing in a fluorescence microscope. Images were captured at ×400 magnification. For analysis of apoptotic cells in thymus, after washing with 1− DPBS (Gibco/Invitrogen, Carlsbad, CA), thymi were fixed with tissue fixative (Streck Laboratories, La Vista, NE) and subjected to paraffin-embedded tissue sectioning. TUNEL staining was performed by using the In Situ Cell Detection-POD Kit (Roche Diagnostics, Indianapolis, IN) as per the manufacturer's instructions. The detection of horseradish peroxidase was carried out by using 3,3′-diaminobenzidine.
Measurement of BUN.
Serum BUN was measured in replicate for each mouse using a COBAS-MIRA analyzer (Roche Diagnostics). The difference in BUN between wild-type and knockout mice was analyzed with a repeated measures linear model that controlled for sex and accounted for the correlation between replicate samples within a mouse.
Detection of Autoantibodies.
HEp-2 cells (Zeus Scientific, Raritan, NJ) were used as the substrate for autoantibody detection. Blood was collected retroorbitally, and serial dilutions of sera in PBS were incubated with HEp-2 cells. FITC-conjugated anti-mouse Fcγ antibodies (Jackson ImmunoResearch Laboratories) were used for semiquantitative detection of autoantibodies bound to HEp-2 cells. Cy3-conjugated goat anti-mouse IgG antibodies (Jackson ImmunoResearch Laboratories) were also used in high-magnification imaging of autoantibody staining patterns. Sera from 8-week-old TOP3β+/+ mice were used as controls for background of IgG autoantibodies.
Acknowledgments
We thank Janet Buhlman and Alex McAdam for advice and technical assistance, Roderick Bronson for expert advice and help in pathological analysis of various tissue sections, and Dr. Gary Cline and Todd May for assistance with BUN measurement. This work was supported by National Institutes of Health Grants CA47958 and GM24544 (to J.C.W.) and AG025142 (to A.C.S.).
Footnotes
The authors declare no conflict of interest.
References
- 1.Wang JC. Annu Rev Biochem. 1996;65:635–692. doi: 10.1146/annurev.bi.65.070196.003223. [DOI] [PubMed] [Google Scholar]
- 2.Wang JC. Nat Rev Mol Cell Biol. 2002;3:430–440. doi: 10.1038/nrm831. [DOI] [PubMed] [Google Scholar]
- 3.Champoux JJ. Annu Rev Biochem. 2001;70:369–413. doi: 10.1146/annurev.biochem.70.1.369. [DOI] [PubMed] [Google Scholar]
- 4.Dekker NH, Rybenkov VV, Duguet M, Crisona NJ, Cozzarelli NR, Bensimon D, Croquette V. Proc Natl Acad Sci USA. 2002;99:12126–12131. doi: 10.1073/pnas.132378799. [DOI] [PMC free article] [PubMed] [Google Scholar]
- 5.Lima CD, Wang JC, Mondragon A. Nature. 1994;367:138–146. doi: 10.1038/367138a0. [DOI] [PubMed] [Google Scholar]
- 6.Wang Y, Lyu YL, Wang JC. Proc Natl Acad Sci USA. 2002;99:12114–12119. doi: 10.1073/pnas.192449499. [DOI] [PMC free article] [PubMed] [Google Scholar]
- 7.Wallis JW, Chrebet G, Brodsky G, Rolfe M, Rothstein R. Cell. 1989;58:409–419. doi: 10.1016/0092-8674(89)90855-6. [DOI] [PubMed] [Google Scholar]
- 8.Watt PM, Hickson ID, Borts RH, Louis EJ. Genetics. 1996;144:935–945. doi: 10.1093/genetics/144.3.935. [DOI] [PMC free article] [PubMed] [Google Scholar]
- 9.Gangloff S, de Massy B, Arthur L, Rothstein R, Fabre F. EMBO J. 1999;18:1701–1711. doi: 10.1093/emboj/18.6.1701. [DOI] [PMC free article] [PubMed] [Google Scholar]
- 10.Goodwin A, Wang SW, Toda T, Norbury C, Hickson ID. Nucleic Acids Res. 1999;27:4050–4058. doi: 10.1093/nar/27.20.4050. [DOI] [PMC free article] [PubMed] [Google Scholar]
- 11.Maftahi M, Han CS, Langston LD, Hope JC, Zigouras N, Freyer GA. Nucleic Acids Res. 1999;27:4715–4724. doi: 10.1093/nar/27.24.4715. [DOI] [PMC free article] [PubMed] [Google Scholar]
- 12.Zhu Q, Pongpech P, DiGate RJ. Proc Natl Acad Sci USA. 2001;98:9766–9771. doi: 10.1073/pnas.171579898. [DOI] [PMC free article] [PubMed] [Google Scholar]
- 13.Gangloff S, McDonald JP, Bendixen C, Arthur L, Rothstein R. Mol Cell Biol. 1994;14:8391–8398. doi: 10.1128/mcb.14.12.8391. [DOI] [PMC free article] [PubMed] [Google Scholar]
- 14.Shor E, Gangloff S, Wagner M, Weinstein J, Price G, Rothstein R. Genetics. 2002;162:647–662. doi: 10.1093/genetics/162.2.647. [DOI] [PMC free article] [PubMed] [Google Scholar]
- 15.Mullen JR, Kaliraman V, Brill SJ. Genetics. 2000;154:1101–1114. doi: 10.1093/genetics/154.3.1101. [DOI] [PMC free article] [PubMed] [Google Scholar]
- 16.Mullen JR, Nallaseth FS, Lan YQ, Slagle CE, Brill SJ. Mol Cell Biol. 2005;154:4476–4487. doi: 10.1128/MCB.25.11.4476-4487.2005. [DOI] [PMC free article] [PubMed] [Google Scholar]
- 17.Yamagata K, Kato J, Shimamoto A, Goto M, Furuichi Y, Ikeda H. Proc Natl Acad Sci USA. 1998;95:8733–8738. doi: 10.1073/pnas.95.15.8733. [DOI] [PMC free article] [PubMed] [Google Scholar]
- 18.Rothstein R, Gangloff S. Genome Res. 1995;5:421–426. doi: 10.1101/gr.5.5.421. [DOI] [PubMed] [Google Scholar]
- 19.Frei C, Gasser SM. J Cell Sci. 2000;113:2641–2646. doi: 10.1242/jcs.113.15.2641. [DOI] [PubMed] [Google Scholar]
- 20.Oakley TJ, Goodwin A, Chakraverty RK, Hickson ID. DNA Repair (Amst) 2002;1:463–482. doi: 10.1016/s1568-7864(02)00032-0. [DOI] [PubMed] [Google Scholar]
- 21.Ellis NA, Groden J, Ye TZ, Straughen J, Lennon DJ, Ciocci S, Proytcheva M, German J. Cell. 1995;83:655–666. doi: 10.1016/0092-8674(95)90105-1. [DOI] [PubMed] [Google Scholar]
- 22.Yu CE, Oshima J, Fu YH, Wijsman EM, Hisama F, Alisch R, Matthews S, Nakura J, Miki T, Ouais S, et al. Science. 1996;272:258–262. doi: 10.1126/science.272.5259.258. [DOI] [PubMed] [Google Scholar]
- 23.Kitao S, Lindor NM, Shiratori M, Furuichi Y, Shimamoto A. Genomics. 1999;61:268–276. doi: 10.1006/geno.1999.5959. [DOI] [PubMed] [Google Scholar]
- 24.Wang LL, Levy ML, Lewis RA, Chintagumpala MM, Lev D, Rogers M, Plon SE. Am J Med Genet. 2001;102:11–17. doi: 10.1002/1096-8628(20010722)102:1<11::aid-ajmg1413>3.0.co;2-a. [DOI] [PubMed] [Google Scholar]
- 25.German J. Dermatol Clin. 1995;13:7–18. [PubMed] [Google Scholar]
- 26.van Brabant AJ, Stan R, Ellis NA. Annu Rev Genomics Hum Genet. 2000;1:409–459. doi: 10.1146/annurev.genom.1.1.409. [DOI] [PubMed] [Google Scholar]
- 27.Bennett RJ, Noirot-Gros MF, Wang JC. J Biol Chem. 2000;275:26898–26905. doi: 10.1074/jbc.M003137200. [DOI] [PubMed] [Google Scholar]
- 28.Duno M, Thomsen B, Westergaard O, Krejci L, Bendixen C. Mol Gen Genet. 2000;264:89–97. doi: 10.1007/s004380000286. [DOI] [PubMed] [Google Scholar]
- 29.Fricke WM, Kaliraman V, Brill SJ. J Biol Chem. 2001;276:8848–8855. doi: 10.1074/jbc.M009719200. [DOI] [PMC free article] [PubMed] [Google Scholar]
- 30.Johnson FB, Sinclair DA, Guarente L. Cell. 1999;96:291–302. doi: 10.1016/s0092-8674(00)80567-x. [DOI] [PubMed] [Google Scholar]
- 31.Wu L, Davies SL, North PS, Goulaouic H, Riou JF, Turley H, Gatter KC, Hickson ID. J Biol Chem. 2000;275:9636–9644. doi: 10.1074/jbc.275.13.9636. [DOI] [PubMed] [Google Scholar]
- 32.Li W, Wang JC. Proc Natl Acad Sci USA. 1998;95:1010–1013. doi: 10.1073/pnas.95.3.1010. [DOI] [PMC free article] [PubMed] [Google Scholar]
- 33.Kwan KY, Moens PB, Wang JC. Proc Natl Acad Sci USA. 2003;100:2526–2531. doi: 10.1073/pnas.0437998100. [DOI] [PMC free article] [PubMed] [Google Scholar]
- 34.Kwan KY, Wang JC. Proc Natl Acad Sci USA. 2001;98:5717–5721. doi: 10.1073/pnas.101132498. [DOI] [PMC free article] [PubMed] [Google Scholar]
- 35.Takahashi T, Tanaka M, Brannan CI, Jenkins NA, Copeland NG, Suda T, Nagata S. Cell. 1994;76:969–976. doi: 10.1016/0092-8674(94)90375-1. [DOI] [PubMed] [Google Scholar]
- 36.Rosen A, Casciola-Rosen L. Nat Med. 2001;7:664–665. doi: 10.1038/89034. [DOI] [PubMed] [Google Scholar]
- 37.Rosen A, Casciola-Rosen L. Cell Death Differ. 1999;6:6–12. doi: 10.1038/sj.cdd.4400460. [DOI] [PubMed] [Google Scholar]
- 38.Mitchell DA, Pickering MC, Warren J, Fossati-Jimack L, Cortes-Hernandez J, Cook HT, Botto M, Walport MJ. J Immunol. 2002;168:2538–2543. doi: 10.4049/jimmunol.168.5.2538. [DOI] [PubMed] [Google Scholar]
- 39.Botto M, Walport MJ. Immunobiology. 2002;205:395–406. doi: 10.1078/0171-2985-00141. [DOI] [PubMed] [Google Scholar]
- 40.Savill J, Dransfield I, Gregory C, Haslett C. Nat Rev Immunol. 2002;2:965–975. doi: 10.1038/nri957. [DOI] [PubMed] [Google Scholar]
- 41.Prigent P, Blanpied C, Aten J, Hirsch F. J Immunol Methods. 1993;160:139–140. doi: 10.1016/0022-1759(93)90018-3. [DOI] [PubMed] [Google Scholar]
- 42.McFadden DE, Friedman JM. Mutat Res. 1997;396:129–140. doi: 10.1016/s0027-5107(97)00179-6. [DOI] [PubMed] [Google Scholar]
- 43.Jallepalli PV, Lengauer C. Nat Rev Cancer. 2001;1:109–117. doi: 10.1038/35101065. [DOI] [PubMed] [Google Scholar]
- 44.Fishelson Z, Attali G, Mevorach D. Mol Immunol. 2001;38:207–219. doi: 10.1016/s0161-5890(01)00055-4. [DOI] [PubMed] [Google Scholar]
- 45.Cohen PL, Caricchio R, Abraham V, Camenisch TD, Jennette JC, Roubey RA, Earp HS, Matsushima G, Reap EA. J Exp Med. 2002;196:135–140. doi: 10.1084/jem.20012094. [DOI] [PMC free article] [PubMed] [Google Scholar]
- 46.Botto M, Dell'Agnola C, Bygrave AE, Thompson EM, Cook HT, Petry F, Loos M, Pandolfi PP, Walport MJ. Nat Genet. 1998;19:56–59. doi: 10.1038/ng0598-56. [DOI] [PubMed] [Google Scholar]
- 47.Scott RS, McMahon EJ, Pop SM, Reap EA, Caricchio R, Cohen PL, Earp HS, Matsushima GK. Nature. 2001;411:207–211. doi: 10.1038/35075603. [DOI] [PubMed] [Google Scholar]
- 48.Mevorach D, Zhou JL, Song X, Elkon KB. J Exp Med. 1998;188:387–392. doi: 10.1084/jem.188.2.387. [DOI] [PMC free article] [PubMed] [Google Scholar]
- 49.Gensler TJ, Hottelet M, Zhang C, Schlossman S, Anderson P, Utz PJ. J Autoimmun. 2001;16:59–69. doi: 10.1006/jaut.2000.0464. [DOI] [PubMed] [Google Scholar]
- 50.Utz PJ, Gensler TJ, Anderson P. Arthritis Res. 2000;2:101–114. doi: 10.1186/ar75. [DOI] [PMC free article] [PubMed] [Google Scholar]
- 51.Goto M, Tanimoto K, Horiuchi Y. Arthritis Rheum. 1980;23:1274–1281. doi: 10.1002/art.1780231108. [DOI] [PubMed] [Google Scholar]
- 52.Nakao Y, Hattori T, Takatsuki K, Kuroda Y, Nakaji T, Fujiwara Y, Kishihara M, Baba Y, Fujita T. Clin Exp Immunol. 1980;42:10–19. [PMC free article] [PubMed] [Google Scholar]
- 53.Kogure A, Ohshima Y, Watanabe N, Ohba T, Miyata M, Ohara M, Nishimaki T, Kasukawa R. Clin Rheumatol. 1995;14:199–203. doi: 10.1007/BF02214944. [DOI] [PubMed] [Google Scholar]


