

Abstract
The Barcode of Life Data System (bold) is an informatics workbench aiding the acquisition, storage, analysis and publication of DNA barcode records. By assembling molecular, morphological and distributional data, it bridges a traditional bioinformatics chasm. bold is freely available to any researcher with interests in DNA barcoding. By providing specialized services, it aids the assembly of records that meet the standards needed to gain BARCODE designation in the global sequence databases. Because of its web-based delivery and flexible data security model, it is also well positioned to support projects that involve broad research alliances. This paper provides a brief introduction to the key elements of bold, discusses their functional capabilities, and concludes by examining computational resources and future prospects.
Keywords: COI, DNA barcoding, gene sequence, informatics, species identification, taxonomy
Introduction
DNA barcoding employs sequence diversity in short, standardized gene regions to aid species identification and discovery in large assemblages of life. A 648-bp region of the cytochrome c oxidase I (COI) gene forms the primary barcode sequence for members of the animal kingdom (Hebert et al. 2003a; Savolainen et al. 2005). The early goals of DNA barcoding focus on the assembly of reference libraries of barcode sequences for known species. Current results show that these libraries will be very effective in generating identifications; more than 95% of species in test assemblages of varied animal groups have been shown to possess distinctive COI sequences (Hebert et al. 2003b, 2004; Ward et al. 2005; Hajibabaei et al. 2006). Moreover, cases of incomplete resolution involve species that are closely allied. Work on groups with well-studied taxonomy also promises to reveal the levels and the nature of barcode divergences that typically separate species, aiding development of algorithms and the underlying rule sets needed for DNA barcoding to advance species discovery in taxonomically understudied groups (Hebert et al. 2004; Smith et al. 2005, 2006; Barber & Boyce 2006).
The Consortium for the Barcode of Life (CBOL) was launched in May 2004 and now includes more than 120 organizations from 45 nations. CBOL is fostering development of the international research alliances needed to build, over the next 20 years, a barcode library for all eukaryotic life. It has already initiated the first campaigns with a global sweep; they seek to deliver barcode coverage for all species of birds and fishes by 2012 (Marshall 2005). Although these two projects will generate some 0.5 million records, a comprehensive barcode library for the animal kingdom will be much larger, c. 100 million records — almost twice the current size of GenBank (52 million sequence records as of 7 March 2006). This potential volume of data makes clear the need for enterprise-scale software to support novel aspects of DNA barcoding, a realization that motivated development of the Barcode of Life Data System. Key features include the requirement for a persistent linkage between a barcode sequence and its source specimen and a secure environment that stores, organizes and queries these records, accessible to the entire biodiversity community. There is also a need to establish and enforce data standards. To meet these challenges, CBOL initiated dialogue with the major genomics repositories [e.g. National Center for Biotechnology Information (NCBI)], biodiversity organizations [e.g. Global Biodiversity Informaion Facility (GBIF)], major barcoding centres and the multiple taxonomic communities. These joint consultations have now led to the establishment of formal guidelines that must be met for records to gain barcode designation. Gene sequences must derive from a designated gene region, they must meet quality standards and they must derive from a specimen whose taxonomic assignment can be reviewed, ordinarily through linkage to a specimen that is held in a major collection (Hanner et al. 2007).
The Barcode of Life Data System (bold) —http://www.barcodinglife.org— provides an integrated bioinformatics platform that supports all phases of the analytical pathway from specimen collection to tightly validated barcode library. First, it is a repository for the specimen and sequence records that form the basic data unit of all barcode studies. Second, it is a workbench that aids the management, quality assurance and analysis of barcode data. Third, it provides a vehicle for collaboration across geographically dispersed research communities by coupling flexible security and data entry features with web-based delivery. In the remainder of this article, we examine the key elements of bold and detail the computational resources available to support it, before concluding with a brief consideration of system expansibility.
Overview
bold was initially developed as an informatics workbench for a single, high-volume DNA barcode facility (Hajibabaei et al. 2005). It has evolved into a resource for the DNA barcoding community, as evidenced by its adoption for the first major barcode campaigns (birds, fishes, Lepidoptera). It has, as well, been selected by the Canadian Barcode of Life Network (http://www.bolnet.ca) for its campaign to barcode all eukaryotic life in that nation. Although bold aids the assembly of barcode data and maintains these records, a copy of all sequence and key specimen data also migrate to NCBI or its sister genomic repositories [DNA Data Bank of Japan (DDBJ), European Molecular Biology Laboratory (EMBL)] as soon as results are ready for public release. As such, bold is one of a spectrum of ancillary sites that provide the biological science community with specialized services that cannot be delivered by the global sequence databases, which were designed for a different mission — the assembly and organization of all sequence records. Access to bold is open to any researcher with interests in DNA barcoding; computational resources and personnel are available to sustain its primary site until 2011. The prospects for extended support, as well as funding to establish regional data nodes and mirror sites, will strengthen as usage grows.
bold now involves more than 65 000 lines of combined code written in Java (for business logic and light analytics), C++ (for heavy analytics), and PHP (for front end). It runs in a Linux environment with all data residing in a PostgreSql relational database (http://www.postgresql.org). Further details on application design and database structure are provided elsewhere (Ratnasingham and Hebert, in preparation), while an interactive introduction to bold is available at http://www.barcodinglife.org/docs/boldtutorial.html.
Some features on bold, such as access to data in public projects and use of the Identification System, are available to any visitor. However, system registration (which only involves the provision of contact details) grants additional privileges, such as the ability to create private projects and to share access to password-protected data. In the following sections, we briefly review the three functional units now available on bold— the Management and Analysis System, the Identification System and the External Connectivity System. While these three modules support key activities, programming efforts by members of the barcode community will soon add new capabilities in data analysis and visualization.
Management and analysis system (MAS)
Project establishment and data standards
Any interested researcher can gain the capacity to create projects by registering as a bold user through the completion of a short online form (http://www.barcodinglife.org/views/newuserapp.php). Once a project is established, only two data elements are required to inject each specimen record — a sample ID number and a taxonomic assignment (although the latter can simply be to a phylum-level). However, the specimen record will not gain formal barcode status until seven data elements are in place:
Species name (although this can be interim).
Voucher data (catalogue number and institution storing).
Collection record (collector, collection date and location with GPS coordinates).
Identifier of the specimen.
COI sequence of at least 500 bp.
Polymerase chain reaction (PCR) primers used to generate the amplicon.
Trace files.
Although these criteria must be satisfied to gain formal barcode status, data that lack one or more of these fields can reside within bold. For example, although the barcode standard demands a 500-bp read with less than 1% Ns, bold allows the injection of shorter sequences with no upper limit on Ns.
Although ultimate responsibility for data quality lies with the project participants, bold employs several tools to identify data anomalies or low quality records. All submitted sequences are first translated into amino acids and are compared against a Hidden Markov Model of the COI protein to verify that they actually derive from COI. Sequences that pass this check are then examined for stop codons (to detect possible pseudogenes) and are also compared against a small suite of possible contaminants (e.g. human). If any potential errors are detected, the submitter is informed and the sequence is flagged. When trace files are supplied, bold further determines a phred score (Ewing & Green 1998) for each nucleotide position and a mean value for the full sequence. Using these results, it places each sequence record into one of four categories — failed (no sequence), low quality (mean phred < 30), medium quality (mean phred = 30–40) and high quality (mean phred > 40).
Projects are not subjected to any centralized review; data quality is ultimately reliant upon the project team and upon the peer-review process that occurs as data are incorporated into scientific publications. Similarly, barcode records are not filtered as they enter bold, even if they show deep sequence divergence (> 2%) from existing records for a particular species. However, bold has the capacity to search out and highlight such cases so they can be investigated. Detailed taxonomic study of such cases of deep barcode divergence has already led to the description of new species (e.g. Handfield & Handfield 2006).
Data repository
The core data element in bold is a biphasic record consisting of a specimen page and a sequence page. The specimen page assembles varied collateral data, including the date and location of capture, as well as from one to several image(s) of each specimen (Fig. 1). When spatial coordinates are available, they are plotted on a geographic information system with flexible scaling. This page also records both the taxonomist responsible for a specimen's identification and the holding institution. The fields currently incorporated into the specimen page meet the Darwin Core 1 standard established by GBIF and other biodiversity alliances; future field enhancements will be made as community standards evolve. Each specimen page is coupled to a companion page that records the barcode sequence and the PCR primers used to generate the amplicons that were sequenced (Fig. 2). The primer registry allows the deposition of information on both standard PCR primer sets and more complicated cocktails, but it does not record amplification conditions. Although the latter information will usually be available in the publication resulting from the records, bold has the capacity to attach documents (PDF, Word, Excel, etc.) to any project so that detailed PCR protocols can also be provided in this fashion. Currently, bold is exclusively populated with COI data, but it can support other single-gene or multigenic barcodes. As a result, it is positioned to deal with the additional data storage requirements created when supplemental barcode regions gain registration for the animal kingdom or as alternate barcode regions are designated for the other kingdoms of life.
Fig. 1.

Specimen page for an individual of Macroglossus mininus (Chiroptera). 1, voucher information; 2, full taxonomy; 3, collection location; 4, collection site maps; 5, specimen images.
Fig. 2.
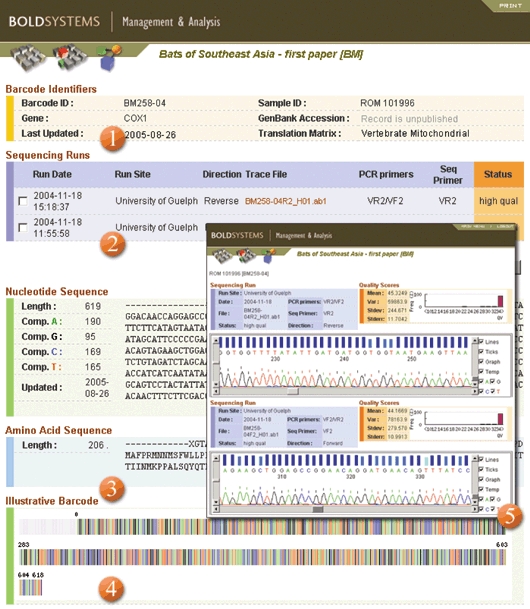
Sequence page for the same individual of Macroglossus mininus (Chiroptera). 1, specimen details; 2, sequencing details including links to trace files; 3, amino acid translation of sequence; 4, colourized barcode representation; 5, trace viewer and detailed stats on trace quality.
Regardless of the genic target(s), each barcode record is placed into a project that can accommodate data for up to 999 specimens. This size constraint was imposed as an aid to quality control; single massive projects compromise both internal and peer review of results. However, there is no barrier to investigations that require the submission of very large volumes of data; some current studies include more than 10 000 specimen records. In such cases, specimen records are placed in a series of projects that sit within a single ‘container’ whose structure mirrors that of a standard Windows/Mac folder. Because there is no limit on the number of projects within a container, bold can accommodate studies that survey many specimens. For example, an ongoing campaign to assemble barcode records for all North American species of Lepidoptera aims for 10× coverage of the 13 000 species so the final number of records will be more than 100 000.
bold provides users with several pathways for the direct submission of their data, which can include specimen collaterals, sequences, trace files and images. Because it can accept data from sites compliant with the Distributed Generic Information Retrieval (DiGIR) protocol (http://digir.sourceforge.net), some users will avoid the need to reformat their records. Once data have been injected, there are several tools to aid their review, including a search engine that enables the retrieval of records based on multiple criteria. Specimen records in each project can also be sorted by a variety of factors including taxonomy, sequence length and specimen record number. Finally, because specimen information may need updating, an edit function is accessible from this page. bold also supports full journaling of sequence and specimen records, maintaining, in essence, an audit trail for every data field that is directly available from the sequence and specimen pages.
As noted above, new projects can be created by any registered user; this individual gains ‘Project Manager’ status through the act of project establishment. Projects are password protected; all data records remain private to a single researcher or to a group of collaborators until their public release. Because the security model is granular, the Project Manager can provide other individuals with either ‘edit’ or ‘view only’ access to each of the varied data elements in a project.
Data management
Because DNA barcoding projects often involve the analysis of large numbers of specimens, an interface is needed to both monitor analytical progress and compliance with data standards. The project management console in the MAS serves this function (Fig. 3). It reports progress in the submission of those data fields (trace files, images, GPS coordinates) that are needed for a record to gain barcode status. It also registers the number of specimens lacking sequences within a project and it monitors the sequence lengths themselves. Finally, as a quality assurance check, it reports sequence anomalies, such as stop codons (that might signal the presence of a pseudogene), human sequences (that might indicate contamination) or kingdom-level mismatches (as would arise if, for example, a fungal sequence was recovered in a project focused on animals).
Fig. 3.

Management Console for a project assembling barcode records for the Fishes of Pacific Canada. 1, pie diagrams showing progress in analysing specimens and species; 2, status report on key specimen collaterals; 3, distribution of sequence lengths; 4, various analytical tools and access to specimen records.
Data uploads, downloads and searches
Specimen data can be uploaded to bold using either online forms (for small numbers of specimen records) or through standardized spreadsheets. Trace files, specimen images and sequence records are also uploaded directly, allowing users to have immediate access to their submitted data. Although bold currently only supports trace files from ABI sequencers, other trace formats will be added as the need arises.
Data that reside in bold can be readily exported for use in other analytical packages. The simplest forms of data export, downloads from single projects, are available directly from the project management console. The sequence-export function generates a FASTA file for all sequence records in a project, each labelled with a species name and specimen identifiers (i.e. voucher, sequence ID). Another function, the data workbook, generates an Excel spreadsheet that includes all collateral details (taxonomy, collection dates, etc.) for each specimen in a project, while the label-maker function generates labels in varied formats (pinned insects to vertebrate skins) to identify specimens which have been barcoded. Finally, the trace-file function provides access to the raw sequence traces that underpin the sequence records.
bold includes search functionality that allows users to ascertain sequence coverage for a particular taxonomic group and/or geographic region. The taxonomy browser permits the user to gain access to a list of all species in a particular taxonomic category (genus to phylum). This search is comprehensive; it includes both published and unpublished records, but it only provides access to published sequences.
Integrated analytics
The MAS includes several tools for routine data analysis. Among these, the taxon ID tree, which employs varied distance metrics to generate a neighbour-joining (NJ) tree based on nucleotide or amino acid sequences (Saitou & Nei 1987; Howe et al. 2002), is particularly valuable. This module supports the labelling of terminal branches with taxonomic information, locality data and/or sequence lengths (Fig. 4) and provides results in a PDF format to aid transmission to collaborators. The ID tree can also be colourized in various ways to highlight, for example, recently collected data or members of a specific taxonomic category (e.g. genus or family). In addition, when specimen photographs are available within a project, an image library can be generated which matches the ordering of specimens in the ID tree. Other analytical tools within the MAS deliver synoptic views that aid detection of data anomalies that can then be probed in detail. For example, the nearest-neighbour analysis highlights both cases where individuals assigned to different species show barcode congruence and those where deep divergences occur among conspecifics. Other analytical modules summarize information on nucleotide composition, assemble image libraries, or display aggregate information, such as the collection points for specimens in a project. Because high-quality, properly validated sequence records are critical, the DNA barcode standard demands both bidirectional sequence reads and the injection of trace files. bold has the capacity to assemble a sequence from the trace files for a specimen and to assign a quality score to the resultant record when bi-directional reads are available (phred —Ewing & Green 1998).
Fig. 4.

Taxon ID tree of barcode records for North American members of the subfamily Macroglossinae (Sphingidae), showing colouration by country. 1, cover page; 2, ID tree.
Although results are ordinarily first analysed on a project-by-project basis, bold has the capacity to combine records from multiple projects. These ‘merged’ projects are ephemeral, but all of the standard analytical modules are available for their examination. Because computational burdens grow nonlinearly, merged projects ordinarily have a size limit of 5000 specimens. Larger projects require additional computational support and are currently dealt with on a case-by-case basis. However, there are several longer-term solutions for the analysis of the very large data sets that will emerge from major barcode campaigns. More efficient analytical protocols can be employed (Mailund et al. 2006) or data can be partitioned before analysis. Moreover, these size limits only apply to certain analytical elements (e.g. NJ tree). Other analyses, such as the ID engine (see below), scale in a linear fashion and are able to incorporate all data records.
Identification system (IDS)
Unknown specimens are identified by pasting their sequence record into the window on the ID page. The query sequence needs to satisfy just one criterion — it must include at least 300 bp from the barcode region of COI. bold also has two identification functions that operate within single projects. One tests the validity of existing identifications, recording both cases of confirmation and conflict with those generated by the ID System. The other function assigns identifications to specimens lacking prior taxonomic placements, essentially carrying out a project-wide implementation of the ID function.
In all three cases, the ID System employs a linear search to collect nearest neighbours from a global alignment of all reference sequences (65 000 validated, 165 000 total, 15 October 2006). A query-optimized search library is maintained outside the main database with new records added weekly. This rapid access ensures that all data are available to guide identifications (although the sequence records themselves remain private until moved into the public realm), but this comes at a cost. Some barcode records that have not been through full validation will derive from misidentified specimens or will reflect analytical errors. Because of this fact, barcode records in the search library are placed into two categories. Species with a minimum of three representatives and a maximum conspecific divergence of two percent are classified as verified barcodes and these records are used as the default search library. All other records are stored in another data partition where they can be used for a full screen of the data, but this analysis is risky because the records are unvalidated.
Any query sequence is aligned very quickly to the global alignment through a Hidden Markov Model (HMM) profile of the COI protein (Eddy 1998), followed by a linear search of the reference library. blast methods were tested, but users had difficulty interpreting results because scores are influenced by sequence length as well as by sequence similarity. Moreover, the best blast hit is of little value when no closely related taxa are in the reference database (Pertsemlidis & Fondon 2001). Finally, benchmark studies (data not shown) demonstrated that linear searches supported by HMM alignments are faster than blast (which was primarily designed for local similarity searches — Altschul et al. 1990).
The use of sequence thresholds to generate identifications has gained broad application in studies of microbial life (Venter et al. 2004; Tringe & Rubin 2005). The same approach is also highly effective for animals because levels of barcode variation within species are tightly constrained while most closely allied species show deep sequence divergence (Hebert et al. 2003b). Based on these general patterns of sequence variation, the identification system on bold (Fig. 5) delivers a species identification if the query sequence shows a tight match, less than 1% divergence, to a reference sequence. In those few instances where two or more taxa share sequences with less than 1% divergence, all possible species assignments are shown. This approach defends against ‘overdiagnosis’ in such cases. When a species level match is found, the user is provided with access to a species page that aggregates all the available information about the species in bold. When available, there are also links to external species pages (e.g. FishBase: http://www.fishbase.org). Due to the limited number of species in the present reference library, the ID engine is often unable to deliver a species-level identification. However, its effectiveness is rising rapidly for groups that are gaining serious barcode attention and these involve some of the most important targets for biological research.
Fig. 5.

ID page generated following submission of a COI sequence from an unidentified caterpillar. 1, taxonomic assignment; 2, sequence similarity between unknown and reference sequences; 3, link to species page; 4, ID Tree showing 100 nearest taxa.
When a species-level match is not obtained, the query sequence is assigned to a genus in those cases where it shows < 3% sequence divergence from a reference sequence. In all other cases, the ID algorithm is aborted and the system gathers taxonomic assignments for the 100 nearest-neighbouring taxa and summarizes their distribution across the taxonomic hierarchy (phylum, class, order, family, genus). For example, if all 100 nearest neighbours are members of the Chordata, the queried specimen is shown to have 100% of its nearest neighbours in this phylum, suggesting that it is also a chordate. This approach means that the probability of gaining 100% congruence scores typically declines at lower levels in the hierarchy simply because of current limitations in size of the reference database. Because of this fact, it is usually important to gain a more direct sense of the taxonomic relationships of the queried specimen to its 100 nearest neighbours by inspecting the NJ tree accessible from the ID page.
External connectivity system (ECS)
The ECS exposes system functionality and data to other developers in the form of web-services using standard protocols [simple object access protocol (SOAP), representational state transfer (REST)]. Moreover, external services can be registered and integrated into the bold interface, providing users with access to remote data and analytics.
One broadly useful data export capability of the ECS involves its ability to provide daily updates to external websites that are monitoring progress in the assembly of barcode records for particular taxonomic groups or geographic regions. For example, the campaign sites for birds (http://www.barcodingbirds.org), fishes (http://www.fishbol.org) and Lepidoptera (http://www.lepbarcoding.org) receive XML feeds that enable researchers involved in these campaigns to monitor progress. Data can also be extracted for particular geographic regions, such as the Canada campaign that is monitoring the accumulation of barcode coverage for species in that nation (http://www.bolnet.ca).
A second function of the ECS is of significance to all users — its ability to carry out bulk uploads of both barcode sequences and their associated specimen collaterals to GenBank. This capacity not only provides a highly efficient means of injecting sequences; it also ensures that data submissions encounter few difficulties. Taxonomic queries are minimized because checklists on bold, at least for major projects, will be harmonized with those at NCBI. Furthermore, its use as a submission tool ensures that records are pre-screened for compliance with the standards that must be satisfied to gain formal ‘barcode’ designation (Hanner et al. 2007).
Computational resources
bold is currently supported by 60 processor cores producing 152 gigahertz of total processing power. Six terabytes of storage, consisting of fibre channel, small computer system interface (SCSI) and serial advanced technology attachment (SATA) drives in a SAN environment, are available to allow growth of the database to approximately 1 million records based on current record sizes and usage patterns. Data are backed-up nightly on a 16-terabyte tape pool with copies stored offsite. Funding is in place for a substantial increase in computational support (300 processor cores, 68 terabytes fibre channel and SATA storage drives in a SAN environment, 264 terabytes tape backup). These resources, which will be added as justified by growth in bold, can support a 20-fold increase in the user community and a 100-fold growth from the current number of records (to 10 million). The core programming node for bold has funding for three programmers and four database technicians in addition to funding for hardware. It is important to note that much of the responsibility for injection and validation of primary data will reside with users, aiding the growth of records in bold without requiring a large central staff.
Prospects
Many of the barriers to the development of a comprehensive barcode library for eukaryotic life have been broken. Industrial-scale collection programs have the capacity to deliver large numbers of specimens for analysis (Fisher 1999; Janzen 2004) and current protocols permit single sequencing facilities to readily gather 100 000 barcode records per year (Hajibabaei et al. 2005). Once the global biodiversity infrastructure includes just 100 such facilities, the task of assembling comprehensive barcode libraries for large groups of life will be well within reach. For example, the 100 million barcode records needed to provide 10× coverage for the estimated 10 million animal species could be gathered in a decade. The Barcode of Life Data System is ready to absorb these records and to support their use as a basis for automated identifications. In short, current analytical and databasing platforms have the scaling capacity needed to create a global bio-identification system. Future advances in DNA sequencing (Blazej et al. 2006) and computational technologies further promise the development of portable devices that will both gather barcode sequences in minutes and use an on-board barcode reference library to generate identifications. Such expedited access to biological identifications promises important benefits to both science and society.
Acknowledgments
Funding from the Canada Foundation for Innovation, Genome Canada through the Ontario Genomics Institute, Ontario Innovation Trust, NSERC and the Gordon and Betty Moore Foundation aided development of bold and emplacement of the computational infrastructure and personnel needed to support it. We thank Pia Marquardt for assistance in implementing various elements of bold and Greg Downs and Rob Dooh for valuable IT support. We are grateful to many colleagues at Guelph, especially Alex Borisenko, Jeremy deWaard, Mehrdad Hajibabaei, Bob Hanner, Nataly Ivanova, Alex Smith and Dirk Steinke for their advice and role in testing analytical modules. We also thank Biff Birmingham, Brian Fisher, Brian Golding, Dan Janzen, Don Lafontaine, Jean-Francois Landry, Scott Miller, Mark Stoeckle and Bob Ward for their suggestions in relation to the required functionalities of bold. Finally, we thank two anonymous reviewers for their comments on an earlier version of this manuscript.
References
- Altschul SF. Basic local alignment search tool. Journal of Molecular Biology. 1990;215:403–410. doi: 10.1016/S0022-2836(05)80360-2. [DOI] [PubMed] [Google Scholar]
- Barber P. Estimating diversity of Indo-Pacific coral reef stomatopods through DNA barcoding of stomatopod larvae. Proceedings of the Royal Society of LondonSeries B, Biological Sciences. 2006;273:2053–2061. doi: 10.1098/rspb.2006.3540. [DOI] [PMC free article] [PubMed] [Google Scholar]
- Blazej RG. Microfabricated bioprocessor for integrated nanoliter-scale Sanger DNA sequencing. Proceedings of the National Academy of Sciences, USA. 2006;103:7240–7245. doi: 10.1073/pnas.0602476103. [DOI] [PMC free article] [PubMed] [Google Scholar]
- Eddy SR. Profile hidden Markov models. Bioinformatics. 1998;14:755–763. doi: 10.1093/bioinformatics/14.9.755. [DOI] [PubMed] [Google Scholar]
- Ewing B. Base-calling of automated sequencer traces using phred. 2. Error probabilities. Genome Research. 1998;8:186–194. [PubMed] [Google Scholar]
- Fisher BL. Improving inventory efficiency: a case study of leaf-litter ant diversity in Madagascar. Ecological Applications. 1999;9:714–731. [Google Scholar]
- Hajibabaei M, et al. Critical factors for the high volume assembly of DNA barcodes. Philosophical Transactions of the Royal Society of LondonSeries B, Biological Sciences. 2005;360:1959–1967. doi: 10.1098/rstb.2005.1727. [DOI] [PMC free article] [PubMed] [Google Scholar]
- Hajibabaei M. DNA barcodes distinguish species of tropical Lepidoptera. Proceedings of the National Academy of Sciences, USA. 2006;103:968–971. doi: 10.1073/pnas.0510466103. [DOI] [PMC free article] [PubMed] [Google Scholar]
- Handfield D. A new species of Plusia (Lepidoptera: Noctuidae) from North America. Canadian Entomologist. 2006;138:853–859. [Google Scholar]
- Hanner R. Data standards for DNA barcode records: indexing an encyclopedia of life. Submitted. 2007.
- Hebert PDN. Biological identifications through DNA barcodes. Proceedings of the Royal Society of LondonSeries B, Biological Sciences. 2003a;270:313–321. doi: 10.1098/rspb.2002.2218. [DOI] [PMC free article] [PubMed] [Google Scholar]
- Hebert PDN. Barcoding animal life: cytochrome c oxidase subunit 1 divergences among closely related species. Proceedings of the Royal Society of LondonSeries B, Biological Sciences. 2003b;270:S596–S599. doi: 10.1098/rsbl.2003.0025. [DOI] [PMC free article] [PubMed] [Google Scholar]
- Hebert PDN. Identification of birds through DNA barcodes. Public Library of Science Biology. 2004;2:1657–1663. doi: 10.1371/journal.pbio.0020312. [DOI] [PMC free article] [PubMed] [Google Scholar]
- Howe K. quicktree: building huge neighbor-joining trees of protein sequences. Bioinformatics. 2002;18:1546–1547. doi: 10.1093/bioinformatics/18.11.1546. [DOI] [PubMed] [Google Scholar]
- Janzen DH. Setting up tropical biodiversity for conservation through non-damaging use: participation by parataxonomists. Journal of Applied Ecology. 2004;41:181–187. [Google Scholar]
- Mailund T. Recrafting the neighbor-joining method. BMC Bioinformatics 2006. 2006 doi: 10.1186/1471-2105-7-29. 7:29 doi: 10.1186/1471-2105-7-29. [DOI] [PMC free article] [PubMed] [Google Scholar]
- Marshall E. Will DNA bar codes breathe life into classification? Science. 2005;307:1037. doi: 10.1126/science.307.5712.1037. [DOI] [PubMed] [Google Scholar]
- Pertsemlidis A. 2001 Having a blast with Bioinformatics (and Avoiding blastphemy) Available at http://GenomeBiology.com/2001/2/10/reviews/2002.
- Saitou N. The neighbor-joining method: a new method for reconstructing phylogenetic trees. Molecular Biology and Evolution. 1987;4:406–425. doi: 10.1093/oxfordjournals.molbev.a040454. [DOI] [PubMed] [Google Scholar]
- Savolainen V. Towards writing the encyclopedia of life: an introduction to DNA barcoding. Philosophical Transactions of the Royal Society of LondonSeries B, Biological Sciences. 2005;360:1805–1811. doi: 10.1098/rstb.2005.1730. [DOI] [PMC free article] [PubMed] [Google Scholar]
- Smith MA. DNA barcoding for effective biodiversity assessment of a hyperdiverse arthropod group: the ants of Madagascar. Philosophical Transactions of the Royal Society of LondonSeries B, Biological Sciences. 2005;360:1828–1834. doi: 10.1098/rstb.2005.1714. [DOI] [PMC free article] [PubMed] [Google Scholar]
- Smith MA. DNA barcode reveal cryptic host-specificity within the presumed polyphagous members of a genus of parasitoid flies (Diptera: Tachinidae) Proceedings of the National Academy of Sciences, USA. 2006;103:3657–3662. doi: 10.1073/pnas.0511318103. [DOI] [PMC free article] [PubMed] [Google Scholar]
- Tringe SG. Metagenomics: DNA sequencing of environmental samples. Nature Reviews Genetics. 2005;6:805–814. doi: 10.1038/nrg1709. [DOI] [PubMed] [Google Scholar]
- Venter JC, et al. Environmental genome shotgun sequencing of the Sargasso Sea. Science. 2004;304:66–74. doi: 10.1126/science.1093857. [DOI] [PubMed] [Google Scholar]
- Ward RD. DNA barcoding Australia's fish species. Philosophical Transactions of the Royal Society of LondonSeries B, Biological Sciences. 2005;360:1847–1857. doi: 10.1098/rstb.2005.1716. [DOI] [PMC free article] [PubMed] [Google Scholar]