Abstract
Understanding protein phase behavior is important for purification, storage, and stable formulation of protein drugs in the biopharmaceutical industry. Glycoproteins, such as monoclonal antibodies (MAbs) are the most abundant biopharmaceuticals and probably the most difficult to crystallize among water-soluble proteins. This study explores the possibility of correlating osmotic second virial coefficient (B22) with the phase behavior of an intact MAb, which has so far proved impossible to crystallize. The phase diagram of the MAb is presented as a function of the concentration of different classes of precipitants, i.e., NaCl, (NH4)2SO4, and polyethylene glycol. All these precipitants show a similar behavior of decreasing solubility with increasing precipitant concentration. B22 values were also measured as a function of the concentration of the different precipitants by self-interaction chromatography and correlated with the phase diagrams. Correlating phase diagrams with B22 data provides useful information not only for a fundamental understanding of the phase behavior of MAbs, but also for understanding the reason why certain proteins are extremely difficult to crystallize. The scaling of the phase diagram in B22 units also supports the existence of a universal phase diagram of a complex glycoprotein when it is recast in a protein interaction parameter.
INTRODUCTION
A protein solution remains homogenous only up to a certain protein concentration. Once this solubility limit is exceeded, a new state or phase appears as a result of different mechanisms such as crystallization, precipitation, gelation, aggregation, or liquid-liquid phase separation. These phase transformations in a protein solution are generally defined as “phase behavior”. Understanding protein phase behavior is important for a variety of reasons. From a medical point of view, protein phase transition is the cause of many diseases, such as cataracts (1), Sickle-cell diseases (2), and neurodegenerative or amyloidogenic diseases (3,4). The controlled release of certain protein drugs, such as insulin, depends on their particular state (5). From a biological perspective, the microcompartmentation of the cell cytoplasm is thought to be driven partially by protein phase separation (6).
Protein crystallization, on the other hand, is an important tool of structural biology. Most high-resolution protein structural information is obtained by x-ray diffraction, neutron crystallography, or surface plasmon resonance of protein crystals. Protein crystallization is also instrumental in elucidating protein function, mode of action, reaction mechanism, and so on. In addition, precipitation and crystallization are important unit operations in the purification of industrial proteins and are receiving increasing attention in the industrial separation of therapeutic proteins. Salt-induced precipitation is often the first step in protein purification from a fermentation broth, or from plant and animal extracts, whereas crystallization may be the last. Solid (crystal or precipitate) forms of a protein are also convenient for storage and transportation. Furthermore, the stability of a biologically active protein is well maintained in the crystal form.
The quality of crystals may not be an important issue when crystallization is applied for purification and/or storage of protein. It is, rather, important to obtain crystals in bulk quantity without losing protein functionality. However, structural elucidation by x-ray crystallography requires diffraction-quality crystals. Growing such crystals has always been the major barrier to the crystallographic determination of protein structure, in particular in the case of integral membrane proteins (7) and glycoproteins (8). Membrane proteins are generally considered to be the most difficult to crystallize, mainly due to their amphiphilic character, which implies the use of detergent for their solubilization and crystallization (9). Among water-soluble proteins, glycoproteins are considered the most difficult to crystallize (10).
Monoclonal antibodies (MAbs) are flexible macromolecules that can assume a wide range of conformations as a consequence of their intrinsic domain mobility and segmental flexibility. MAbs have recently been recognized as enormously efficacious therapeutics, which can be applied to treat numerous life-threatening diseases, including cancer and immune diseases. MAbs are also well established as specific serologic reagents for a number of immunoassays and diagnostics for the detection of a wide variety of antigens thanks to their unlimited availability (11). Unfortunately, MAbs are extremely difficult to crystallize as intact molecules, probably because of their structural complexity and variability. Most of the published MAb crystallization experiments have been restricted to either Fab-antigen complexes or MAb fragments or MAbs without a hinge region. Nevertheless, successful crystallization of intact MAbs has been reported on several occasions (10,12–16). However, successful crystallization of one MAb obviously does not imply that other MAbs will equally readily crystallize under the same solution conditions.
Crystallization or, more generally, transformation into different phases of a protein, occurs due to changes in solution conditions. There are numerous solution variables that can influence protein phase behavior (17), and a variety of phases may form that are difficult to distinguish. The changes of state of a protein as a function of these solution variables are generally known as a “protein phase diagram”. The fundamental relationship between a particular solution condition and a particular state of protein is poorly understood. However, evidence has been accumulating that protein interactions play a governing role in determining the structure of the phase diagram. The most tangible result so far is that the phase behavior of a protein solution is correlated with a protein-interaction parameter named “osmotic second virial coefficient” (B22). B22, by definition, is a thermodynamic parameter that reflects the magnitude and direction of deviations of a protein solution from ideality. At the molecular level, B22 characterizes pairwise protein self-interactions including contributions from excluded volume, electrostatic interactions, and short-range interactions (18). According to statistical thermodynamics, B22 is correlated to the potential of mean force, which describes all known interactions between two protein molecules in a dilute solution (19). A negative value of B22 indicates protein-protein attraction, whereas a positive B22 value indicates mutual repulsion.
Solution conditions under which a protein is likely to crystallize correspond to a certain range of slightly negative B22 values, known as the “crystallization slot” (20,21). If a B22 value is more negative than the crystallization slot, disordered precipitation is the phase most likely to develop. However, conducting crystallization experiments under conditions that correspond to the crystallization slot does not guarantee a successful crystallization. The predictive value of the crystallization slot can be improved by studying specific ion effects and the phase diagram. On the other hand, conducting experiments under conditions corresponding to positive B22 values is sure to prevent phase separation from occurring. This correlation is also exploited in pharmaceutical industries for screening stable conditions, at which B22 values are largely positive, e.g., for liquid formulations of protein drugs. A detailed review of B22 values of different proteins and their corresponding phases was published earlier (22,23). The thermodynamic insight regarding the macromolecular interactions involved in B22 (18,24) and why these interactions are related to protein phase behavior were explained elsewhere (25–28).
Besides being related to the crystallization slot, it has been established that B22 is a critical parameter in controlling or accelerating protein aggregation, folding, and stability (29–31). Recent studies show that B22 is an important thermodynamic parameter not only in predicting protein phase behavior, but also in understanding and designing a molecular approach to different bioseparation processes (32–36). The reason B22 was not applied to bioseparations earlier is because of the difficulty of experimentally determining B22. The recent development of self-interaction chromatography (SIC) allows more accurate and rapid measurement of B22 using a minimal amount of protein (22,23,37–45).
This study explores the correlation between B22 and the phase behavior of an intact monoclonal antibody, designated in this article as IDEC-152, which has a molecular mass of ∼144 kDa. The IDEC-152 MAb has not been possible to crystallize as yet, even when commercial crystallization kits particularly designed for intact MAbs were employed. The unsuccessful crystallization efforts on IDEC-152 prompted a study of its phase behavior with respect to B22 values. In this article, we present phase diagrams of IDEC-152 as a function of different classes of precipitants. B22 values were also measured for the same conditions by SIC and correlated with the phase diagrams. As a result, a single MAb phase diagram displays solubility, B22, and the optimal crystallization region. This phase diagram is useful not only in developing a fundamental understanding of the phase behavior of MAbs, but also in understanding the reason why certain proteins are extremely difficult to crystallize. To the best of our knowledge, this is the first work to present experimental data on phase behavior of an intact MAb. In addition, the scaling of the phase diagram in B22 units provides useful information on a structurally complex glycoprotein, demonstrating the universality of the phase diagram of many proteins when recast in a protein interaction parameter.
PROTEIN PHASE DIAGRAM
A phase diagram shows the state of a material as a function of all of the relevant variables of the system. The simplest form of a protein phase diagram usually displays the state of a protein as a function of protein concentration and another parameter, i.e., the precipitant concentration, with all other variables held constant. This simple phase diagram of different proteins under different solution conditions is quantitatively quite different, although their basic shape is similar. Many broad classes of proteins display a single universal phase diagram, if the phase diagram is recast on a protein interaction parameter (25–27,33,46,47), instead of correlating a single parameter with a solution condition. This is not surprising, because a protein interaction parameter, such as B22, reflects all the solution parameters in a single dimension. Once B22 values of a protein are known, the approximate shape and position of the phase diagram would be known.
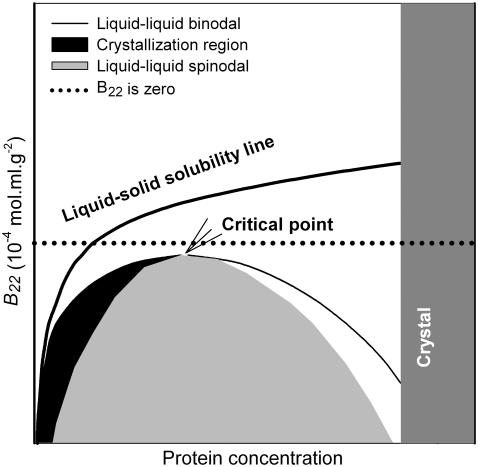
Rosenbaum and co-workers (25–27) pioneered the development of a generalized protein phase diagram based on its similarity to those of colloids immersed in polymer solutions. They showed that proteins and other globular macromolecules with a size >1 nm do not display gas-liquid phase transitions (25), but rather display a broad region of metastable liquid-liquid coexistence along with the region of the liquid-crystal solubility line. In other words, the protein phase diagram exhibits only a liquid-solid equilibrium in three distinct phases: a dilute liquid phase (analogous to the vapor phase), a dense liquid phase (analogous to the liquid phase), and a crystal phase (analogous to the solid phase). The liquid-liquid coexistence region in a protein phase diagram is further separated into two parts (Fig. 1), a metastable liquid-liquid region referred to as the “binodal” and an unstable liquid-liquid region referred to as the “spinodal” (51–53). If a protein solution is quenched into the spinodal of this liquid-liquid phase transition, the solution will spontaneously separate into two metastable phases corresponding to the binodal, i.e., one light phase depleted in protein and the other dense phase concentrated in protein. In the regions between the binodal and the spinodal curves, the solution is metastable with respect to liquid-liquid phase separation, i.e., liquid-liquid phase separation occurs rather slowly in these regions. At the critical point, the two phases become identical, and liquid-liquid phase separation is not possible beyond this point.
FIGURE 1.
Schematic representation of a generalized protein phase diagram.
The location of George and Wilson's crystallization slot (20,21) in the universal protein phase diagram is around the metastable liquid-liquid immiscibility region (33,47,51,52). The precise location of the crystallization is below the liquid-liquid critical point (27,47) as well as around the critical point (54–57), where nucleation occurs by two different mechanisms. Because of the presence of a nearby metastable liquid-liquid two-phase region, critical density fluctuations are strongly enhanced around the liquid-liquid critical point, which lowers the free energy barrier to the formation of critically sized nuclei (55–57). Therefore, nucleation occurs around the critical point spontaneously. Below the critical point, small liquid-like droplets with a density corresponding to the dense branch of the liquid-liquid binodal may lead to the enhancement of nucleation just outside the low-density branch of the liquid-liquid binodal (51,58). As a consequence of the high concentration in the droplets, a large fraction of the protein molecules forms aggregates. Crystalline nuclei are then formed from the aggregates inside the droplets. Once the aggregate grows beyond a critical size (about a few hundred molecules), it can convert into a stable crystalline nucleus (59). Each nucleus is covered with a thin liquid film with a high protein concentration. This thin film lowers the surface energy of the crystal. Protein molecules, diffusing from the dilute solution to the crystal are first incorporated into the surface film. The molecules in this liquid surface film are quite mobile and have ample time to find the proper orientation for incorporation into the crystal (53). If protein solution conditions fall within the spinodal, the formation of large droplets of high density is favored over the formation of crystalline nuclei. The rapid phase separation in this region leaves little time for establishing the proper order and steric orientations of the protein molecules required for crystallization. The desolubilization and self-association rate are faster in this region than the rate at which molecules achieve the proper orientations that would favor crystallization. Below George and Wilson's crystallization slot, the binodal and spinodal are so wide that the light branches of both binodal and spinodal correspond to an impractically low concentration of protein to induce crystallization. Therefore, this region favors amorphous precipitation rather than crystallization.
George and Wilson's narrow range of B22 values provides necessary but insufficient information for successfully predicting crystallization of different proteins. The universal protein phase diagram in the dimension of B22 gives further insight into the possibility of crystallizing a protein that is difficult to crystallize, such as IDEC-152. For instance, nucleation can occur more easily when there is a larger distance between the liquid-liquid critical point and the liquid-solid solubility line (26). However, the phase behavior of certain proteins may not be precisely mapped using the universal phase diagram because of the presence of long-range interactions and/or the highly anisotropic nature of protein interactions occurring due to nonsphericity and surface patchiness. For example, a protein solution well between the critical point and the solubility line might also prove to be difficult to crystallize because of its noncomplementary shape (24). Certain proteins may have a strong mutual attraction in a few specific orientations, which lead to overall slightly negative B22 values but are not compatible with any solid lattice formation. If all the bonds necessary for crystallization cannot form in the crystalline phase, but only in the liquid phase, then the protein will not crystallize. Rather, it will exist as a condensed liquid state, analogous to the precipitate phase (54,60). The presence of moderately long-range interactions, which are generally neglected, would shift the liquid-liquid critical point to the gelation regime (61–63).
MATERIALS AND METHODS
Materials
IDEC-152 MAb was provided by Biogen-Idec (San Diego, CA). N-hydroxysuccinimide (NHS)-activated Sepharose 4 Fast Flow (code 17-0906-01), a Tricorn 5/50 column (code 18-1163-09), and a Tricorn 5 adaptor unit (code 18-1153-00) were purchased from GE Healthcare Europe, Diegem, Belgium.
Acetic acid (Baker analyzed, product 6052), sodium chloride (Baker analyzed, product 0278), hydrochloric acid (36–38%, Baker analyzed, product 6081), acetone (Bakers HPLC analyzed, product 8142), and sodium hydroxide (Baker analyzed, pellets, product 0402) were bought from Mallinckrodt Baker (Deventer, The Netherlands). Sodium hydrogen phosphate dihydrate (product 1.06573), sodium dihydrogen phosphate dodecahydrate (product 1.06345), ammonium sulfate (extra pure, product 1.01216), and sodium acetate trihydrate (extra pure, product 1.06265) were bought from Merck (Darmstadt, Germany). Ethanolamine (redistilled, product 41100), blue dextran (product D5717), and polyethylene glycol (PEG) 400 (product 81170) were bought from Sigma-Aldrich Chemie (Zwijndrecht, The Netherlands). Bicinchoninic acid protein assay reagents (products 23221 and 23224) were bought from Perbio Science Nederland (Etten-Leur, The Netherlands).
Dialysis equipment was a Spectra/Por Float-A-Lyzer with biotech cellulose ester membranes, 100 kDa nominal molecular weight cutoff (NMWCO), 10 ml; (product 235071, Spectrum Europe, Breda, The Netherlands). A Centriprep centrifugal filter unit (15 ml, 3 kDa NMWCO, catalog 4303) was from Millipore (Amsterdam, The Netherlands). Chromatography experiments were done in a Pharmacia (Uppsala, Sweden) fast protein liquid chromatography system controlled by Unicorn version 2.0 software. All spectrophotometric analysis was done in a UV-Visible Pharma System (8453, Agilent, Santa Clara, CA).
MAb sample preparation
The IDEC-152 MAb was prepared for SIC and precipitation experiments by dialysis using a 100-kDa NMWCO membrane at 4°C for at least 24 h. Dialysis results in an approximately twofold dilution of the MAb solution. The dialyzed MAb solution was further diluted or concentrated according to the requirement.
Self-interaction chromatography
Two different columns, one with immobilized MAb Sepharose particles and the other MAb-free Sepharose particles, were packed for SIC. The MAb-free column was prepared simply by blocking the NHS-activated groups of the Sepharose particles with ethanolamine. The immobilized MAb column was prepared by immobilizing MAb on NHS-activated sepharose particles. The details of the column preparation processes were described earlier (22,23). The concentration of immobilized MAb per volume of gel particles was determined by the bicinchoninic acid technique (64) applied to the solid phase (22,23,65). The integrity of the packed column was characterized by analyzing its height equivalent to a theoretical plate, peak shape, and symmetry of a small molecule, such as acetone and NaCl. When not in use, the columns were stored in 10 mM sodium phosphate (pH 7.0) at 4°C. Each column was used for a period of maximally 4 weeks.
The chromatography procedure was accomplished as described previously (37) in an automated Pharmacia fast protein liquid chromatography system controlled by Unicorn version 2.0 software. Before every injection, the column was equilibrated until the UV, pH, and conductivity base lines became stable. The retention data were used for calculating the B22 values according to Ahamed et al. (22,23).
Determination of phase diagram
The phase diagram of the IDEC-152 MAb was determined as a function of different precipitant concentrations at a constant temperature of 30°C. The precipitants used in this study were NaCl, (NH4)2SO4, and PEG-400. Since the MAb was only available in liquid form and no crystallization of this MAb was possible, its solubility or phase diagram was measured from precipitation experiments. The dialyzed MAb solution was concentrated to 150 mg/ml at pH 7.6 (10 mM Na-phosphate). Then a 3.0 M (NH4)2SO4 solution (pH 7.6, 10 mM Na-phosphate) was added drop-by-drop on an analytical balance to 1 ml of a 150 mg/ml MAb solution until phase separation was visually observed. The minimum (NH4)2SO4 concentration at which the MAb solubility was ∼100 mg/ml was considered the starting point. On the other hand, the minimum (NH4)2SO4 concentration at which the addition of a single drop of a 1 mg/ml MAb solution into 1 ml of an (NH4)2SO4 solution caused phase separation was regarded as the end point. Several points were chosen between the start and the end point. At every point, the MAb solutions were diluted to a number of different concentrations and incubated for 48 h to reach a stable supernatant concentration. The solutions were then investigated at 600 nm in a spectrophotometer to confirm the existence of phase separation. Finally the MAb concentration in the supernatant was measured. The concentration of MAb in the supernatant phase was treated as its apparent solubility. On the other hand, the maximum MAb concentration at which no phase separation was observed was identified as a point on the precipitation line. To determine the precipitate concentration, the solutions were allowed to settle under gravity and supernatants were removed gently.
Modeling of protein phase diagram
The phase diagram of the MAb was generated in B22 scale according to Haas and Drenth (51–53). According to their model, the Gibbs free energy per unit volume of a protein solution can be expressed as (51)
 |
(1) |
In Eq. 1,  is the volume fraction of protein,
  is the volume of a protein molecule,
  is the protein volume fraction in the crystal, and
  where
where  is the molar volume of water divided by Avogadro's number. The parameter for a protein-protein interaction in solution,
  was calculated as
  where M is the molecular mass of protein and
  is the protein density. In the calculations, the volume of an intact MAb molecule,
  was assumed as 166.5 nm3, considering the fact that the unit cell volume (2 molecules/unit cell) of the MAb crystals was 900 nm3 (14), in which the MAb volume fraction,
  was 0.37 (66). This resulted in the value
  = 1.44 g/cm3, considering the molecular mass of the IDEC-152 MAb, M, of 144 kDa.
The compositions of the two coexisting liquid phases in the binodal ( and
and  ) were calculated from the following equations:
 |
(2) |
 |
(3) |
Similarly, the compositions of the phases in the spinodal ( and
and  ) were calculated from the conditions
  and
and  For the calculation of solubility, the Gibbs free energy per unit volume of protein crystal was expressed as
  where
where  Then, the solubility line of the crystal was calculated from the condition
 |
(4) |
RESULTS AND DISCUSSION
Self-interaction chromatography
Optimization of the SIC methodology
To comply with the theory and assumptions of SIC, 15–20% surface coverage of the gel particles was found to be the optimum for avoiding both multi-body interactions and injection concentration-dependent retention behavior (22,23,37,42). An immobilization protein concentration of 9.4 mg of IDEC-152 per milliliter of packed column corresponds to 15% surface coverage for NHS-activated Sepharose. The incubation time, temperature, pH, and protein concentration of the immobilization reaction mixture are the parameters by which the immobilization reaction can be controlled. In this work, it was found that 12 h of incubation at pH 6.0 and 4°C was sufficient to obtain optimum coupling.
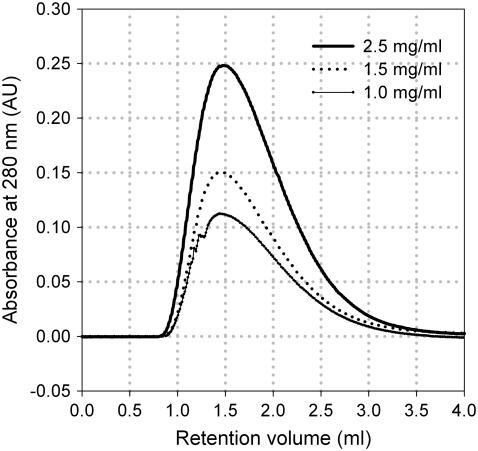
Obtaining injected protein concentration independent retention behavior is another important requirement in SIC. Our set-up of a 1.2- to 1.4-ml column, an injection volume of 50 μl, and a MAb concentration of 1–5 mg/ml produced sharp and detectable peaks. The shape of the peaks showed tailing due to the mass transfer limitation of large MAb molecules through the gel pores. The shape of all peaks was the same, regardless of column type, injection protein concentration or solution condition. Peak retention was found not to vary with injection concentration within a range of 1–2.5 mg/ml (Fig. 2). Therefore, the concentration of MAb in the injection sample was always kept between 1 and 2 mg/ml and the retention volume was determined from the peak maximum.
FIGURE 2.
Effect of the injected protein concentration on the retention of the MAb. The experiment was conducted at pH 4.2 (100 mM Na-acetate) in the MAb-immobilized column.
B22 profile of the monoclonal antibody
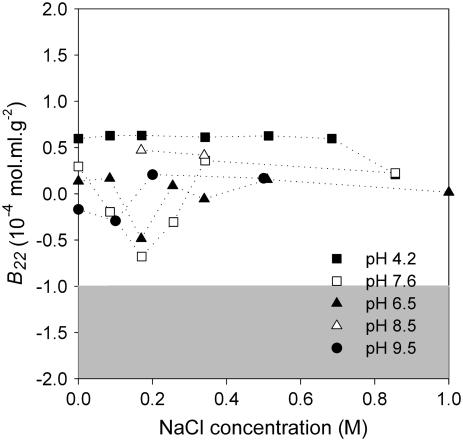
B22 values of IDEC-152 MAb were mapped as a function of NaCl concentration at different pH values. Most of the B22 values were found to be in the positive regime up to a NaCl concentration of 1.0 M at pH 4.5–9.5 (Fig. 3). Very few points were found to be on the negative side, out of which none was negative enough to be in the George and Wilson's crystallization slot. Since all of the SIC experiments were performed in a single column, the margin and direction of inherent error (22,23) in the B22 data must be the same. This run-to-run error free data suggested a downward peak in B22 at pH 6.5 and 7.6, in which B22 values were minimal at 0.17 M NaCl. The B22 values were slightly negative in these conditions. Overall B22 mapping in NaCl showed that B22 does not depend much on pH at higher ionic strength. This simple B22 mapping in NaCl shows why it was impossible to crystallize IDEC-152 by empirical screening.
FIGURE 3.
B22 profile of IDEC-152 in NaCl at different pHs.
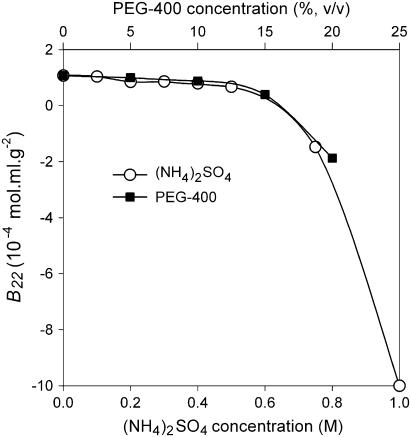
In contrast to NaCl, (NH4)2SO4 and PEG are two well-known precipitants of proteins. Instead of a crystalline solid phase, amorphous precipitates are often observed in the presence of (NH4)2SO4 or PEG. B22 values of MAb as a function of the concentration of these precipitants would also help us achieve a better understanding of protein phase behavior in the presence of these precipitants. Both (NH4)2SO4 and PEG-400 showed similar trends, i.e., an unchanged B22 value up to 0.6 M (NH4)2SO4 and 15% (v/v) PEG-400 (Fig. 4). Above these points, the B22 value decreased dramatically to reach the negative regime of the B22 scale. However, it was impossible to run SIC experiments at higher PEG-400 concentrations. At PEG-400 concentration of >20% (v/v), the solution is too viscous to pump through the chromatography column. On the other hand, the solubility of the MAb was too low to obtain a well distinguishable peak at an (NH4)2SO4 concentration of >1.0 M.
FIGURE 4.
B22 profile of IDEC-152 in (NH4)2SO4 and PEG-400 at pH 7.6.
Phase behavior of the monoclonal antibody
Precipitates of the monoclonal antibody
The solubility of a protein is usually measured by dissolving crystals in a protein-free solution until the concentration of the protein in the liquid phase reaches a constant equilibrium value. Alternatively it is also possible to start with a supersaturated solution, in which the solution reaches equilibrium through the growth of crystals. It typically takes days to months to reach equilibrium (67). Both methods were impossible to implement for IDEC-152, since it has not been possible to crystallize the MAb yet. Although precipitates are generally considered as nonequilibrium phases, the residual protein concentration in the supernatant is widely referred to as the solubility. In this work, solubility was measured by allowing the MAb solutions to precipitate.
When the solution conditions and the initial MAb concentrations were met for the phase separation, precipitates formed immediately. In some experimental conditions, the immediately appearing precipitates dissolved during 48 h of incubation with shaking. The conditions at which the precipitates did not dissolve showed two distinct phases, a clear solution phase on the top and a white precipitate phase on the bottom. Under light microscope, the precipitates were characterized as fibril-like opaque. The obtained precipitates were reversible, and they could be driven to redissolve by addition of solvent. The MAb concentration in the supernatant was found to be independent of the initial protein concentration within the limits of the experimental error of 10%, consistent with observations with lysozyme solutions (68,69). In contrast, the apparent solubility of α-chymotrypsin, bovine serum albumin, and bovine liver catalase in precipitation experiments have been reported to be functions of the initial protein concentration (68,70). The MAb concentration in the supernatant also showed a smooth decrease with increasing precipitant concentrations. However, if the initial MAb concentrations were too high with respect to the solubility, a sticky gel type of solid phase was formed. No clear solution could be recovered from the top in such circumstances. The characteristics of IDEC-152 precipitates obtained in NaCl, (NH4)2SO4 or PEG-400 were the same. All of these observations during the precipitation of IDEC-152 MAb suggest that there is indeed an equilibrium phase separation, despite the fact that the precipitates are kinetically trapped nonequilibrium phases. However, the solubility obtained from the supernatant concentration may not be equal to the real equilibrium solubility, and therefore it is referred to as “apparent solubility” in this article. Indeed, one would expect a lower supernatant concentration to exist in equilibrium with a crystalline solid phase, as observed for lysozyme (69,71,72).
Phase diagrams of monoclonal antibody
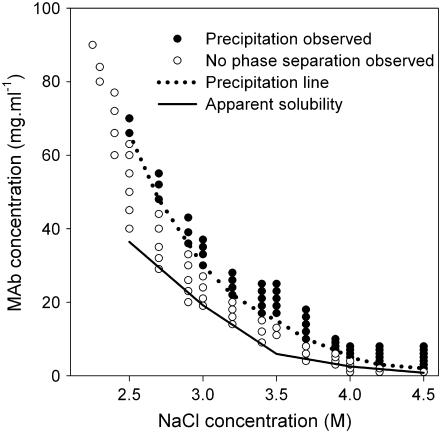
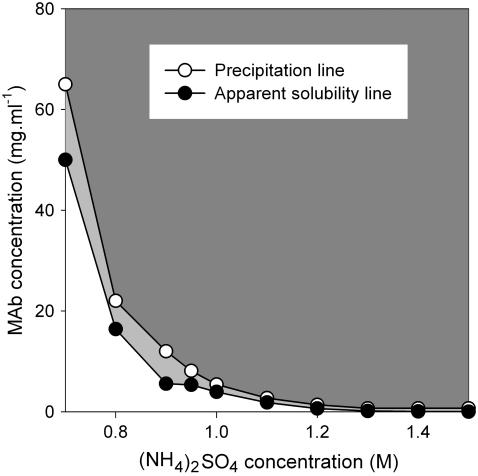
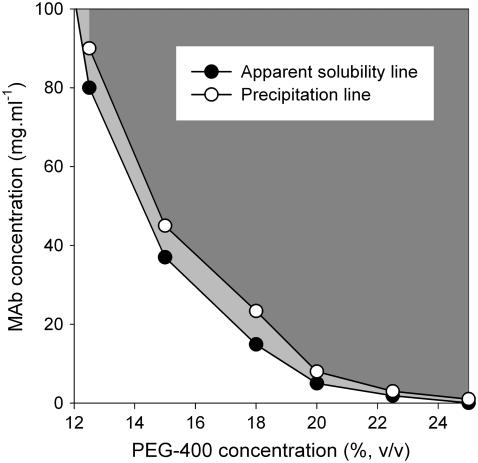
The apparent solubility and precipitation behavior of IDEC-152 was studied as a function of the concentration of three precipitants, NaCl, (NH4)2SO4, and PEG-400, at a constant temperature of 30°C. The apparent solubility was found to decrease smoothly with increasing precipitant concentration for all three precipitants, in accordance with Cohn (73). A series of dilutions was made with varying MAb concentrations around the apparent solubility line. Interestingly, no phase separation was observed up to a certain concentration above the apparent solubility line (Fig. 5). The minimum MAb concentration at which precipitation was observed was designated as the precipitation line in the phase diagram. The MAb solution was completely transparent between the solubility and precipitation lines. It was, however, not possible to differentiate nucleation and growth region in the supersaturated area (74) because of unsuccessful crystal growth. Fig. 5 shows a phase diagram of the IDEC-152 MAb as a function of NaCl concentration. The solubility of the MAb was extremely high up to 2.4 M NaCl. A solid phase was observed at a minimum NaCl concentration of 2.5 M. At 4.5 M NaCl, the solubility of the MAb was extremely low (<1 mg/ml). Phase diagrams were obtained in similar fashion for (NH4)2SO4 (Fig. 6) and PEG-400 (Fig. 7).
FIGURE 5.
Phase behavior of IDEC-152 MAb in NaCl at 30°C and pH 7.6.
FIGURE 6.
Phase behavior of IDEC-152 MAb in (NH4)2SO4 at 30°C and pH 7.6
FIGURE 7.
Phase behavior of IDEC-152 MAb in PEG-400 at 30°C and pH 7.6.
MAb in the framework of universal phase diagram
In this work, phase diagrams of IDEC-152 MAb were obtained as a function of precipitant concentration at a constant temperature of 30°C. One would expect protein phase behavior as a function of a precipitant concentration to be similar to that of the inverse of temperature. However, measurement of the liquid-liquid coexistence curve as a function of precipitant concentration is extremely difficult by the cloud-point method (75,76), because of the difficulty of slowly increasing or decreasing the precipitant concentration while keeping all other parameters constant. In addition, the source of the turbidity in IDEC-152 solutions was mostly due to the formation of precipitates, unlike the liquid droplets observed in a previous study (76). However, Lenhoff and co-workers (69) showed that the supernatant curve of lysozyme obtained from precipitation and cloud-point measurements is consistent with the low-density branch of the metastable liquid-liquid coexistence curve. On the other hand, the formation of the dense branch of the liquid-liquid binodal is perturbed by the appearance of flocks or aggregates. Therefore, gels or precipitates represent a different, but kinetically trapped, structure for the dense liquid phase. The physical appearance of the lysozyme precipitate described in Cheng et al. (69) was similar to that observed in this study. In both cases, the precipitates were opaque and settled at the bottom of the tube. If shaken, it caused the solution to be turbid. The liquid phase concentration was independent of initial protein load, conforming to the pseudoequilibrium. Furthermore, the initial higher load of protein caused the formation of gel in both cases. Therefore, precipitates of MAb can be interpreted as the dense branch of the liquid-liquid binodal. In that case, the dense phase in the liquid-liquid phase separation must be similar to the dense liquid phase described by Prausnitz and co-workers (68,77,78), where precipitates were named as dense liquid phases and protein was treated as the partitioning solute between the liquid and precipitate phases.
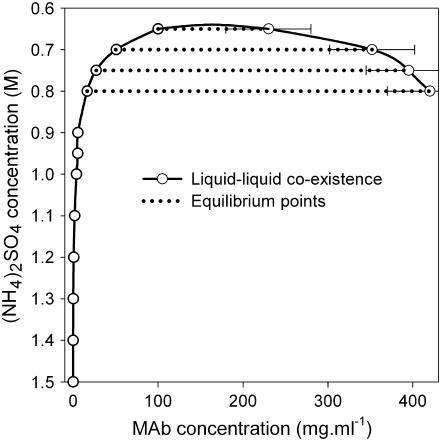
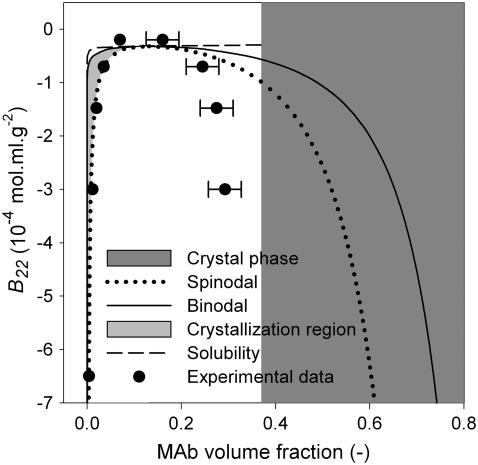
A generic format of phase diagrams was made with the above assumptions. The concentration of MAb in both the supernatant phase (apparent solubility) and the precipitate (dense) phase was plotted against the reverse scale of the (NH4)2SO4 concentration (Fig. 8). The supernatant and precipitate MAb concentrations show an apparent equilibrium curve, which represents the liquid-liquid coexistence curve. Since the crystal-liquid equilibrium solubility curve could not be determined experimentally, the position of the liquid-liquid co-existence curve with respect to the solubility curve cannot be shown directly. However, the position of the liquid-liquid co-existence curve can be visualized by plotting it against B22. Such a phase diagram was generated in B22 scale according to the model described by Haas and Drenth (51–53). The calculated phase diagram (Fig. 9) shows that the critical point is located at a B22 value of −0.32 × 10⁻⁴ mol ml/g2, which corresponds to slightly negative B22 values of George and Wilson's crystallization slot (20,21). Therefore, the calculated phase diagram of MAb is consistent with the fact that the precise location of the nucleation is around the critical point. The crystal-liquid solubility line (Fig. 9, dashed line) is equal to the light branch of the bimodal, for an f value of >0.3217. The phase diagram of MAb is therefore more likely to exhibit a triple point than an isolated crystal-liquid solubility line.
FIGURE 8.
Phase diagram of IDEC-152 MAb showing liquid-liquid coexistence.
FIGURE 9.
Phase diagram of IDEC-152 MAb in the format of a generic protein phase diagram. Calculations were made according to Haas and Drenth (51). Assumptions:  = 1.665 × 10⁻¹⁹ cm3;
  = 0.37; M = 144000 g/mol;
  = 1.4362 g/cm3; f = 0.3217. Existence of binodal and spinodal within the crystal phase is not realistic. However, it is shown to visualize their approximate location.
The experimentally determined liquid-liquid coexistence curve in (NH4)2SO4 concentration scale was transformed into the B22 scale by interpolation, since the B22 values were known as a function of (NH4)2SO4 concentration. The experimental data points of liquid-liquid coexistence are shown in Fig. 9. Although the light branch of the data points matched well with the spinodal, the dense branch showed much lower concentration than theoretical expectation. This is because precipitates are considered the dense phase and the precise determination of the precipitate volume and concentration is difficult. However, the above observations suggest that the MAb, a complex glycoprotein, certainly supports the so-called universal format of phase diagram.
The question arises: why is crystallization of IDEC-152 MAb impossible when the phase diagram supports a generic format? It is obvious from the phase diagram (Fig. 9) that spontaneous classical homogeneous nucleation just above the critical point is not possible for two reasons. First, the critical point corresponds to a protein volume fraction of 0.131 or a concentration of 188 mg/ml. Conducting crystallization experiments above such a high protein concentration is impractical and inapplicable. Second, there is insufficient or no space between the liquid-liquid critical point and the solubility line. The only possible mechanism remaining for nucleation of the MAb is the liquid-liquid phase separation. Therefore, crystallization of MAb is only expected between the light branch of the binodal and spinodal, which might be a very narrow range. A possible reason for unsuccessful crystallization is that even if an experiment is designed between the light branch of the binodal and spinodal, the crystallization process itself might be too slow for crystals to form within a practical time frame. A third reason for unsuccessful crystallization could be the shape of the MAb molecule. A slightly negative B22 value around 0.8 M (NH4)2SO4 could be due to strong attractions in a few specific orientations that are not favorable to solid lattice formation.
CONCLUSION
The work presented here shows a phase behavior study of a complex glycoprotein. Like most well studied proteins, phase behavior of IDEC-152 MAb shows a behavior of decreasing solubility with increasing precipitant concentration, according to Cohn (76). Rescaling of the phase diagram in B22 units shows that spontaneous classical homogeneous nucleation of MAb crystals is not possible just above the liquid-liquid critical point, because of insufficient or no space between the critical point and the solubility line. Nucleation of IDEC-152 MAb could only be possible by liquid-liquid phase separation in a narrow window. However, the idea of a universal protein phase diagram was supported for this large complex glycoprotein. Further study is required on uncommon and structurally complex proteins to understand protein phase behavior in a generalized way. This study further concludes that the crystallization of proteins in (NH4)2SO4 is rather difficult, because both solubility and B22 decrease drastically above a certain (NH4)2SO4 concentration, leaving an extremely narrow window of crystallization.
Editor: Marcia Newcomer.
References
- 1.Pande, A., J. Pande, N. Asherie, A. Lomakin, O. Ogun, J. King, and G. B. Benedek. 2001. Crystal cataracts: human genetic cataract caused by protein crystallization. Proc. Natl. Acad. Sci. USA. 98:6116–6120. [DOI] [PMC free article] [PubMed] [Google Scholar]
- 2.Eaton, W. A., and J. Hofrichter. 1990. Sickle cell hemoglobin polymerization. Adv. Prot. Chem. 40:63–279. [DOI] [PubMed] [Google Scholar]
- 3.Selkoe, D. J. 1994. Alzheimer's disease: a central role for amyloid. J. Neuropathol. Exp. Neurol. 53:438–447. [DOI] [PubMed] [Google Scholar]
- 4.Koo, E. H., P. T. Lansbury, and J. W. Kelly. 1999. Amyloid diseases: abnormal protein aggregation and neurodegeneration. Proc. Natl. Acad. Sci. USA. 96:9989–9990. [DOI] [PMC free article] [PubMed] [Google Scholar]
- 5.Brader, M. L., M. Sukumar, A. H. Pekar, D. S. McClellan, R. E. Chance, D. B. Flora, A. L. Cox, L. Irwin, and S. R. Myers. 2002. Hybrid insulin cocrystals for controlled release delivery. Nat. Biotechnol. 20:800–804. [DOI] [PubMed] [Google Scholar]
- 6.Walter, H., and D. E. Brooks. 1995. Phase separation in cytoplasm, due to macromolecular crowding, is the basis for microcompartmentation. FEBS Lett. 361:135–139. [DOI] [PubMed] [Google Scholar]
- 7.Ostermeier, C., and H. Michel. 1997. Crystallization of membrane proteins. Curr. Opin. Struct. Biol. 7:697–701. [DOI] [PubMed] [Google Scholar]
- 8.Stura, E. A., G. R. Nemerow, and I. A. Wilson. 1992. Strategies in the crystallization of glycoproteins and protein complexes. J. Cryst. Growth. 122:273–285. [Google Scholar]
- 9.Rigaud, J.-L., M. Chami, O. Lambert, D. Levy, and J.-L. Ranck. 2000. Use of detergents in two-dimensional crystallization of membrane proteins. Biochim. Biophys. Acta. 1508:112–128. [DOI] [PubMed] [Google Scholar]
- 10.Harris, L. J., E. Skaletsky, and A. McPherson. 1998. Crystallographic structure of an intact IgG1 monoclonal antibody. J. Mol. Biol. 275:861–872. [DOI] [PubMed] [Google Scholar]
- 11.Payne, W. J., D. L. Marshall, R. K. Shockley, and W. J. Martin. 1988. Clinical laboratory applications of monoclonal antibodies. Clin. Microbiol. Rev. 1:313–329. [DOI] [PMC free article] [PubMed] [Google Scholar]
- 12.Larson, S., J. Day, A. Greenwood, E. Skaletsky, and A. McPherson. 1992. Characterization of crystals of an intact monoclonal antibody from canine lymphoma. J. Mol. Biol. 222:17–19. [DOI] [PubMed] [Google Scholar]
- 13.Stura, E. A., A. C. Satterthwait, J. C. Calvo, and R. S. Stefanko. 1994. Crystallization of an intact monoclonal antibody (4B7) against Plasmodium falciparum malaria with peptides from the Pfs25 protein antigen. Acta Crystallogr. D50:556–562. [DOI] [PubMed] [Google Scholar]
- 14.Harris, L. J., E. Skaletsky, and A. McPherson. 1995. Crystallization of intact monoclonal antibodies. Proteins. 23:285–289. [DOI] [PubMed] [Google Scholar]
- 15.Kuznetsov, W. G., A. J. Malkin, and A. McPherson. 2001. The liquid protein phase in crystallization: a case study-intact immunoglobulins. J. Cryst. Growth. 232:30–39. [Google Scholar]
- 16.Saphire, E. O., P. W. H. I. Parren, C. F. Barbas, D. R. Burton, and I. A. Wilson. 2001. Crystallization and primary structure determination of an intact human immunoglobulin, b12: an antibody that broadly neutralizes primary isolates of HIV-1. Acta Crystallogr. D57:168–171. [DOI] [PubMed] [Google Scholar]
- 17.McPherson, A. 1985. Crystallization of macromolecules: general principles. Methods Enzymol. 114:112–120. [DOI] [PubMed] [Google Scholar]
- 18.Neal, B. L., D. Asthagiri, O. D. Velev, A. M. Lenhoff, and E. W. Kaler. 1999. Why is the osmotic second virial coefficient related to protein crystallization? J. Cryst. Growth. 196:377–387. [Google Scholar]
- 19.McMillan, W. G., and J. E. Mayer. 1945. The statistical thermodynamics of multicomponent systems. J. Chem. Phys. 13:276–305. [Google Scholar]
- 20.George, A., and W. W. Wilson. 1994. Predicting protein crystallization from a dilute solution property. Acta Crystallogr. D50:361–365. [DOI] [PubMed] [Google Scholar]
- 21.George, A., Y. Chiang, B. Guo, A. Arabshahi, Z. Chi, and W. W. Wilson. 1997. Second virial coefficient as predictor in protein crystal growth. Methods Enzymol. 276:100–110. [DOI] [PubMed] [Google Scholar]
- 22.Ahamed, T., M. Ottens, G. W. K. van Dedem, and L. A. M. van der Wielen. 2005. Design of self-interaction chromatography as an analytical tool for predicting protein phase behavior. J. Chromatogr. A. 1089:111–124.. [DOI] [PubMed] [Google Scholar]
- 23.Ahamed, T., M. Ottens, G. W. K. van Dedem, and L. A. M. van der Wielen. 2006. Erratum to “design of self-interaction chromatography as an analytical tool for predicting protein phase behavior”. J. Chromatogr. A. 1115:272. [DOI] [PubMed] [Google Scholar]
- 24.Neal, B. L., D. Asthagiri, and A. M. Lenhoff. 1998. Molecular origins of osmotic second virial coefficients of proteins. Biophys. J. 75:2469–2477. [DOI] [PMC free article] [PubMed] [Google Scholar]
- 25.Rosenbaum, D., P. C. Zamora, and C. F. Zukoski. 1996. Phase behavior of small attractive colloidal particles. Phys. Rev. Lett. 76:150–153. [DOI] [PubMed] [Google Scholar]
- 26.Rosenbaum, D. F., A. Kulkarni, S. Ramakrishnan, and C. F. Zukoski. 1999. Protein interactions and phase behavior: sensitivity to the form of the pair potential. J. Chem. Phys. 111:9882–9890. [Google Scholar]
- 27.Rosenbaum, D. F., and C. F. Zukoski. 1996. Protein interactions and crystallization. J. Cryst. Growth. 169:752–758. [Google Scholar]
- 28.Farnum, M., and C. Zukoski. 1999. Effect of glycerol on interactions and solubility of bovine pancreatic trypsin inhibitor. Biophys. J. 76:2716–2726. [DOI] [PMC free article] [PubMed] [Google Scholar]
- 29.Ho, J. G. S., A. P. J. Middleberg, P. Ramage, and H. P. Kocher. 2003. The likelihood of aggregation during protein renaturation can be assessed using the osmotic second virial coefficient. Protein Sci. 12:708–716. [DOI] [PMC free article] [PubMed] [Google Scholar]
- 30.Chi, E. Y., S. Krishnan, T. W. Randolph, and J. F. Carpenter. 2003. Physical stability of proteins in aqueous solutions: mechanism and driving forces in nonnative protein aggregation. Protein Sci. 20:1325–1336. [DOI] [PubMed] [Google Scholar]
- 31.Valente, J. J., R. W. Payne, M. C. Manning, W. W. Wilson, and C. S. Henry. 2005. Colloidal behavior of proteins: effect of the second virial coefficient on solubility, crystallization and aggregation of proteins in aqueous solution. Curr. Pharm. Biotechnol. 6:427–436. [DOI] [PubMed] [Google Scholar]
- 32.Ahamed, T., M. Ottens, B. K. Nfor, G. W. K. van Dedem, and L. A. M. van der Wielen. 2006. A generalized approach to thermodynamic properties of biomolecules for use in bioseparation process design. Fluid Phase Equilib. 241:268–282. [Google Scholar]
- 33.Curtis, R. A., and L. Lue. 2006. A molecular approach to bioseparations: protein-protein and protein-salt interactions. Chem. Eng. Sci. 61:907–923. [Google Scholar]
- 34.Blanch, H. W., J. M. Prausnitz, R. A. Curtis, and D. Bratko. 2002. Molecular thermodynamics and bioprocessing: from intracellular event to bioseparations. Fluid Phase Equilib. 194–197:31–41. [Google Scholar]
- 35.van der Wielen, L. A. M., and E. S. J. Rudolph. 1999. On the generalization of thermodynamic properties for selection of bioseparation processes. J. Chem. Technol. Biotechnol. 74:275–283. [Google Scholar]
- 36.Przybycien, T. M. 1998. Protein-protein interactions as a means of purification. Curr. Opin. Biotechnol. 9:164–170. [DOI] [PubMed] [Google Scholar]
- 37.Tessier, P. M., A. M. Lenhoff, and S. I. Sandler. 2002. Rapid measurement of protein osmotic second virial coefficients by self-interaction chromatography. Biophys. J. 82:1620–1631. [DOI] [PMC free article] [PubMed] [Google Scholar]
- 38.Tessier, P. M., S. D. Vandrey, B. W. Berger, R. Pazhianur, S. I. Sandler, and A. M. Lenhoff. 2002. Self-interaction chromatography: a novel screening method for rational protein crystallization. Acta Crystallogr. D58:1531–1535. [DOI] [PubMed] [Google Scholar]
- 39.Tessier, P. M., H. R. Johnson, R. Pazhianur, B. W. Berger, J. L. Prentice, B. J. Bahnson, S. I. Sandler, and A. M. Lenhoff. 2003. Predictive crystallization of ribonuclease A via rapid screening of osmotic second virial coefficients. Proteins. 50:303–311. [DOI] [PubMed] [Google Scholar]
- 40.Garcia, C. D., S. C. Holman, C. S. Henry, and W. W. Wilson. 2003. Measuring protein interactions by microchip self-interaction chromatography. Biotechnol. Prog. 19:575–579. [DOI] [PubMed] [Google Scholar]
- 41.Garcia, C. D., D. J. Hadley, W. W. Wilson, and C. S. Henry. 2003. Screening of protein-ligand interactions by affinity chromatography. Biotechnol. Prog. 19:1006–1010. [DOI] [PubMed] [Google Scholar]
- 42.Teske, C. A., H. W. Blanch, and J. M. Prausnitz. 2004. Measurement of lysozyme-lysozyme interactions with quantitative affinity chromatography. J. Phys. Chem. B. 108:7437–7444. [Google Scholar]
- 43.Berger, B. W., C. J. Blamey, U. P. Naik, B. J. Bahnson, and A. M. Lenhoff. 2005. Roles of additives and precipitants in crystallization of calcium- and integrin-binding protein. Cryst. Growth Des. 5:1499–1507. [Google Scholar]
- 44.Berger, B. W., C. M. Gendron, M. Colleen, R. R. Clifford, E. W. Kaler, and A. M. Lenhoff. 2005. The role of proteins and surfactant interactions in membrane-protein crystallization. Acta Crystallogr. D61:724–730. [DOI] [PubMed] [Google Scholar]
- 45.Valente, J. J., K. S. Verma, M. C. Manning, W. W. Wilson, and C. S. Henry. 2005. Second virial coefficient studies of cosolvent-induced protein self-interaction. Biophys. J. 89:4211–4218. [DOI] [PMC free article] [PubMed] [Google Scholar]
- 46.Curtis, R. A., R. S. Pophale, and M. W. Deem. 2006. Monte Carlo simulations of the homopolypeptide pair potential of mean force. Fluid Phase Equilib. 241:354–367. [Google Scholar]
- 47.Vliegenthart, G. A., and H. N. W. Lekkerkerker. 2000. Predicting the gas-liquid critical point from the second virial coefficient. J. Chem. Phys. 112:5364–5369. [Google Scholar]
- 48.Reference deleted in proof.
- 49.Reference deleted in proof.
- 50.Reference deleted in proof.
- 51.Haas, C., and J. Drenth. 1998. The protein-water phase diagram and the growth of protein crystals from aqueous solution. J. Phys. Chem. B. 102:4226–4232. [Google Scholar]
- 52.Haas, C., and J. Drenth. 1999. Understanding protein crystallization on the basis of the phase diagram. J. Cryst. Growth. 196:388–394. [Google Scholar]
- 53.Haas, C., and J. Drenth. 2000. The interface between a protein crystal and an aqueous solution and its effect on nucleation and crystal growth. J. Chem. Phys. B. 104:368–377. [Google Scholar]
- 54.Curtis, R. A., H. W. Blanch, and J. M. Prausnitz. 2001. Calculation of phase diagrams for aqueous protein solutions. J. Phys. Chem. B. 105:2445–2452. [Google Scholar]
- 55.ten Wolde, P. R., and D. Frenkel. 1997. Enhancement of protein crystal nucleation by critical density fluctuation. Science. 277:1975–1978. [DOI] [PubMed] [Google Scholar]
- 56.ten Wolde, P. R., and D. Frenkel. 1999. Enhanced protein crystallization around the metastable critical point. Theor. Chem. Acc. 101:205–208. [Google Scholar]
- 57.Talanquer, V., and D. W. Oxtoby. 1998. Crystal nucleation in the presence of a metastable critical point. J. Chem. Phys. 109:223–227. [Google Scholar]
- 58.Galkin, O., and P. G. Vekilov. 2000. Control of protein crystal nucleation around the metastable liquid-liquid phase boundary. Proc. Natl. Acad. Sci. USA. 97:6277–6281. [DOI] [PMC free article] [PubMed] [Google Scholar]
- 59.Lomakin, A., N. Asherie, and G. B. Benedek. 2003. Liquid-solid transitions in nuclei of protein crystals. Proc. Nat. Acad. Sce. USA. 100:10254–10257. [DOI] [PMC free article] [PubMed] [Google Scholar]
- 60.Sear, R. P. 1999. Phase behavior of a simple model of globular proteins. J. Chem. Phys. 111:4800–4806. [Google Scholar]
- 61.Naro, M. G., N. Kern, and D. Frenkel. 1999. The role of long-range forces in the phase behavior of colloids and proteins. Europhys. Lett. 48:332–338. [Google Scholar]
- 62.Muschol, M., and F. Rosenberger. 1997. Liquid-liquid phase separations in supersaturated lysozyme solutions and associated precipitate formation/crystallization. J. Chem. Phys. 107:1953–1962. [Google Scholar]
- 63.Foffi, G., G. D. McCullagh, A. Lawlor, E. Zaccarelli, K. A. Dawson, F. Sciortino, P. Tartaglia, D. Pini, and G. Steel. 2002. Phase equilibria and glass transition in colloidal systems with short-ranged attractive interactions: application to protein crystallization. Phys. Rev. E. 65:031407. [DOI] [PubMed] [Google Scholar]
- 64.Smith, P. K., R. I. Krohn, G. T. Hermason, A. K. Malia, F. H. Gartner, M. D. Provenzano, E. K. Fujimoto, N. M. Goeke, B. J. Olson, and D. C. Klenk. 1985. Measurement of protein using bicinchoninic acid. Anal. Biochem. 150:76–85. [DOI] [PubMed] [Google Scholar]
- 65.Plant, A. L., L. Locascio-Brown, W. Haller, and R. A. Durst. 1991. Immobilization of binding proteins on nonporous supports: comparison of protein loading, activity, and stability. Appl. Biochem. Biotechnol. 30:83–98. [DOI] [PubMed] [Google Scholar]
- 66.Harris, L. J., S. B. Larson, K. W. Hasel, and A. McPherson. 1997. Refined structure of an intact IgG2a monoclonal antibody. Biochemistry. 36:1581–1597. [DOI] [PubMed] [Google Scholar]
- 67.Akata, M. 1993. Protein crystal growth: An approach based on phase diagram determination. Phase Transit. 45:205–219. [Google Scholar]
- 68.Shih, Y.-C., J. M. Prausnitz, and H. W. Blanch. 1992. Some characteristics of protein precipitation by salts. Biotechnol. Bioeng. 40:1155–1164. [DOI] [PubMed] [Google Scholar]
- 69.Cheng, Y.-C., R. F. Lobo, S. I. Sandler, and A. M. Lenhoff. 2006. Kinetics and equilibria of lysozyme precipitation and crystallization in concentrated ammonium sulfate solutions. Biotechnol. Bioeng. 94:177–188. [DOI] [PubMed] [Google Scholar]
- 70.Iyer, H. V., and T. M. Przybicien. 1994. Protein precipitation: effect of mixing on protein solubility. AIChE J. 40:349–360. [Google Scholar]
- 71.Howard, H. V., P. J. Twigg, J. K. Baird, and E. J. Meehan. 1988. The solubility of hen- egg white lysozyme. J. Cryst. Growth. 90:94–104. [Google Scholar]
- 72.Moretti, J. J., S. I. Sandler, and A. M. Lenhoff. 2000. Phase equilibria in the lysozyme-ammonium sulfate-water system. Biotechnol. Bioeng. 70:498–506. [DOI] [PubMed] [Google Scholar]
- 73.Cohn, E. J. 1925. The physical chemistry of proteins. Physiol. Rev. 5:349–438. [Google Scholar]
- 74.Chayen, N. E. 2005. Methods for separating nucleation and growth in protein crystallization. Prog. Biophys. Mol. Biol. 88:329–337. [DOI] [PubMed] [Google Scholar]
- 75.Liu, C., N. Asherie, A. Lomakin, J. Pande, O. Ogun, and G. B. Benedek. 1996. Phase separation in aqueous solutions of lens γ-crystallins: special role of γs. Proc. Natl. Acad. Sci. USA. 93:377–382. [DOI] [PMC free article] [PubMed] [Google Scholar]
- 76.Asherie, N. 2004. Protein crystallization and phase diagrams. Methods. 34:266–272. [DOI] [PubMed] [Google Scholar]
- 77.Coen, C. J., H. W. Blanch, and J. M. Prausnitz. 1995. Salting-out of aqueous proteins: phase equilibria and intermolecular potentials. AIChE J. 41:996–1004. [Google Scholar]
- 78.Coen, C. J., J. M. Prausnitz, and H. W. Blanch. 1997. Protein salting out: phase equilibria in two protein systems. Biotechnol. Bioeng. 53:567–574. [DOI] [PubMed] [Google Scholar]


