Abstract
The P2Y11-R (P2Y11 receptor) is a less explored drug target. We computed an hP2Y11-R (human P2Y11) homology model with two templates, bovine-rhodopsin (2.6 Å resolution; 1 Å=0.1 nm) and a hP2Y1–ATP complex model. The hP2Y11-R model was refined using molecular dynamics calculations and validated by virtual screening methods, with an enrichment factor of 5. Furthermore, mutational analyses of Arg106, Glu186, Arg268, Arg307 and Ala313 confirmed the adequacy of our hP2Y11-R model and the computed ligand recognition mode. The E186A and R268A mutants reduced the potency of ATP by one and three orders of magnitude respectively. The R106A and R307A mutants were functionally inactive. We propose that residues Arg106, Arg268, Arg307 and Glu186 are involved in ionic interactions with the phosphate moiety of ATP. Arg307 is possibly also H-bonded to N6 of ATP via the backbone carbonyl. Activity of ATP at the F109I mutant revealed that the proposed π-stacking of Phe109 with the adenine ring is a minor interaction. The mutation A313N, which is part of a hydrophobic pocket in the vicinity of the ATP C-2 position, partially explains the high activity of 2-MeS-ATP at P2Y1-R as compared with the negligible activity at the P2Y11-R. Inactivity of ATP at the Y261A mutant implies that Tyr261 acts as a molecular switch, as in other G-protein-coupled receptors. Moreover, analysis of cAMP responses seen with the mutants showed that the efficacy of coupling of the P2Y11-R with Gs is more variable than coupling with Gq. Our model also indicates that Ser206 forms an H-bond with Pγ (the γ-phosphate of the triphosphate chain of ATP) and Met310 interacts with the adenine moiety.
Keywords: ligand binding, molecular dynamics, mutagenesis, nucleotide receptor, P2Y receptor, virtual screening
Abbreviations: ATP[S], adenosine 5′-[γ-thio]triphosphate; b-rhodopsin, bovine-rhodopsin; [Ca2+]i, intracellular Ca2+ concentration; EF, enrichment factor; EIA, enzyme-linked immunoassay; EL, extracellular loop; fura 2/AM, fura 2 acetoxymethyl ester; GFP, green fluorescent protein; GPCR, G-protein-coupled receptor; P2Y-R, P2Y receptor; hP2Y-R, human P2Y-R; P2Y11-R, P2Y11 receptor; hP2Y11-R, human P2Y11 receptor; MD, molecular dynamics; TM, transmembrane
INTRODUCTION
P2 receptors are activated by extracellular nucleotides [1]. These receptors are divided into two groups: ligand-gated cation channels, classified as P2X receptors [2], and the P2Y-Rs (P2Y receptors), coupled with G-proteins [3]. P2Y-Rs can be further subdivided into two phylogenetic groups. One group comprises the hP2Y1,2,4,6,11-Rs that are coupled mainly with phospholipase C. In the second group consisting of the hP2Y12,13,14-Rs, the inhibition of adenylate cyclase is triggered. hP2Y12,13 are classical nucleotide receptors, whereas hP2Y14 is activated by UDP-glucose [4]. The hP2Y11-R (human P2Y11 receptor), however, is coupled with stimulation of both the adenylate cyclase and the phospholipase C pathways [5]. This is a unique feature among the P2Y-R family.
Out of the first P2Y-R subgroup, the hP2Y1-R and hP2Y11-R are exclusively activated by adenine nucleotides, ATP and ADP [5,6], whereas the P2Y4,6-Rs prefer uracil nucleotides [7]. Specifically, the hP2Y6-R is selectively activated by UDP, and the hP2Y4-R is activated mainly by UTP. The hP2Y2-R seems not to discriminate between purine or pyrimidine nucleotides and is stimulated equipotently by ATP and UTP (see references cited in [8]).
Unlike the hP2Y1-R, which is the most thoroughly investigated hP2Y-R (human P2Y receptor), its closest homologue, the hP2Y11-R, sharing 33% identity, has been far less studied [5]. To date, no mutational analyses of the hP2Y11-Rs were reported. Likewise, the hP2Y11-R has been scarcely studied by computational methods [9].
The hP2Y1-R was modelled extensively by Moro et al. [10,11]. These computational studies, supported by mutational analyses, suggested the residues involved in ligand binding. Arg128, Tyr136, Lys280 and Arg310 were reported to interact with the ATP phosphate moiety, while Ser314 and Arg310 were believed to interact with the adenine moiety. These authors also proposed His132, His277 and Ser317 to be involved in H-bonds with the sugar moiety [10]. The homology model of the hP2Y1-R described by Moro et al. [10] was based on a b-rhodopsin (bovine-rhodopsin) template and subsequently refined using a cross-docking approach.
Different computational and optimization techniques were applied later by Major et al. [12,13] for the modelling of the hP2Y1-R. Thus we performed the optimization of the hP2Y1-R model in an explicitly hydrated lipid bilayer (triphasic system) [12]. The binding pocket in the hP2Y1-R model was then optimized using a Monte Carlo and MD (molecular dynamics) protocol. In this way, we could explain not only the molecular recognition determinants of ATP and synthetic analogues, but we also provided an explanation for the hP2Y1-R diastereoselectivity [13].
The P2Y-R family is the subject of intense ongoing investigations because of its important influence in physiological processes and involvement in various diseases, varying from cystic fibrosis [14] to platelet secretion and aggregation disorders [15]. Specifically, the hP2Y11-R was reported to play roles in the treatment of neutropenia [16], acute myocardial infarcts [17] and in the maturation process of dendritic cells [18].
In the present study, we aimed to provide an accurate model of the hP2Y11-R supported by mutational analyses to open the possi-bility of designing specific ligands for this receptor. By means of these investigations, we provide an insight into the ligand-binding determinants of the hP2Y11-R. The proposed ligand recognition mode is consistent with the pharmacological data.
MATERIALS AND METHODS
Alignment
Multiple sequence alignment involving hP2Y11-R has been performed using the ClustalW software [19]. The alignment included the following sequences originating from the NCBI database: hP2Y1-R (gi:4505557), hP2Y2-R (gi:28872720), hP2Y4-R (gi:4505561), hP2Y6-R (gi:14424758), hP2Y11-R (gi:21263830) and b-rhodopsin (gi:129204) (NCBI; http://www.ncbi.nlm.nih.gov/).
Modelling
Both the b-rhodopsin crystallographic structure at 2.6 Å resolution (1 Å=0.1 nm) [21] and the hP2Y1-R–ATP complex model [12], constructed previously, were used as templates to construct the hP2Y11-R model. A set of 200 models with different energies was generated using the Modeler software [22], and the best one was selected. The models did not include any of the hP2Y11-R's loops. Structural features known to be conserved, in GPCRs (G-protein-coupled receptors) in general or in the hP2Y-R subfamily in particular, have been introduced by using constraints during the construction of the hP2Y11-R model. Thus an ionic bridge, Asp196 and Arg275 in the hP2Y11-R [11], was constrained. In addition, the TM (transmembrane) backbones were constrained as α-helices to remove helical kinks specific to b-rhodopsin. Additional α-helical constraints were introduced near the extra- and intracellular sides of the helices. These constraints prevent the helices from unwinding during optimization procedures in the building protocol of Modeler.
Model refinement
The best model obtained from the homology modelling was used here as a starting co-ordinated set. The receptor model consists of the helical bundle and the ATP molecule. Harmonic constraints (factor 15) have been imposed on the dihedral angles of the peptide backbone. The dihedrals from the proline residues in all TMs have not been included in these constraints. A distance constraint was used in all MD simulations, which prevented the ATP molecule from flipping or floating out of its binding pocket. The helices' extremities were capped using an acetyl group for C-termini and methyl for the N-termini. A blocking method was adopted to remove interactions between the helices' termini and between some residues and the ATP molecule. The model was first subjected to an extensive minimization using a combination of the steepest descent and conjugated derivatives algorithm (with energy tolerance 0.0001 kcal/mol; 1 cal≈4.184 J).
All MD calculations performed here use the Velocity Verlet integration algorithm as implemented in CHARMM (developmental version 31b1). The minimized model was heated from 0 K up to 300 K for 9 ps with a 5 K increment every 100 time steps (time step=0.0015 ps). It was then subjected to a 150 ps simulation. The latter was concluded with a minimization using the steepest descent algorithm with a 0.001 kcal/mol energy tolerance.
The receptor relaxation could be easily monitored when tracking the overall system energy. No trajectory post-processing was done. The relaxed receptor, except the binding pocket, was then constrained. The radius pattern surrounding the ATP molecule followed a 6 Å–10 Å–∞ scheme (free–constrained–fixed). The ligand–receptor complex was heated from 0 to 900 K for 27 ps with a 5 K increment every 100 time steps (time step=0.0015 ps) followed by 300 ps of simulation.
In order to retrieve relevant parameter values, the simulation was quenched using a steepest descent minimization with 0.001 kcal/mol energy tolerance for every recorded frame. Interaction energies between the ATP molecule and selected residues were extracted as well as the overall energy. The interval of the investigated frames counted 600 integration steps.
Average structure
An average structure of the three most stable structures encountered during the simulation was calculated using the BLOCK facility in CHARMM [23] and further minimized with an energy tolerance of 0.0001 kcal/mol.
Model validation
The calculated hP2Y11-R model was validated: (i) by inspection of the geometrical parameters using the Ramachandran plot and (ii) by virtual screening.
(i) The geometric parameters of the hP2Y11-R model were revised using the Ramachandran plot generated by ProCheck software [24]. More than 99% of residues were classified in allowed regions, leaving one out of a total of 203 residues in a disallowed region.
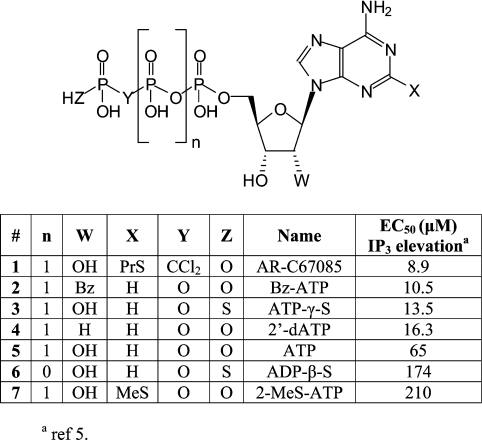
(ii) The compound library created for the virtual screening included the following: seven known hP2Y11-R agonists (Figure 2) constructed and further optimized at AM1 level using the Gaussian98 [25]; a set of 42 nucleotides downloaded at random from the ChemBank online database (http://chembank.med.harvard.edu) (see Supplementary material at http://www.BiochemJ.org/bj/405/bj4050277add.htm); and the drug-like compounds library proposed by Accelrys (http://www.accelrys.com/reference/cases/studies/randomset.html), which contains 970 molecules.
Figure 2. A list of known hP2Y11-R agonists with respective EC50 values for Ins(1,4,5)P3 (IP3) elevation, as reported by Communi et al. [5].
The volume of the hP2Y11-R-binding pocket was defined by the ATP molecule calculated based on the previously reported hP2Y1-R–ATP complex model [12]. The model was subjected to Surflex [28] routines in order to characterize the binding pocket (creating the ‘protomol’ using default parameters). The entire compound library was docked in the hP2Y11-R model, using Surflex software [28]. The resulting output was processed using advised parameter values (1.0 polarity penalty threshold; –3.0 penetration penalty threshold; 100 maximum allowed rotatable bonds, as proposed by the Surflex documentation). The aptitude of the virtual screening expressed in terms of EF (enrichment factor). The EF is the ratio of the database percentage containing the target molecules before (100%) and after ranking (DB%).
 |
Mutagenesis analysis
Site-directed mutagenesis was performed using the QuikChange® site-directed mutagenesis kit (Stratagene, La Jolla, CA, U.S.A.). The DNA sequence of the hP2Y11-R (GenBank®/EBI accession number AF030335) was kindly provided by Dr Didier Communi [Institut de Recherche Interdisciplinaire en Biologie humaine et Moleculaire (IRIBHM), Université Libre de Bruxelles, Brussels, Belgium] and placed between the EcoRI/BamHI restriction sites of the eGFPN1 vector (Clontech, Heidelberg, Germany). The mutations were introduced using customized oligonucleotides (Qiagen, Hilden, Germany) and confirmed by DNA sequencing. The P2Y11–GFP (green fluorescent protein) receptor DNA and DNA carrying the respective mutation were used to transfect 1321N1 human astrocytoma cells. Cells were grown at 37°C in 10% CO2 in high-glucose DMEM (Dulbecco's modified Eagle's medium) supplemented with 5% (v/v) foetal calf serum, 100 units/ml penicillin, 100 i.u. (international units)/ml streptomycin (Seromed; Biochrom, Berlin, Germany) and transfected with the recombinant plasmids using FuGENE™ 6 transfection reagent (FuGENE™/DNA ratio 3:2) as given in the manufacturer's protocol (Roche, Mannheim, Germany). Transfected cells were selected with 0.5 mg/ml G418 (Calbiochem, La Jolla, CA, U.S.A.) for stable expression of the wild-type and mutant receptors.
Stably transfected cells were plated on glass coverslips (Ø=22 mm; OmniLab, Bremen, Germany), and single cell measurement was done after 3 days, when the cells were 30–50% confluent. The changes in free intracellular Ca2+ concentration ([Ca2+]i) were measured, as described previously [29] using the calcium indicator fura 2/AM [fura 2 acetoxymethyl ester; Biomol (Hamburg, Germany)/Molecular Probes] and recording the change in fluorescence intensity after stimulation with various agonists (Sigma, Deisenhofen, Germany). The cells were imaged with a system from TILL Photonics (München, Germany) using a ×40 oil immersion objective and a flow rate of 1 ml/min in a recording chamber containing 0.2 ml [30]. Calcium data were analysed with the Excel program applying basal deduction to the calcium traces and calculating the peak height for each cell. Concentration–response data obtained with average values from 40 to 70 single cells were further analysed to derive EC50 values using the SigmaPlot program (Systat, Erkrath, Germany). Calculation of the EC50 values and curve fitting were performed using the following equation with a standard slope:
 |
where the maximal response (Rmax) was adjusted to the top plateau of the ATP curve.
For cAMP measurements, stably transfected cells were seeded in 6-well plates at a density of 100 000 cells per well and grown for 2 days until 80% confluency was reached. Prior to stimulation, the medium was aspirated and replaced by Na-HBS buffer (Hepes-buffered saline: 145 mM NaCl, 5.4 mM KCl, 1.8 mM CaCl2, 1 mM MgCl2, 25 mM glucose and 20 mM Hepes/Tris, pH 7.4) containing 0.5 M IBMX (isobutylmethylxanthine) and 1 μM DPSPX (1,3-dipropyl-8-sulfophenyl-xanthine) an A1/A2 receptor antagonist. After a 30 min incubation at 37°C in this buffer, cells were stimulated with ATP for 10 min. After stimulation, the buffer was aspirated and cells were washed with PBS and lysed with 0.1 M HCl containing 0.05% Triton X-100. Lysates were harvested and a 100 μl aliquot kept for protein estimation. Tubes were centrifuged at 1000 g for 10 min and supernatants were directly used for the assay. Determination of intracellular cAMP was done using the Direct cAMP EIA (enzyme-linked immunoassay) kit (Assay Designs, Ann Arbor, MI, U.S.A.). Data were analysed using GraphPad Prism.
The expression levels of wild-type and mutant receptors were analysed by flow cytometry using a FACS LSR (BD Biosciences, Heidelberg, Germany). Cells were grown in 5 cm culture dishes (Nunc, Wiesbaden, Germany) to 80% confluency, harvested, and resuspended in culture medium. The expression levels of 10000 cells were analysed by determining the mean intensity (geometric median) of the GFP fluorescence per cell using the FlowJo software.
RESULTS AND DISCUSSION
Similarity and identity of hP2Y11-R and hP2Y1-R, and modelling of the hP2Y11-R
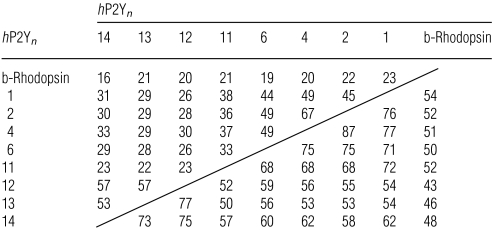
The human (h)P2Y11-R is characterized by considerably larger second and third ELs (extracellular loops) (EL2 and EL3 respectively) as compared with other hP2Y-R subtypes and b-rhodopsin (e.g. 35 versus 25 amino acids for EL2, and 31 versus 22 amino acids for EL3, as compared with the hP2Y1-R). b-Rhodopsin and the hP2Y11-R share 21% sequence identity and 52% similarity in the TM domains, whereas the hP2Y1-R shares 38% identity and 72% similarity with the hP2Y11-R in the TM domains (Table 1). The amino acid sequence of the hP2Y11-R exhibits 33% overall amino acid identity with the hP2Y1 receptor, its closest homologue.
Table 1. Identity (upper triangle) and similarity (lower triangle) percentages between various hP2Y-Rs (number n) and b-rhodopsin for the TM domains only.
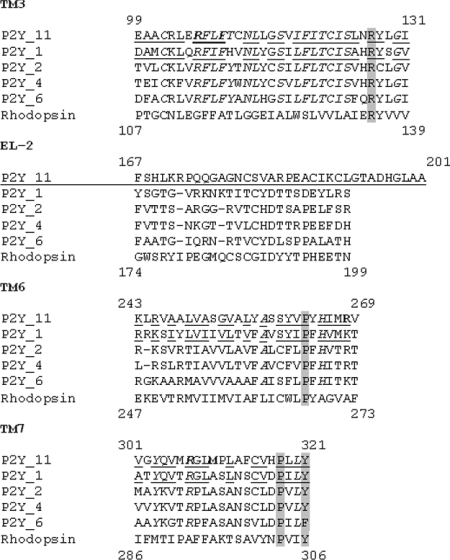
To model the hP2Y11-R we first aligned the hP2Y11-R TM regions with multiple sequences: b-rhodopsin and the hP2Y1,2,4,6-Rs. The alignment in the TM domains has no gaps except for a single residue gap that was introduced in the beginning of TM6 (Figure 1). This negligible gap is far away from the putative binding site (see below) and is located at the flexible TM extremity. All the conserved residues of the GPCR family A, as mentioned by Mirzadegan et al. [31], were aligned correctly. This includes highly conserved residues as well as residues related to the known GPCR patterns such as (E/D)RY in TM3 and NPXXY in TM7 (Figure 1) [31].
Figure 1. Alignment of hP2Y-R domains that comprise the binding pocket.
Code: grey highlight, residues that are conserved in all GPCRs; italic letters, conserved in all hP2Y-R; underlined, identical/similar in hP2Y1,11-R; boldface, residues proposed to be involved in ligand binding at the hP2Y11-R. (See also Supplementary material for a colour-coded image.)
The model computed here for the hP2Y11-R did not include any loops, as opposed to our previously reported hP2Y1-R model [12]. This is due to the very flexible nature of the loops that prevents their accurate modelling. Furthermore, EL2 and EL3 in the hP2Y11-R are significantly longer (9 and 19 amino acids respectively) than those of b-rhodopsin and many related GPCRs [9]. Therefore alignment and modelling of these loops are certainly unreliable. Computational study of only the helical bundle of GPCRs has become a well-established procedure [32]. b-Rhodopsin at 2.6 Å resolution [21] was used as a template to calculate the hP2Y11-R model, despite the relatively low overall identity (<20%). Moreover, the hP2Y1-R–ATP complex model [12] was used as an additional template, because of the high homology of the hP2Y1-R with the hP2Y11-R. The need for this model as a template arises as the experimental data (e.g. mutational analysis and pharmacological data) are scarce for the hP2Y11-R, unlike for the hP2Y1-R. Furthermore, the hP2Y11-R-bound ATP was modelled based on hP2Y1-R-bound ATP positioning [12].
In order to obtain sufficiently accurate GPCR models, extensive optimization protocols are required. Therefore our model was further subjected to a two-stage MD optimization protocol. At first, we optimized the helical bundle of the model by subjecting it to MD simulation without constraining the structure. The MD simulation lasted 150 ps. In the first 70 ps a full relaxation of the model by 300 kcal/mol occurred. Previously reported MD simulation of the hP2Y11-R [9] lasted only 50 ps, which we have found insufficient for a full relaxation of the receptor. The structural nuances that distinguish even closely related proteins are of utmost importance when e.g. subtype receptor selectivity has to be considered, which is the case here. The MD relaxation protocol lets those nuances come into play as we have demonstrated for the closely related hP2Y1-R and hP2Y11-R.
In the next step, the model was fixed while only the binding pocket area with a bound ATP molecule was subjected to a quenched dynamics simulation. The simulation revealed that the residues involved in ATP recognition have favourable interaction energies. Out of this simulation an average hP2Y11-R–ATP structure was extracted.
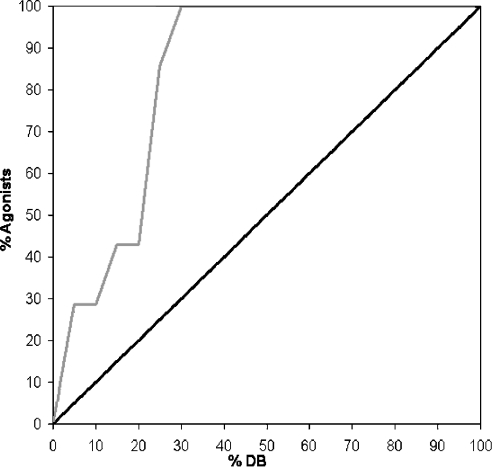
To validate the calculated hP2Y11-R models, they were subjected to a virtual screening study. This study used hP2Y11-R agonists [5] (Figure 2) as target molecules and a random nucleotides library (Supplementary material) as well as a random drug-like set of molecules as decoy molecules (Accelrys: http://www.accelrys.com/reference/cases/studies/randomset.html). When testing the agonist discrimination capabilities of the homology structure, the enrichment factor was 4. The average hP2Y11-R structure model, calculated from the MD refinement protocols, had an improved agonist discrimination, which was quantified by an enrichment factor of approx. 5 (Figure 3), thus validating the calculated hP2Y11-R model.
Figure 3. Results of virtual screening of the drug-like compounds, random nucleotides and hP2Y11-R agonists data sets on the hP2Y11-R model.
An enrichment factor of 5 was obtained, thus validating the calculated hP2Y11-R model. Black line, random ligand recovery; grey line, enrichment obtained with the hP2Y11-R model.
Characteristics of the hP2Y11-R helical bundle
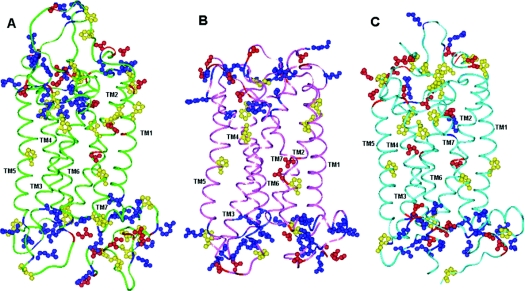
A multitude of positively charged amino acid residues in the ELs and at the ends of the TM helices are apparently unique for the hP2Y-R family (Figure 4). Together, the positively charged residues in the ELs may play a role in guiding the negatively charged nucleotide ligand into the binding site, as suggested by Moro et al. [11]. The hP2Y11-R contains 27 proline residues in total and 11 of them are located in the TM regions. TM3 is the only TM domain without a proline residue. The hP2Y11-R-unique Pro311 residue replaces a highly conserved serine residue in the other hP2Y-Rs. Unlike this conserved serine residue, Pro311 is not involved in ligand recognition.
Figure 4. (A) hP2Y11-R model, (B) hP2Y1-R model and (C) b-rhodopsin.
Residue colour code: blue, arginine and lysine; red, aspartic acid and glutamic acid; yellow, proline. Loops of the hP2Y11-R were not modelled accurately.
The conserved proline residues of GPCRs in TM6 and TM7 are present in both the hP2Y1-R and the hP2Y11-R (Figure 1). The kink induced by the highly conserved proline residue in TM6 has a pivotal role in GPCR activation and is involved in TM6 conformational change [33].
One of the most conserved patterns in GPCRs is the TM7 (N/D)PXXY motif present at the intracellular end. The mutation of the aspartic acid residue or the asparagine residue was shown to affect the activation of phospholipase C and the adenylate cyclase pathway. For instance, the mutation N322A in the β2-adrenergic receptor resulted in complete uncoupling of the receptor [34]. Furthermore, Gales et al. [35] demonstrated for the cholecystokinin-B GPCR that the Asn391 residue of the NPXXY motif plays an essential role in the activation of the Gα-protein [35].
The pattern occurring in hP2Y1,2,4,6-Rs is DPXXY. Interestingly enough, in the hP2Y11-R this pattern has not been conserved. Instead, one finds the segment HPXXY. This unique motif may imply an alternative G-protein activation mechanism and thus requires further investigation.
The hP2Y11-R-binding pocket and ATP-binding mode
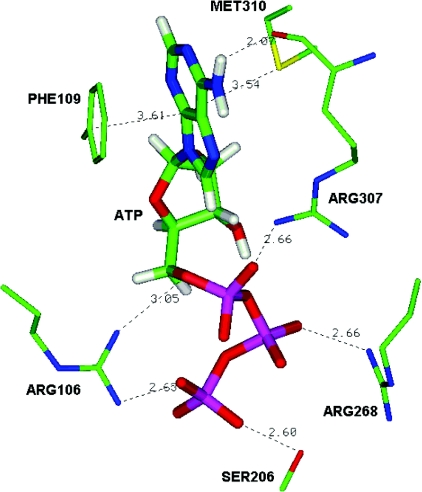
The hP2Y11-R amino acid residues interacting with the ATP molecule include Arg106, Phe109, Ser206, Arg268, Arg307 and Met310 (Table 2; Figure 5). The three positively charged residues probably interact electrostatically with the triphosphate moiety, while Ser206 may form an H-bond with Pγ. The adenine moiety possibly interacts with Phe109 via π-stacking interactions, as was observed for the hP2Y1-R–ATP complex model. A suspected unique interaction of the hP2Y11-R with the adenine moiety involves Met310. Bivalent sulfur atoms, such as in methionine residues, have an electrophilic character and interact with electron-rich rings [36–38]. Met310 is aligned to Ala313 in the hP2Y1-R, which is not involved in ligand binding.
Table 2. List of amino acid (aa) residues in hP2Y11-R, and the corresponding residues in hP2Y1-R, which participate in ATP recognition.
| aa residue in hP2Y11-R | Homologous aa residue in hP2Y1-R | TM | ATP | Distance of the hP2Y11-R aa residue from ATP (Å) |
|---|---|---|---|---|
| Arg106 | Arg128 | 3 | Pα,γ | 3.05, 2.63 |
| Phe109 | Phe131 | 3 | Adenine | 3.61 |
| Ser206 | Ser218 | 5 | Pγ | 2.60 |
| Arg268 | Lys280 | 6 | Pβ | 2.66 |
| Arg307 | Arg310 | 7 | Pα | 2.66 |
| Arg307 | Arg310 | 7 | N6-H | 2.07 |
| Met310 | – | 7 | Adenine | 3.54 |
Figure 5. Binding mode of ATP at the hP2Y11-R.
Major binding interactions include ionic interactions with the triphosphate chain – Arg106, Arg268 and Arg307; H-bonding interaction with Pγ – Ser206; π-stacking interaction with the adenine ring – Phe109, and interaction with Met310. (See also Table 2.)
However, an important H-bonding interaction involving N1 and N6-adenine positions and serine residues (e.g. Ser314 in the hP2Y1-R) in hP2Y-R complexes, is missing in the hP2Y11-R. In the latter receptor, instead of a serine residue, Pro311 is present, which does not form any specific interactions with the adenine ring. No alternative residue was found to interact with the adenine N1 position in the hP2Y11-R–ATP complex. In this way, an important binding interaction is lost in the hP2Y11-R as compared with the hP2Y1-R. In addition, no specific interactions of hP2Y11-R residues were observed with the ribose ring.
In general, the EL2 is believed to be part of the GPCR-binding pocket [39], and thus involved in ligand recognition. The Asp204 in EL2 in hP2Y1-R has been found to be a critical residue [9]. Major et al. [13] proposed that the ATP phosphate chain co-ordinates with an Mg2+ ion, which is in turn co-ordinated with Asp204.
The EL2 in the hP2Y11-R is considerably longer than that of the hP2Y1-R (35 versus 25 amino acids residues respectively). Attempts to model this very long EL2 were unsuccessful. Hence, the role of a residue in hP2Y11-R (tentatively Glu186), corresponding to Asp204 in the hP2Y1-R, could not be investigated computationally.
Recognition of C-2-substituted ATP analogues
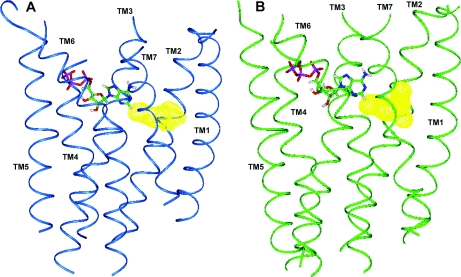
C-2-substituted ATP analogues, such as 2-MeS-ADP or 2-MeS-ATP, proved to be exceptionally potent at the hP2Y1-R [40]. Yet, at the hP2Y11-R these analogues proved to be extremely poor agonists [5]. However, AR-C67085 (2-PrS-β,γ-dichloromethylene-D-ATP; Figure 2), was shown to be a potent agonist at the hP2Y11-R [5]. These observations prompted us to explore a tentative binding pocket for the C-2-substituents of ATP. In both the hP2Y1-R and the hP2Y11-R models, a hydrophobic pocket is located in the vicinity of the ATP C-2 position (Figure 6). That pocket in the hP2Y11-R is situated between TM2 and TM7, and is confined by residues Leu82 (TM2), Phe109 (TM3), Leu113 (TM3), Pro311 (TM7) and Ala313 (TM7). In our virtual screening study, C-2-thioether substitutions such as MeS, EtS (ehtyl thioether), PrS (propyl thioether) and BuS (butyl thioether) fitted into the hP2Y11-R hydrophobic pocket. However, bulkier substitutions such as 2-tBuS and 2-neopentylS did not fit. Indeed, the 2-neopentylS-ATP analogue, which was subsequently tested at the hP2Y11–GFP receptor to stimulate intracellular calcium release, showed no significant increase in the calcium level at concentrations up to 10 μM.
Figure 6. The hydrophobic pocket (yellow) present in the vicinity of the C-2 position of ATP in the hP2Y11-R model (A) and in the hP2Y1-R model (B).
This pocket in the hP2Y11-R is situated between TM2 and TM7, and is confined by residues Leu82 (TM2), Phe109 (TM3), Leu113 (TM3), Pro311 (TM7) and Ala313 (TM7). In the hP2Y1-R model, the hydrophobic pocket comprises Leu104, Pro105, Ile130, Val133 and Leu135.
However, the reduced potency of 2-MeS-ATP at the hP2Y11-R as compared with ATP remains unresolved by a virtual screening study and might be due to reasons other than poor fitting.
Site-directed mutagenesis of the hP2Y11-R
Based on the hP2Y11-R model proposed here, we next tested the binding mode hypothesis by mutating amino acid residues Arg106 (TM3), Phe109 (TM3), Glu186 (EL2), Arg268 (TM6) and Arg307 (TM7). 1321N1 cells were used to stably express the wild-type and the mutant receptors respectively. All receptors were constructed as GFP fusion proteins. The expression level was analysed by flow cytometry detecting the GFP fluorescence intensity per cell. Both, wild-type and mutant receptors displayed comparable fluorescence intensities. Some mutants (E186A and R268A) showed an even higher expression and other mutants (R106A, Y261A and R307A) had approx. 80% expression level as compared with the wild-type receptor (Table 3). The subcellular localization of the mutant receptors was examined by confocal microscopy. It was found to be comparable with that of the unmutated receptor for the E186A, R268A, R268Q and A313N mutant receptors. Although the F109I mutant receptor was only partially located at the plasma membrane, it exhibited a significant potency for ATP. Similar observations were made in a different mutagenesis approach, where even a 90% reduction in surface expression levels of the wild-type hP2Y1-R had no significant influence on the EC50 values of the agonist investigated [41]. Therefore the potency of ATP found at the F109I mutant as well as the potency at the mutants with a similar subcellular localization (R106A, Y261A and R307A) probably reflects the intrinsic activity of these constructs.
Table 3. Intracellular calcium release induced by stimulation of mutant hP2Y11–GFP receptors and expression levels of mutant receptors.
Results represent mean EC50 values (μM)±S.E.M., obtained from n (numbers in parentheses) concentration–response curves of 1321N1 cells stably expressing the wild-type (wt) or mutated receptor. The receptor expression level was derived from n experiments.
| EC50 value (μM) | ||||
|---|---|---|---|---|
| hP2Y11-R construct | Residue | ATP | ATP[S] | Receptor expression level (%) (n) |
| wt | 2.37±0.88 (4) | 1.04±0.38 (4) | 100 | |
| R106A | 3.29 | * | n.d. | 76.1±4.7 (4) |
| F109I | 3.32 | 10.7±2.29 (5) | n.d. | 102±13 (7) |
| E186A | EL2 | 32.8±21.1 (5) | 4.92±1.07 (4) | 111±10 (9) |
| Y261A | 6.48 | * | n.d. | 77.4±3.9 (4) |
| R268A | 6.55 | 1806±354 (3) | 247±178 (8) | 143±23 (3) |
| R268Q | 6.55 | 102±20 (5) | 10.3±2.59 (3) | 95.6±8.0 (7) |
| R307A | 7.39 | * | n.d. | 87.5±5.9 (4) |
| A313N | 7.45 | 4.52±0.99 (7) | n.d. | 97.6±11.9 (4) |
*ATP induced no significant increase in intracellular calcium up to concentrations of 10 mM. n.d., Not determined.
Functional activity of the receptors was determined, first, by monitoring [Ca2+]i release in the stably transfected cells and, secondly, by measuring cAMP accumulation induced after agonist stimulation. We employed the calcium indicator fura 2 and a cAMP EIA, as described in the Methods section.
The two arginine residues in TM3 (Arg106) and TM7 (Arg307) were found to be most critical for hP2Y11-R activation. After mutation to alanine, the ability of ATP to trigger a calcium signal at these receptors was almost abolished. Only at concentrations ≥10 mM an increase in calcium levels could be observed (Table 3). This confirms the hypothesis that these arginine residues stabilize the bound ATP through electrostatic interaction with ATP-Pα and Pγ of the phosphate moiety (Figure 5). Besides the interaction with ATP-Pα, Arg307 is also believed to take part in an H-bond through its backbone carbonyl with N6. The corresponding residues in the hP2Y1 receptor (Arg128 and Arg310) are similarly essential for ligand recognition. Their mutation resulted in functionally inactive receptors [42]. A model of the hP2Y6 receptor showed the involvement of these conserved arginine residues in binding of the phosphate moiety of the nucleotide to the receptor [43]. Surprisingly, at the hP2Y2 receptor only the mutation of the corresponding arginine in TM7 (Arg292) resulted in loss of function of the receptor, but mutation of the arginine in TM3 (Arg110) to leucine had little effect on the potency of the agonists [44]. The arginine in TM7 is part of a conserved motif (Q/KXXR) within the Gq-coupled subgroup of P2Y-Rs. This motif is considered important for receptor activation.
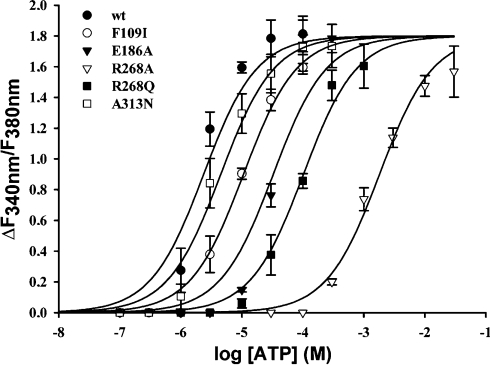
The aromatic amino acid in TM3 (Phe109) that was thought to possibly interact with the adenine moiety via π-stacking interaction seems to be not very critical for receptor activation. The EC50 value was increased only by a factor of 4 after mutation of phenylalanine to an isoleucine residue. Thus there was no major effect on the potency of ATP at the receptor (Table 3; Figure 7). However, this phenylalanine residue is highly conserved throughout the P2Y-R family (Figure 1). In the hP2Y1 receptor, mutation of this residue to alanine caused a loss in potency for 2-MeS-ADP of approximately one order of magnitude, but it was still less critical for ligand recognition than other sites of the receptor [10,42]. Moreover, this phenylalanine residue is possibly involved in hydrophobic interactions with the uracil ring of docked UDP in a molecular model of the hP2Y6 receptor [43]. The mutation of Phe109 to isoleucine in the hP2Y11 receptor did, probably, not much disturb the recognition of ATP at the receptor, since isoleucine is also a bulky, hydrophobic amino acid and therefore loss in potency was only 4-fold. Thus the prediction of π-stacking between the adenine and the phenyl ring could not be verified experimentally.
Figure 7. Concentration–response curves for ATP in inducing [Ca2+]i increase in 1321N1 cells stably expressing the wild-type and mutant P2Y11–GFP receptors.
Cells pre-incubated with 2 μM fura 2/AM were stimulated with various concentrations of ATP and the change in fluorescence (ΔF340 nm/F380 nm) was detected. Results represent the mean values and S.E.M. from 40–70 single cells. Results were obtained in at least three separate experiments. Filled circles (●) represent results obtained with the wild-type receptor, open circles (○) the F109I mutant, filled triangles (▼) the E186A mutant, open triangles (▽) the R268A mutant, filled squares (■) the R268Q mutant and open squares (□) the A313N mutant receptor.
The role of the ELs in nucleotide binding by P2Y-Rs has been suggested previously [41]. Furthermore, the importance of the EL2 Asp204 residue in ligand recognition has already been shown for the hP2Y1-R [9,13]. Glu186 was a residue in the EL2 of the hP2Y11-R predicted to be involved in ligand recognition. Mutation of this glutamate to alanine resulted in a decreased potency of ATP at the receptor. The shift was more than one order of magnitude (Table 3; Figure 7), consistent with the finding at the hP2Y1-R. However, for the more potent hP2Y11-R agonist ATP[S] (adenosine 5′-[γ-thio]triphosphate), the shift in potency was only 5-fold, compared with the wild-type receptor. This implies that Glu186 interacts with phosphates Pα and Pβ of the triphosphate moiety, probably also via co-ordination of an Mg2+ ion as proposed for the corresponding residue in the hP2Y1-R [13]. The relatively small shift in potency for agonists at the Glu186 mutant implies a modulatory function of this residue in receptor functionality, as proposed for the corresponding residue in the hP2Y1-R [11,41].
The Arg268 residue that was thought to be involved in ATP-Pβ recognition is part of a conserved motif in TM6. For members belonging to the Gq-coupled subgroup of P2Y-Rs, the motif is HXXR/K; the Gi-coupled receptors have all arginine and not lysine. P1 receptors lack these arginine/lysine residues, indicating the role of the positively charged amino acids in co-ordination of the phosphate moiety.
The R268A mutant receptor displayed a clearly reduced potency for ATP, compared with the wild-type receptor (Table 3; Figure 7), indicating the significance of an intact motif in TM6. When this arginine was replaced by glutamine, the potency of ATP at this receptor could be partially rescued (Table 3; Figure 7). These findings are consistent with the interpretation of a partial recovery of the Arg268 interaction with ATP-Pβ, which results in the partially restored activity. However, we cannot ignore the importance of a conserved pattern in TM6. Indeed, it has been suggested that at least one mechanism of GPCR activation originates in TM6, being the ‘aromatic zipper’ [45]. Although in cases where that mechanism of activation is clearly missing, we cannot rule out the existence of alternative mechanisms, which could involve Arg268. For both mutant receptors the change in potency for ATP[S] compared with the wild-type receptor was not as drastic as for ATP, indicating that the major interaction is with Pβ and a favourable interaction with Pγ-S, as compared with Pγ-O, still remains in the mutant. This favourable interaction may be due to a tighter fit of the larger Pγ-S moiety, compared with the phosphate moiety. The corresponding residues in the hP2Y1-R (Lys280) and the hP2Y2-R (Arg265) were also found to be essential for activation at low ATP concentrations, because a clear decrease in potency was found by replacement of Lys280 or Arg265 by uncharged amino acids [42,44]. In the hP2Y6-R model, this position (Lys259) was part of a positively charged subpocket that bound the phosphate moiety of docked UDP [43], again highlighting the importance of this residue. For a member of the Gi-coupled subgroup of P2Y-Rs, the hP2Y12-R, the significance of this arginine residue in TM6 was also confirmed [15,46,47].
The importance of a tyrosine residue in TM6 for ligand recognition was also investigated by means of mutagenesis. Tyr261 was not found to be directly interacting with the ATP molecule docked in our hP2Y11-R model. However, it has been shown that a comparable residue (Tyr273) in the hP2Y1-R located at the same position (6.48) seems to act as a molecular switch for receptor activation [9]. A Y273A mutation led to a functionally inactive receptor that was still able to bind agonist/antagonist with the same affinity as the wild-type receptor. This is in accordance with the ‘aromatic zipper’ theorem proposing a probable mechanism of activation. As it was suggested that this residue might also be important for other GPCRs, we generated a Y261A mutant hP2Y11-R. The mutant receptor was incapable of being activated by ATP at concentrations ≤10 mM. Therefore this tyrosine seems to play an important role in hP2Y11-R activation. We assume that Tyr261 is solely involved in receptor activation, since it was not found to bind the ATP significantly in any of our models. Owing to the lack of a selective radioligand at the hP2Y11-R we were not able to directly prove this suggestion.
At the entrance to the hydrophobic pocket located in the vicinity of the C-2 position of ATP in the hP2Y11-R model (Figure 6A) an alanine residue (Ala313) is situated. This Ala313 is a unique feature of the hP2Y11-R, as all other hP2Y-Rs have an asparagine amino acid at this position. We expected that this Ala313 might have an impact on the reduction in potency for C-2-substituted ATP derivatives at the hP2Y11-R [5,48]. At the A313N mutant receptor, ATP was 2-fold less potent (Table 3; Figure 7). However, 2-MeS-ATP (EC50=8.37±2.05 μM, n=8) displayed a gain in potency as compared with the wild-type receptor (EC50=11.1±6.30 μM, n=3). This finding supports our hypothesis of this residue being a key player in the interactions involving ATP-C-2 substitutions.
The hP2Y11-R is also coupled with the activation of the adenylate cyclase, besides induction of intracellular calcium release. Thus we also investigated the ability of the receptor mutants to induce cAMP production upon stimulation. The mutants that showed no calcium responses were not considered.
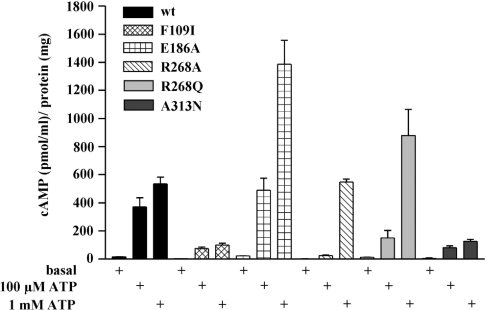
The hP2Y11-R expressed in 1321N1 cells was found to have a low efficacy in coupling with Gs [5]. Stimulation with ATP promoted cAMP accumulation with a 15-fold lower potency than Ins(1,4,5)P3 accumulation in these cells [49]. Therefore we investigated the induction of agonist-induced [cAMP] increase for two relevant ATP concentrations (Figure 8). The unmutated hP2Y11-R caused a significant [cAMP] increase even at 100 μM ATP, which was 80% of the maximum response seen at 1 mM ATP. Therefore the response already reaches the plateau phase [49]. For the F109I and A313N receptor mutants we obtained similar results, supporting the notion of a minor influence of these residues on the potency of ATP, as also observed in the calcium measurements. However, the maximal increase in intracellular [cAMP] was much lower than in cells expressing the wild-type receptor, suggesting that the phenylalanine residue in TM3 and the alanine residue in TM7 are important for efficient coupling of the receptor with Gs. A strong influence on the cAMP response maxima was also found for a point mutation in the glucagon receptor. Mutation of a phenylalanine to alanine in TM2 of the glucagon receptor led to a reduced maximal response without affecting the EC50 value of the agonist [50].
Figure 8. Intracellular cAMP content determined at basal level and after stimulation with ATP (100 μM and 1 mM) in 1321N1 cells stably transfected with the wild-type hP2Y11-R, and mutant receptors respectively.
cAMP was determined after a 10 min incubation with ATP in cellular extracts by a cAMP EIA. The histogram shows the means±S.E.M. from four separate experiments.
In contrast, the glutamate in EL2 of the hP2Y11-R seems to play a role in regulating the agonist potency and activity of the receptor. After mutation to alanine the agonist-induced [cAMP] increase was much stronger as compared with the increase with the wild-type receptor. Stimulation with 1 mM ATP resulted in a 3-fold higher cAMP content than in cells expressing the unmutated hP2Y11-R. The influence of the E186A mutation on the potency of ATP could not be easily quantified in the [cAMP] measurements. It was not clear whether at 1 mM ATP the maximum response was reached. Attempts at using higher concentrations were unsuccessful because at 10 mM ATP an interference with the cAMP response of the hP2Y11-R by other mechanisms took place (results not shown). However, the E186A mutant seems to display a reduced potency in activating adenylate cyclase.
Similar observations were made when the cAMP accumulation after ATP stimulation was investigated in 1321N1 cells expressing the R268A receptor mutant. At 100 μM ATP no increase in the cAMP content was found compared with basal levels, whereas at 1 mM ATP cells responded like control cells. This reflects the drastically reduced potency of ATP at this receptor mutant as found in the calcium measurements described above. The cells expressing the R268Q receptor mutant showed even higher [cAMP] values after stimulation with 1 mM ATP than the wild-type hP2Y11-R-1321N1 cells. For both the R268A and R268Q receptor mutants, maximal stimulation could not be established, as already described.
Thus the E186A and R268A,Q receptor mutants seem to be more efficiently coupled with the activation of adenylate cyclase compared with the wild-type hP2Y11-R. A similar phenomenon was observed in other GPCR mutants. Mutation of polar residues to alanine in TM6 and TM7 of the glucagon receptor resulted in increased response maxima to glucagon-NH2 [50]. The β1 receptor carrying a point mutation in TM2 and the TSH (thyrotrophin) receptor with a naturally occurring mutation in TM1 displayed both a more pronounced basal activity and higher cAMP accumulation after agonist stimulation, compared with the respective wild-type receptors [51,52].
Taken together, the analysis of Gs coupling reveals similar changes in agonist potency in the mutated hP2Y11-Rs as compared with Gq coupling. Moreover, specific residues in the hP2Y11-R seem to be important for controlling the stimulatory extent of cAMP-dependent processes.
Conclusions
The hP2Y11-R model calculated here has proven to be adequate for the investigation of the molecular recognition of this receptor. The computed models, which were extensively refined by MD simulation protocols, were not only able to reproduce experimental data but also to predict the affinity of previously untested ligands. We have found that the binding pockets of the hP2Y1-R and the hP2Y11-R are very similar. We have established that in the hP2Y11-R the residues involved in ligand binding are Arg106, Phe109, Ser206, Arg268, Arg307 and Met310. The involvement of Arg106, Tyr261, Arg268, Arg307 and Ala313 in ligand recognition was confirmed by a mutational study. Glu186 in the EL2 of the hP2Y11-R, aligned with the critical Asp204 in the hP2Y1-R, also proved significant for ligand recognition. Furthermore, mutation of Phe109, Glu186, Arg268 and Ala313 influences coupling of the hP2Y11-R with Gs, whereas the extent of coupling with Gq remains unaffected.
Only minor amino acid residue variations were observed in the binding site of hP2Y11-R as compared with hP2Y1-R (e.g. Pro311 versus Ser314, in P2Y11-R versus P2Y1-R). In the hP2Y11-R, His317 appears instead of an aspartic acid residue in the conserved DPXXY motif in TM7, a typical motif for all other P2Y-Rs. This new motif, which may trigger a different mechanism of activation, is worth further investigations.
Although the hP2Y11-R has a hydrophobic-binding pocket in the vicinity of the C-2 position of ATP, similar to that of hP2Y1-R (Figure 6), the significantly lower activity of 2-MeS-ATP at hP2Y11-R may be due to the lack of H-bonding interactions that are present in the hP2Y1-R. Specifically, the Ser314 in the hP2Y1-R is probably involved in H-bonding interactions with the sulfur atom of 2-MeS-ATP [12,13]. Therefore we propose that the natural mutation of Ser314 as well as Asn316 in the hP2Y1-R to Pro311 and Ala313 in the hP2Y11-R, as compared with other hP2Y-Rs, could be responsible for the lower potency of 2-MeS-ATP as compared with ATP at the hP2Y11-R.
Online data
Acknowledgments
We thank Dr T. Hanck and Dr F. Sedehizade for helpful suggestions in the mutagenesis experiments and Ms D. Terhardt for technical help in the complete experimental study. We thank Dr R. Hartig (Institute of Immunology, Medical Faculty, Otto-von-Guericke-Universität Magdeburg) for providing the facilities to carry out flow cytometry analysis. B. F. and J. Z. thank Mr M. Amitai (Department of Pharmaceutical Chemistry, School of Pharmacy, Hebrew University, Jerusalem, Israel) for helpful discussions.
References
- 1.Burnstock G. Purinergic nerves. Pharmacol. Rev. 1972;24:509–581. [PubMed] [Google Scholar]
- 2.Abbracchio M. P., Burnstock G. Purinoceptors: are there families of P2X and P2Y purinoceptors? Pharmacol Ther. 1994;64:445–475. doi: 10.1016/0163-7258(94)00048-4. [DOI] [PubMed] [Google Scholar]
- 3.Fredholm B. B., Abbracchio M. P., Burnstock G., Daly J. W., Harden T. K., Jacobson K. A., Leff P., Williams M. Nomenclature and classification of purinoceptors. Pharmacol. Rev. 1994;46:143–156. [PMC free article] [PubMed] [Google Scholar]
- 4.Chambers J. K., Macdonald L. E., Sarau H. M., A R. S., Freeman K., Foley J. J., Zhu Y., McLaughlin M. M., Murdock P., McMillan L., et al. A G protein-coupled receptor for UDP-glucose. J. Biol. Chem. 2000;275:10767–10771. doi: 10.1074/jbc.275.15.10767. [DOI] [PubMed] [Google Scholar]
- 5.Communi D., Robaye B., Boeynaems J.-M. Pharmacological characterization of the human P2Y11 receptor. Br. J. Pharmacol. 1999;128:1199–1206. doi: 10.1038/sj.bjp.0702909. [DOI] [PMC free article] [PubMed] [Google Scholar]
- 6.Webb T. E., Simon J., Krishek B. J., Bateson A. N., Smart T. G., King B. F., Burnstock G., Barnard E. A. Cloning and functional expression of a brain G-protein-coupled ATP receptor. FEBS Lett. 1993;324:219–225. doi: 10.1016/0014-5793(93)81397-i. [DOI] [PubMed] [Google Scholar]
- 7.Jacobson K. A., Jarvis M. F., Williams M. Purine and pyrimidine (P2) receptors as drug targets. J. Med. Chem. 2002;45:4057–4093. doi: 10.1021/jm020046y. [DOI] [PubMed] [Google Scholar]
- 8.von Kugelgen I. Pharmacological profiles of cloned mammalian P2Y-receptor subtypes. Pharmacol Ther. 2006;110:415–432. doi: 10.1016/j.pharmthera.2005.08.014. [DOI] [PubMed] [Google Scholar]
- 9.Costanzi S., Mamedova L., Gao Z.-G., Jacobson K. A. Architecture of P2Y nucleotide receptors: Structural comparison based on sequence analysis, mutagenesis, and homology modeling. J. Med. Chem. 2004;47:5393–5404. doi: 10.1021/jm049914c. [DOI] [PMC free article] [PubMed] [Google Scholar]
- 10.Moro S., Guo D., Camaioni E., Boyer J. L., Harden T. K., Jacobson K. A. Human P2Y1 receptor: molecular modeling and site-directed mutagenesis as tools to identify agonist and antagonist recognition sites. J. Med. Chem. 1998;41:1456–1466. doi: 10.1021/jm970684u. [DOI] [PMC free article] [PubMed] [Google Scholar]
- 11.Moro S., Hoffmann C., Jacobson K. A. Role of the extracellular loops of G protein-coupled receptors in ligand recognition: a molecular modeling study of the human P2Y1 receptor. Biochemistry. 1999;38:3498–3507. doi: 10.1021/bi982369v. [DOI] [PMC free article] [PubMed] [Google Scholar]
- 12.Major D. T., Fischer B. Molecular recognition in purinergic receptors. 1. A comprehensive computational study of the h-P2Y1-receptor. J. Med. Chem. 2004;47:4391–4404. doi: 10.1021/jm049772m. [DOI] [PubMed] [Google Scholar]
- 13.Major D. T., Nahum V., Wang Y., Reiser G., Fischer B. Molecular recognition in purinergic receptors. 2. Diastereoselectivity of the h-P2Y1-receptor. J. Med. Chem. 2004;47:4405–4416. doi: 10.1021/jm049771u. [DOI] [PubMed] [Google Scholar]
- 14.Buescher R., Hoerning A., Patel H. H., Zhang S., Arthur D. B., Grasemann H., Ratjen F., Insel P. A. P2Y2 receptor polymorphisms and haplotypes in cystic fibrosis and their impact on Ca2+ influx. Pharmacogenet. Genomics. 2006;16:199–205. doi: 10.1097/01.fpc.0000189798.11468.6a. [DOI] [PubMed] [Google Scholar]
- 15.Cattaneo M. The P2 receptors and congenital platelet function defects. Semin. Thromb. Hemostasis. 2006;32(Suppl. 1):77–85. doi: 10.1055/s-2005-869522. [DOI] [PubMed] [Google Scholar]
- 16.Boeynaems J.-M., Robaye B., Janssens R., Suarez-Huerta N., Communi D. Overview of P2Y receptors as therapeutic targets. Drug Dev. Res. 2001;52:187–189. [Google Scholar]
- 17.Amisten S., Melander O., Wihlborg A., Berglund G., Erlinge D. Increased risk of acute myocardial infarction and elevated levels of C-reactive protein in carriers of the Thr87 variant of the ATP receptor P2Y11. Purinergic Signalling. 2006;2:234–235. doi: 10.1093/eurheartj/ehl410. [DOI] [PubMed] [Google Scholar]
- 18.Wilkin F., Duhant X., Bruyns C., Suarez-Huerta N., Boeynaems J. M., Robaye B. The P2Y11 receptor mediates the ATP-induced maturation of human monocyte-derived dendritic cells. J. Immunol. 2001;166:7172–7177. doi: 10.4049/jimmunol.166.12.7172. [DOI] [PubMed] [Google Scholar]
- 19.Thompson J. D., Gibson T. J., Plewniak F., Jeanmougin F., Higgins D. G. The CLUSTAL_X windows interface: flexible strategies for multiple sequence alignment aided by quality analysis tools. Nucleic Acids Res. 1997;25:4876–4882. doi: 10.1093/nar/25.24.4876. [DOI] [PMC free article] [PubMed] [Google Scholar]
- 20. Reference deleted.
- 21.Okada T., Fujiyoshi Y., Silow M., Navarro J., Landau E. M., Shichida Y. Functional role of internal water molecules in rhodopsin revealed by x-ray crystallography. Proc. Natl. Acad. Sci. U.S.A. 2002;99:5982–5987. doi: 10.1073/pnas.082666399. [DOI] [PMC free article] [PubMed] [Google Scholar]
- 22.Sali A., Blundell T. L. Comparative protein modelling by satisfaction of spatial restraints. J. Mol. Biol. 1993;234:779–815. doi: 10.1006/jmbi.1993.1626. [DOI] [PubMed] [Google Scholar]
- 23.Brooks B. R., Bruccoleri R. E., Olafson B. D., States D. J., Swaminathan S., Karplus M. CHARMM: a program for macromolecular energy, minimization, and dynamics calculations. J. Comput. Chem. 1983;4:187–217. [Google Scholar]
- 24.Laskowski R. A., MacArthur M. W., Moss D. S., Thornton J. M. PROCHECK: a program to check the stereochemical quality of protein structures. J. Appl. Crystallogr. 1993;26:283–291. [Google Scholar]
- 25.Frisch M. J., Trucks G. W., Schlegel H. B., Scuseria G. E., Robb M. A., Cheeseman J. R., Zakrzewski V. G., Montgomery J. A., Jr, Stratmann R. E., Burant J. C., et al. Pittsburgh, PA: Gaussian, Inc.; 1998. Gaussian98. [Google Scholar]
- 26. Reference deleted.
- 27. Reference deleted.
- 28.Jain A. N. Surflex: fully automatic flexible molecular docking using a molecular similarity-based search engine. J. Med. Chem. 2003;46:499–511. doi: 10.1021/jm020406h. [DOI] [PubMed] [Google Scholar]
- 29.Ubl J. J., Vöhringer C., Reiser G. Co-existence of two types of [Ca2+]i-inducing protease-activated receptors (PAR-1 and PAR-2) in rat astrocytes and C6 glioma cells. Neuroscience. 1998;86:597–609. doi: 10.1016/s0306-4522(97)00686-6. [DOI] [PubMed] [Google Scholar]
- 30.Vöhringer C., Schäfer R., Reiser G. A chimeric rat brain P2Y1 receptor tagged with green-fluorescent protein: high-affinity ligand recognition of adenosine diphosphates and triphosphates and selectivity identical to that of the wild-type receptor. Biochem. Pharmacol. 2000;59:791–800. doi: 10.1016/s0006-2952(99)00390-1. [DOI] [PubMed] [Google Scholar]
- 31.Mirzadegan T., Benko G., Filipek S., Palczewski K. Sequence analyses of G-protein-coupled receptors: similarities to rhodopsin. Biochemistry. 2003;42:2759–2767. doi: 10.1021/bi027224+. [DOI] [PMC free article] [PubMed] [Google Scholar]
- 32.Shacham S., Topf M., Avisar N., Glaser F., Marantz Y., Bar-Haim S., Noiman S., Naor Z., Becker O. M. Modeling the 3D structure of GPCRs from sequence. Med. Res. Rev. 2001;21:472–483. doi: 10.1002/med.1019. [DOI] [PubMed] [Google Scholar]
- 33.Visiers I., Ebersole B. J., Dracheva S., Ballesteros J., Sealfon S. C., Weinstein H. Structural motifs as functional microdomains in G-protein-coupled receptors: energetic considerations in the mechanism of activation of the serotonin 5-HT2A receptor by disruption of the ionic lock of the arginine cage. Int. J. Quantum Chem. 2002;88:65–75. [Google Scholar]
- 34.Barak L. S., Menard L., Ferguson S. S., Colapietro A. M., Caron M. G. The conserved seven-transmembrane sequence NP(X)2,3Y of the G-protein-coupled receptor superfamily regulates multiple properties of the beta 2-adrenergic receptor. Biochemistry. 1995;34:15407–15414. doi: 10.1021/bi00047a003. [DOI] [PubMed] [Google Scholar]
- 35.Gales C., Kowalski-Chauvel A., Dufour M. N., Seva C., Moroder L., Pradayrol L., Vaysse N., Fourmy D., Silvente-Poirot S. Mutation of Asn-391 within the conserved NPXXY motif of the cholecystokinin B receptor abolishes Gq protein activation without affecting its association with the receptor. J. Biol. Chem. 2000;275:17321–17327. doi: 10.1074/jbc.M909801199. [DOI] [PubMed] [Google Scholar]
- 36.Zauhar R. J., Colbert C. L., Morgan R. S., Welsh W. J. Evidence for a strong sulfur–aromatic interaction derived from crystallographic data. Biopolymers. 2000;53:233–248. doi: 10.1002/(SICI)1097-0282(200003)53:3<233::AID-BIP3>3.0.CO;2-4. [DOI] [PubMed] [Google Scholar]
- 37.Pal D., Chakrabarti P. Non-hydrogen bond interactions involving the methionine sulfur atom. J. Biomol. Struct. Dyn. 2001;19:115–128. doi: 10.1080/07391102.2001.10506725. [DOI] [PubMed] [Google Scholar]
- 38.Tatko C. D., Waters M. L. Investigation of the nature of the methionine-p interaction in b-hairpin peptide model systems. Protein Sci. 2004;13:2515–2522. doi: 10.1110/ps.04820104. [DOI] [PMC free article] [PubMed] [Google Scholar]
- 39.Palczewski K., Kumasaka T., Hori T., Behnke C. A., Motoshima H., Fox B. A., Le Trong I., Teller D. C., Okada T., Stenkamp R. E., et al. Crystal structure of rhodopsin: a G protein-coupled receptor. Science. 2000;289:739–745. doi: 10.1126/science.289.5480.739. [DOI] [PubMed] [Google Scholar]
- 40.Palmer R. K., Boyer J. L., Schachter J. B., Nicholas R. A., Harden T. K. Agonist action of adenosine triphosphates at the human P2Y1 receptor. Mol. Pharmacol. 1998;54:1118–1123. [PubMed] [Google Scholar]
- 41.Hoffmann C., Moro S., Nicholas R. A., Harden T. K., Jacobson K. A. The role of amino acids in extracellular loops of the human P2Y1 receptor in surface expression and activation processes. J. Biol. Chem. 1999;274:14639–14647. doi: 10.1074/jbc.274.21.14639. [DOI] [PMC free article] [PubMed] [Google Scholar]
- 42.Jiang Q., Guo D., Lee B. X., Van Rhee A. M., Kim Y. C., Nicholas R. A., Schachter J. B., Harden T. K., Jacobson K. A. A mutational analysis of residues essential for ligand recognition at the human P2Y1 receptor. Mol. Pharmacol. 1997;52:499–507. doi: 10.1124/mol.52.3.499. [DOI] [PMC free article] [PubMed] [Google Scholar]
- 43.Costanzi S., Joshi B. V., Maddileti S., Mamedova L., Gonzalez-Moa M. J., Marquez V. E., Harden T. K., Jacobson K. A. Human P2Y6 receptor: molecular modeling leads to the rational design of a novel agonist based on a unique conformational preference. J. Med. Chem. 2005;48:8108–8111. doi: 10.1021/jm050911p. [DOI] [PMC free article] [PubMed] [Google Scholar]
- 44.Erb L., Garrad R., Wang Y., Quinn T., Turner J. T., Weisman G. A. Site-directed mutagenesis of P2U purinoceptors. Positively charged amino acids in transmembrane helices 6 and 7 affect agonist potency and specificity. J. Biol. Chem. 1995;270:4185–4188. doi: 10.1074/jbc.270.9.4185. [DOI] [PubMed] [Google Scholar]
- 45.Rosenkilde M. M., Andersen M. B., Nygaard R., Frimurer T. M., Schwartz T. W. Activation of the CXCR3 chemokine receptor through anchoring of a small molecule chelator ligand between TM-III, -IV and -VI. Mol. Pharmacol. 2007;71:930–941. doi: 10.1124/mol.106.030031. [DOI] [PubMed] [Google Scholar]
- 46.Cattaneo M., Zighetti M. L., Lombardi R., Martinez C., Lecchi A., Conley P. B., Ware J., Ruggeri Z. M. Molecular bases of defective signal transduction in the platelet P2Y12 receptor of a patient with congenital bleeding. Proc. Natl. Acad. Sci. U.S.A. 2003;100:1978–1983. doi: 10.1073/pnas.0437879100. [DOI] [PMC free article] [PubMed] [Google Scholar]
- 47.Hoffmann K. A., von Kügelgen I. Evidence for the involvement of basic amino acid residues in transmembrane regions 6 and 7 of the human platelet P2Y12-receptor in ligand recognition. Purinergic Signalling. 2006;2:199–200. [Google Scholar]
- 48.Ecke D., Tulapurkar M. E., Nahum V., Fischer B., Reiser G. Opposite diastereoselective activation of P2Y1 and P2Y11 nucleotide receptors by adenosine 5′-O-(α-boranotriphosphate) analogues. Br. J. Pharmacol. 2006;149:416–423. doi: 10.1038/sj.bjp.0706887. [DOI] [PMC free article] [PubMed] [Google Scholar]
- 49.Qi A. D., Kennedy C., Harden T. K., Nicholas R. A. Differential coupling of the human P2Y11 receptor to phospholipase C and adenylyl cyclase. Br. J. Pharmacol. 2001;132:318–326. doi: 10.1038/sj.bjp.0703788. [DOI] [PMC free article] [PubMed] [Google Scholar]
- 50.Strudwick N., Bhogal N., Evans N. A., Blaney F. E., Findlay J. B. Evidence to support a spectrum of active states for the glucagon receptor. Biochem. Soc. Trans. 2004;32:1037–1039. doi: 10.1042/BST0321037. [DOI] [PubMed] [Google Scholar]
- 51.Ahmed M., Muntasir H. A., Hossain M., Ishiguro M., Komiyama T., Muramatsu I., Kurose H., Nagatomo T. Beta-blockers show inverse agonism to a novel constitutively active mutant of beta1-adrenoceptor. J. Pharmacol. Sci. 2006;102:167–172. doi: 10.1254/jphs.fp0060640. [DOI] [PubMed] [Google Scholar]
- 52.Biebermann H., Schoneberg T., Hess C., Germak J., Gudermann T., Gruters A. The first activating TSH receptor mutation in transmembrane domain 1 identified in a family with nonautoimmune hyperthyroidism. J. Clin. Endocrinol. Metab. 2001;86:4429–4433. doi: 10.1210/jcem.86.9.7888. [DOI] [PubMed] [Google Scholar]
Associated Data
This section collects any data citations, data availability statements, or supplementary materials included in this article.


