

SUMMARY
Much scientific effort has been directed towards elucidating the complexities of cell-mediated immune responses to HIV-1 (reviewed in [1,2]). These studies have attempted to explain the immune system's ultimate failure to contain viral replication, leading to development of AIDS disease, and to identify immune responses that will be useful in developing immunomodulatory therapies and novel vaccine strategies. Although many of the complex interactions involved in AIDS pathogenesis remain unsolved, great progress has been made in characterizing the kinetics, specificity and functional dynamics of HIV-1-specific T cell responses. These investigations have come at a time when advances in virology, cellular immunology and molecular biology have converged to provide a variety of methodological approaches not available at the onset of the AIDS pandemic. Application of these tools to other infectious diseases and immunopathological conditions will provide a fertile area of research for future years. This review focuses on recent developments in the assessment of HIV-1-specific T cell responses in peripheral blood and tissues, with a particular emphasis on flow cytometry-based approaches.
HOW ARE ANTIGEN-SPECIFIC CD8+ T CELLS DEFINED, and HOW SHOULD THEY BE MEASURED?
Antigen-specific CD8+ T cells are a heterogeneous population that perform multiple effector functions [3–5]. These include the production of cytokines and chemokines, cytolytic effector molecules and antigen-specific lysis of MHC class I matched target cells (Fig. 1). There has been considerable debate surrounding the most appropriate methods of measuring antigen-specific T cell responses, and the correlation of measured responses with in vivo function [3,4,6–8].
Fig. 1.

Effector functions of CD8+ T cells. As described in the text, CD8+ T cells perform MHC class I restricted lysis of target cells. Cytotoxicity may be mediated by exocytosis of cytotoxic granules containing perforin and granzymes (shown in figure), or by Fas/Fas ligand or TNF/TNFR interactions (not shown). In addition, CD8+ T cells secrete soluble factors including cytokines (IL-2, IFN-γ, TNF-α and others) and chemokines (MIP-1α, -β, RANTES and others). Chemokines may be a component of cytotoxic granules.
Strong evidence supports a role for CD8+ T cells in controlling HIV-1 dissemination in vivo. In primary infection, acute viraemia resolves coincident with the appearance of HIV-1-specific CD8+ T cells in peripheral blood [9,10]. The breadth and clonal diversity of the primary CD8+ T cell response is predictive of disease progression: broad, polyclonal responses are associated with more favourable outcome [11,12]. Finally, in SIV-infected macaques, depletion of circulating CD8+ T cells with monoclonal antibodies results in a marked increase in viral load [13].
The ultimate failure of the immune system to control HIV-1 replication has not been explained fully. HIV-1 may evade immune control by mutation of cytotoxic T cell (CTL) epitope sequences [10,14,15] and by Nef-induced downmodulation of MHC class I [16,17]. CD4+ T cells, which are important for maintenance of CTL [18], are depleted and recent work suggests that HIV-1-specific CD4+ T cells are preferential targets for infection [19]. Recent literature suggests that HIV-1-specific CD8+ T cells may have functional defects, including reduced ability to kill target cells [4], decreased expression of cytotoxic granule components (i.e. perforin) [4,20,21], reduced production of antiviral cytokines such as IFN-γ [7], inefficient homing to lymph nodes [21], weak signal transduction [22] and ‘skewed’ maturation to end-stage effector cells [23] (reviewed in [6]). These findings underscore the need for developing methods that allow simultaneous assessment of specificity, phenotype and effector functions.
Assays for ctl-mediated lysis: the trend away from 51cr release
The chromium release (51Cr) assay has been considered the ‘gold standard’ for assessing MHC class I-restricted, antigen-specific lysis [24,25] (Fig. 2a). In this assay, MHC class I matched or mismatched target cells expressing antigen are labelled with radioactive 51Cr and incubated with effector cells for 4–6 h. Killing is measured indirectly by detecting 51Cr released by dying cells into the supernatant. The 51Cr release assay may also be performed on limiting dilution cultures expanded for two weeks in the presence of antigen. This assay, known as limiting dilution analysis (LDA), or CTL precursor frequency analysis (PFA), provides an estimation of cytotoxic T cell precursor frequency in peripheral blood. However, this method, as described by Doherty [26], ‘is extremely tedious, technically demanding, and notoriously variable’. In addition, LDA measures only the subset of memory/effector cells capable of proliferating and remaining functional following lengthy in vitro stimulation. Comparative studies using more recently developed methods such as MHC class I tetramer staining, cytokine flow cytometry (CFC) and enzyme-linked immuno-spot (ELISPOT), described below, have demonstrated that LDA underestimates significantly the frequency of antigen-specific T cells [26–29]. Other disadvantages include the use of radioactivity and the inability to gather phenotypic information about effector cells.
Fig. 2.


Methods for assessing CD8+ T cells. (a)–(c): Cytotoxicity assays. (a) Chromium release assay. Radiolabelled target cells (T) are mixed with effector cells (E) at a predefined ratio (E : T ratio). When lysed, target cells release 51Cr, which is detected by scintillation counting. (b) The FATAL assay. Target cells are labelled with a membrane dye, PKH-26, and a cytoplasmic stain, CFSE. After incubation with effector cells, the percent specific lysis is determined by monitoring loss of fluorescent target cells by flow cytometry. (c) The FCC assay. Target cells are loaded with a fluorescent caspase substrate. Induction of apoptosis leads to caspase activation and cleavage of the fluorescent substrate, and the resultant signal is measured by flow cytometry. (d) Cytokine flow cytometry (CFC) or intracellular cytokine staining (ICS). CFC detects cytokine that has accumulated within antigen-stimulated cells following treatment with an inhibitor of vesicular protein transport (i.e. Brefeldin A or Monensin). To detect intracellular cytokine, the cells are permeabilized and incubated with fluorescently labelled monoclonal antibodies. (e) The ELISPOT assay. ELISPOT detects cytokine released by antigen-stimulated T cells in a culture plate previously coated with specific antibody. Cells may be stimulated with recombinant poxviruses, peptides, proteins or viral lysates. After overnight incubation, cells are removed. Antibody-bound cytokine is detected by an enzyme-linked secondary antibody. Antigen-specific cells are enumerated by counting cytokine ‘footprints’. (f) Surface staining with MHC class I complexes. Two configurations are used commonly to link MHC class I monomers. Four monomers may be linked to biotin and joined via streptavidin, which has four biotin binding sites (top). Alternatively, two monomers may be linked via mouse IgG1 (bottom). Tetrameric complexes are directly labelled with fluorochromes; dimer-Ig complexes are detected with fluorochrome-labelled anti-mouse antibodies.
Visualizing ctl killing: flow cytometry-based killing assays
A flow cytometry-based killing assay holds enormous potential for revealing detailed information about the phenotype and activation status of effector and target cells, and the kinetics of their interactions. Several groups have recently developed such assays, although their use has not yet become widespread [30–32].
As described by Sheehy et al. [31], the fluorometric assessment of T-lymphocyte antigen-specific lysis (FATAL assay) utilizes two fluorescent dyes, PKH-26 and CSFE, to track the target cell population (Fig. 2b). The first dye, PKH-26, associates with cell membranes. The second, carboxy-fluorescein diacetate succimidyl ester (CFSE), is internalized by target cells. The percentage of specific lysis is calculated based upon the disappearance of the CFSE-positive target cell population after incubation with effector cells [31]. A second method, the CFSE/7-AAD assay, uses CFSE to label effector cells and the DNA intercalating dye 7-amino actinomycin D (7-AAD) to stain target cells [32].
The flow cytometry caspase assay (FCC) detects activation of caspase enzymes within target cells [30] (Fig. 2c). Caspase activation occurs early in the process of CTL killing, and is a critical event in apoptosis mediated via both perforin and granzymes and the Fas/Fas ligand pathway. The FCC assay detects caspase activation using peptides containing caspase cleavage sites linked to fluorophores. The uncleaved fluorophores form ‘silent’ dimers; once cleaved by caspases, the monomers emit fluorescence.
Use of fluorescence-based killing assays in combination with MHC class I tetramer binding and immunophenotypic staining should allow simultaneous assessment of effector and target cell populations. These assays hold the promise to become powerful tools for exploring the kinetics of CTL killing, monitoring physiological changes in effector and target cells, and performing immunophenotypic analysis of both cell populations.
NO LONGER JUST CTL: DEFINING ANTIGEN-SPECIFIC CD8+ T CELL POPULATIONS
CD8+ T cells are associated most commonly with MHC class I-restricted lysis of virally infected target cells, and the terms ‘antigen-specific CD8+ T cell’ and ‘CTL’ are often used interchangeably. However, another important effector function of CD8+ T cells is the secretion of antiviral and regulatory cytokines and chemokines. Subsets of CD8+ T cells secrete IFN-γ, TNF-α, IL-2 or combinations of these cytokines. Several studies have demonstrated the heterogeneity of CD8+ T cell populations in HIV-1, CMV and EBV infections [3,4,23,33–36]. One study of CMV-specific CD8+ T cells found that TNF-α, IFN-γ and IL-2 were produced sequentially upon stimulation, and approximately half of the cells expressed both TNF-α and IFN-γ [35]. Some HIV-1-specific CD8+ T cells may perform a regulatory/suppressor function by secreting TGF-β [37]. CD8+ T cells also produce the HIV-1 inhibitory chemokines MIP-1α, β, and RANTES. These chemokines may be localized to cytolytic granules and secreted upon antigen-specific triggering [38].
CYTOKINE FLOW CYTOMETRY (CFC) OR INTRACELLULAR CYTOKINE STAINING (ICS) and THE INTERPLAY OF CD4+ and CD8+ T CELL RESPONSES
Antigen-specific stimulation, followed by inhibition of protein secretion and measurement of accumulated intracellular cytokines by multi-colour flow cytometry, is referred to as cytokine flow cytometry (CFC) or intracellular cytokine staining (ICS) (reviewed in [39]) (Fig. 2d). Depending upon the stimulus applied, this method may be used to detect CD4+ and/or CD8+ T cell responses. CD4+ T cell responses are elicited by recombinant proteins or cell lysates. These antigens are processed via the exogenous, or endocytic antigen-processing pathway, and presented as peptides in the context of MHC class II molecules [40]. CD8+ T cell responses may be detected by infecting antigen-presenting cells (APC) with recombinant poxviruses expressing viral antigens [41]. These antigens are expressed intracellularly, processed via the endogenous, or cytosolic pathway, and presented as peptides by MHC class I molecules [40]. Alternatively, synthetic peptides corresponding to potential epitopes may be added exogenously to elicit responses [42–44]. By using 15-mer peptides, which stimulate effectively both CD4+ and CD8+ T cells, responses in both populations may be analysed simultaneously [42,43]. Thus, CFC may provide important insight into the dynamics of the CD4+/CD8+ T cell relationship.
Total epitope analysis: a look at the ‘whole virus’
MHC class I tetramer staining provides an elegant, sensitive means of quantifying CD8+ T cells specific for a known immunodominant peptide epitope ([45,46]; reviewed in [47]). However, the reliance upon well-characterized immunodominant epitopes to assess immune responses overlooks the potential complexity of these responses. CFC has been used to assess simultaneously CD4+ and CD8+ T cell responses to peptides encompassing the entire HIV-1 genome [43] (Fig. 2d). In a group of 23 patients, all of whom were naïve to antiretroviral therapy, CD4+ T cell responses were detected in 21 patients and CD8+ T cell responses were detected in all patients. A similar approach was undertaken to assess CD8+ T cell responses to peptides spanning the entire SIVmac genome [48].
Variations on the elispot assay
The ELISPOT assay, developed originally to assess antibody-producing B cells [49], has been adapted to quantify cytokine production by antigen-specific T cells [50] (Fig. 2e). A broad spectrum of cytokines may be measured, including IFN-γ, IL-4, 5, 6, 10 and 12, and TNF-α. The sensitivity of ELISPOT for detection of peptide-specific CD8+ T cell responses has been estimated as 20–30 antigen-specific spot-forming cells (SFC) per 1 × 10⁶ cells, at least 1 log10 more sensitive than limiting dilution analysis [28,29,51].
Larsson et al. devised a modified ELISPOT using recombinant poxvirus vectors (i.e. vaccinia and canarypox) to express viral proteins [52]. Theoretically, this approach permits detection of responses to all potential epitopes in a single assay, using fewer cells than required for testing overlapping peptides. A limitation of ELISPOT is the inability to characterize responder cells phenotypically; this may be partially overcome by magnetic bead enrichment (or depletion) to select for specific populations. When recombinant poxviruses are used to express antigen, magnetic bead depletion experiments demonstrated that CD8+ T cells are the major responder population, contributing 80–90% of spot-forming cells (SFC) [52]. ELISPOT assays have also been developed to assess SIVmac-specific responses in rhesus macaques [41,53]. Both ELISPOT and CFC are particularly useful tools for assessing responses in nonhuman primates, as macaque MHC alleles remain only partially characterized. Additional sensitivity in the ELISPOT assay may be gained by capitalizing on the superior antigen-presenting capacity of mature dendritic cells (DC) [54,55].
Rapid epitope definition by cfc and elispot
The HIV-1 epidemic affects over 30 million individuals worldwide, of whom the majority are native to sub-Saharan Africa or Asia [56]. However, the MHC class I alleles prevalent in Asian and African populations differ from those that are widespread in Europeans and North Americans, and the epitopes presented by these alleles have not been characterized thoroughly. Traditionally, the identification of new epitopes has relied upon labour-intensive culture methods to generate peptide-specific clones. However, recent reports have demonstrated that new epitopes may be defined using overlapping peptides to stimulate whole PBMC in the ELISPOT assay [57,58]. Peptide matrix analysis provides a rapid means of mapping epitopes using either ELISPOT or CFC [44,59]. This method uses pools of up to 10 overlapping peptides spanning an entire protein. The pools are organized in a two-dimensional array such that each peptide is found in only two pools, and a response to both pools suggests that the common peptide contains the correct epitope.
To determine the MHC restriction of antigen-specific responses, Epstein–Barr transformed B-cell lines (B-LCL) have been used traditionally as antigen-presenting cells in 51Cr release assays [24]. Unfortunately, use of B-LCL in the ELISPOT assay induces high background counts [57,58]. However, this problem is reportedly less severe when CFC is used to assess cytokine production [58]. Thus, ELISPOT and CFC may be combined to rapidly identify both the sequence and MHC restriction of new epitopes.
Tetramer staining and beyond: the phenotypic and functional heterogeneity of antigen-specific populations
The development of MHC class I tetrameric complexes has provided a rapid, elegant, specific and exquisitely sensitive means of quantifying antigen-specific CD8+ T cells by flow cytometry [45,46] (Fig. 2f). Use of tetramers to assess the frequency of CD8+ T cells has led to a reinterpretation of T cell dynamics in a number of infectious diseases [27,51]; this topic has been reviewed extensively elsewhere (reviewed in [2,26,47]).
Used alone, tetramer staining provides no information about CD8+ T cell phenotype or function. To address the functional heterogeneity of epitope-specific T cell populations, tetramer staining has been combined with intracellular staining for cytokines, chemokines and cytotoxic effector molecules [4,60]. A potential disadvantage of this approach is that stimulation with peptides leads to downmodulation of the T cell receptor complex, thereby reducing the number of binding sites for MHC class I tetramers [4,60]. Appay et al. overcame this problem by staining with tetramers prior to peptide stimulation, albeit with some activation-induced tetramer internalization [4]. An alternative approach involves parallel assessment of replicate samples by tetramer and intracellular staining [7,35].
When combined with functional analyses and with cell surface staining for T cell activation and maturation markers, tetramer staining may be used to elucidate the differences between naïve, memory and effector T cell subsets [3,23,36,61–63]. Tetramer staining may be combined with magnetic bead sorting [64], providing an enriched population of epitope-specific T cells for functional assays or molecular analysis of T cell receptor clonality [65].
Similar in principle to MHC class I tetramers, MHC class I-immunoglobulin fusion proteins have been described recently for quantifying CD8+ T cells by flow cytometry (Fig. 2f). These molecules are MHC class I dimers associated non-covalently with beta-2 microglobulin and fused to the VH region of mouse IgG1. The dimers may be ‘loaded’ the day before assay with the peptide of interest, providing a degree of flexibility not afforded by tetramer-peptide complexes [66,67].
Multi-parameter flow cytometry
Rapid new developments in cytometry hardware, fluorochrome dyes and software packages have provided the capability of measuring as many as 13 simultaneous parameters by flow cytometry [68–71] (Fig. 3). These methods, termed multi-parameter flow cytometry, will permit characterization of novel effector cell subsets and rare antigen-specific cell populations. Using eight-colour staining, DeRosa et al. characterized γδ T cell subsets in HIV-1-infected individuals [72]. By combining cell surface staining with antigenic stimulation and CFC, multi-parameter flow cytometry can provide a unique opportunity to obtain maximal information from a single experiment. Although the necessary hardware and fluorochrome dyes remain of limited availability at the present time, these methods hold enormous promise for future development (reviewed in [69]).
Fig. 3.

Excitation and emission spectra of fluorescent dyes used for multi-color flow cytometry. Shown are the excitation and emission spectra for dyes used in multi-colour flow cytometry. Also depicted are commonly used bandpass filters through which the emitted light is passed prior to collection on photomultiplier tubes. Lasers are listed on the far right. Currently up to 11 dyes can be used simultaneously. Abbreviations used are: CasB, cascade blue; CasY, cascade yellow; FITC, fluorescein isothiocyanate; PE, phycoerythrin; TR, Texas red; Cy, cychrome; APC, allophycocyanin. *Due to the spectral overlap of Texas red-PE (TR-PE), the use of this dye in combination with TR, excited by a dye laser tuned to give a 595-nm line, is problematic. Use of other lasers exciting in the red (for example 632 nm HeNe, also 647 nm Krypton and 625 nm diode lasers) in combination with a 488-nm Krypton laser do allow use of TR-PE in combination with all other dyes. However, TR is not excited by these lasers. —, excitation; emission;  , bandpass filter.
Molecular methods: tcr clonotype analysis
Analysis of the T cell receptor (TCR) sequences utilized by antigen-specific clones reveals the diversity of the CTL repertoire, and provides the means of ‘tracking’ individual clones in longitudinal specimens [73–75]. As described by Kalams et al. [74], TCR analysis required limiting dilution culture, followed by mRNA extraction, cDNA synthesis, anchored PCR of Vα and Vβ regions and analysis of unique V–D–J sequences. Recently, Douek et al. described a method that circumvents lengthy in vitro expansion by using IFN-γ production to identify and sort antigen-specific cells viably [76] (Fig. 4a). This method relies on ‘cytokine capture’, in which secreted IFN-γ is captured at the cell surface by a bi-specific antibody reagent recognizing CD45 and IFN-γ [77]. The cells are then stained with a phycoerythrin (PE)-labelled detection antibody and sorted on the basis of PE fluorescence [77]. RNA extracted from sorted cells is subjected to RT-PCR and sequencing of the TCRB locus (Fig. 4b). Individual clonotypes may be tracked in longitudinal samples using clonotype-specific quantitative real-time PCR (qPCR) (Fig. 4c). Using this method, Douek et al. demonstrated that multiple TCR clonotypes target a single HIV-1 epitope and hypothesized that this diversity may provide a degree of ‘plasticity’ that serves to limit CTL escape in vivo [76].
Fig. 4.
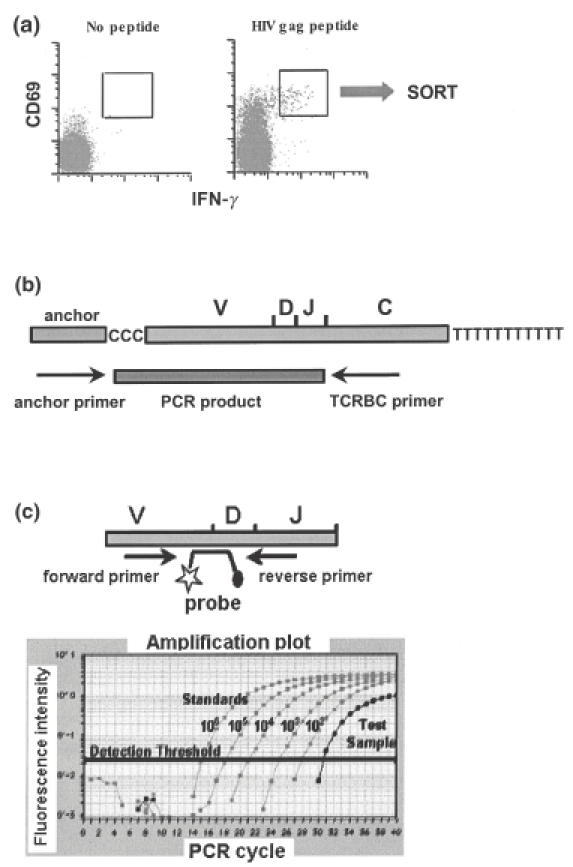
TCR clonotype analysis. (a) As described by Douek et al. [76], antigen-specific cells were stimulated with peptide. Cytokine-producing cells were stained using a ‘cytokine capture’ method in which released IFN-γ is captured at the cell surface by a bispecific reagent recognizing CD45 and IFN-γ. The cells were then stained with a phycoerythrin (PE)-labelled detection antibody and viably sorted on the basis of PE fluorescence. B. RNA extracted from viable sorted cells was subjected to RT-PCR and sequencing of the TCRB locus. (c) Fluorescent probes were designed to identify unique VDJ rearrangements. Individual clones were tracked in longitudinal samples using clonotype-specific quantitative real-time PCR (qPCR).
A window on anatomical ‘sanctuary’ sites
In principle, the same methods utilized to assess T cell populations in peripheral blood may be applied to lymphocytes from a variety of anatomical sites. In practice, the ability to fully exploit these methods is limited by the difficulty of obtaining clinical samples, and the technical problems inherent in isolating workable numbers of viable lymphocytes from tissues.
Skinner et al. described a method for staining antigen-specific CD8+ T cells in situ with MHC class I tetrameric complexes (IST, in situ tetramer staining) [78]. This method allows staining of fresh tissues, using 200 mm sections prepared with a vibratome. Stained sections were analysed with confocal microscopy, permitting detection of cells as deep as 120 mm below the surface. Flow cytometric analysis of T cell suspensions from the same tissues suggested that the sensitivity of the two methods was similar, and background staining of control tissues was acceptably low (0·04% of CD8+ T cells). Staining of prefixed tissue sections or frozen 10 mm sections also provided satisfactory results. This method was used subsequently to detect SIVmac-specific CD8+ T cells in lymph nodes and intestinal tissue from rhesus macaques [48,79].
Mucosal tissues: rhesus macaque studies lead the way
Mucosal tissues serve as a major portal of entry for HIV-1, as well as an important site of viral replication and CD4+ T cell depletion [80–82]. Intestinal or gut-associated lymphoid tissue (GALT) is the largest lymphoid organ in the body and harbours a majority of the body's lymphocytes [83]. Nevertheless, few studies have assessed antiviral T cell responses in human or primate intestinal tissue. Studies of rhesus macaques provided direct demonstration of ex vivo SIVmac-specific cytotoxic activity in CD8+ T cells isolated from intestinal mucosa [84]. For this study, macaques were euthanized and intestinal tissues collected at autopsy. Intestinal intraepithelial lymphocytes (IEL) were isolated by incubation of tissue fragments in balanced salt solution containing dithiothreitol or EDTA, and lymphocytes from the underlying lamina propria layer (LPL) were liberated by collagenase digestion. Purified lymphocytes were tested for cytotoxic activity in 51Cr release assays. Intestinal lymphocytes isolated from macaques at necropsy were also used to assess the kinetics of CD4+ T cell depletion and CD8+ T cell enrichment following acute SIVmac infection [80,81]. More recently, Schmitz et al. used necropsy material to assess the frequency of SIV-specific CD8+ T cells in IEL and LPL with MHC class I tetramers and immunophenotypic analysis [79].
In some studies, fresh jejunal tissue has been obtained from live animals during abdominal midline celiotomy [85]. However, several million viable lymphocytes may be satisfactorily obtained by the far less invasive procedure of endoscopic biopsy. These yields are adequate for MHC class I tetramer staining and cell surface phenotyping [86,87]. Cervical and vaginal tissues from macaques may also be obtained by biopsy or from surgical or necropsy specimens. Sample processing is similar to that used for intestinal tissues [88]. Lymphocytes from these tissues may be stained using MHC class I tetramers [88] or expanded and used as effector cells in 51Cr release assays [89].
Assessment of mucosal t cell responses in humans using biopsy tissue
Human intestinal tissue may be obtained from individuals undergoing surgical resection, but biopsy material can yield sufficient lymphocytes for direct phenotypic analysis [90,91] or polyclonal expansion [90,92,93]. Expanded cultures may be used as effector cells in 51Cr release assays [92,93]. Similarly, cervical lymphocytes may be obtained from biopsy tissue or cytobrush and assessed directly [94,95] or polyclonally expanded [96,97]. Several groups have optimized protocols for isolating fresh, viable lymphocytes from cervical tissue [98,99], and the choice of enzymes is critical for maintaining cell viability and integrity of cell surface markers [98]. A potential drawback to polyclonal expansion is that the clonality of the population may be significantly altered during in vitro propagation. Accordingly, methods that allow direct ex vivo assessment may be more informative.
Where do we go from here?
The methods described in this review provide a series of powerful tools for unravelling the complexities of cell-mediated immune responses to HIV-1 and other viruses. Several important questions regarding CD8+ T cells remain to be explored fully. Increasing interest has focused on determining the extent to which selective pressure from CTL influences viral evolution. The dynamic interplay between HIV-1, CD4+ T cells and CD8+ T cells is influenced by antiretroviral therapy, and antiviral drugs exert additional selective pressures on viral replication. In terms of vaccine development, much work remains to map epitopes in non-clade B viruses and to evaluate the importance of incorporating these epitopes in vaccine formulations. Several studies have alluded to CD8+ T cell ‘dysfunction’ in HIV-1 infection, and the functional analysis of ‘naïve’, ‘memory’ and ‘effector’ T cell subsets has become increasingly complex. Comparative studies of HIV-1 and other viral systems should provide important insights into the ontogeny and functions of these subsets. Lastly, mucosal tissues serve as the major portal of entry for HIV-1, and an important reservoir for viral replication. Virus-T cell interactions in tissues remain incompletely characterized. Understanding the induction of HIV-1-specific immune responses at mucosal surfaces will be critical for vaccine development and for our understanding of pathogenesis.
Acknowledgments
The author thanks the following individuals: Nicole Baumgarth, University of California, Davis, for supplying Fig. 3 and for insightful discussions on multi-parameter flow cytometry; Daniel Douek, NIH Vaccine Research Center (VRC) for supplying Fig. 4; Jeff Harris, Elizabeth Sinclair, Johan K. Sandberg, Douglas F. Nixon and members of the Nixon and McCune laboratories, Gladstone Institute of Virology and Immunology, UCSF, for helpful suggestions and discussions.
REFERENCES
- 1.Gandhi RT, Walker BD. Immunologic control of HIV-1. Annu Rev Med. 2002;53:149–72. doi: 10.1146/annurev.med.53.082901.104011. [DOI] [PubMed] [Google Scholar]
- 2.McMichael AJ, Rowland-Jones SL. Cellular immune responses to HIV. Nature. 2001;410:980–7. doi: 10.1038/35073658. [DOI] [PubMed] [Google Scholar]
- 3.Appay V, Dunbar PR, Callan M, et al. Memory CD8+ T cells vary in differentiation phenotype in different persistent virus infections. Nat Med. 2002;8:379–85. doi: 10.1038/nm0402-379. [DOI] [PubMed] [Google Scholar]
- 4.Appay V, Nixon DF, Donahoe SM, et al. HIV-specific CD8+ T cells produce antiviral cytokines but are impaired in cytolytic functions. J Exp Med. 2000;192:63–75. doi: 10.1084/jem.192.1.63. [DOI] [PMC free article] [PubMed] [Google Scholar]
- 5.Appay V, Papagno L, Spina CA, et al. Dynamics of T cell responses in HIV infection. J Immunol. 2002;168:3660–6. doi: 10.4049/jimmunol.168.7.3660. [DOI] [PubMed] [Google Scholar]
- 6.Lieberman J, Shankar P, Manjunath N, Andersson J. Dressed to kill? A review of why antiviral CD8 T lymphocytes fail to prevent progressive immunodeficiency in HIV-1 infection. Blood. 2001;98:1667–77. doi: 10.1182/blood.v98.6.1667. [DOI] [PubMed] [Google Scholar]
- 7.Shankar P, Russo M, Harnisch B, Patterson M, Skolnik P, Lieberman J. Impaired function of circulating HIV-specific CD8 (+) T cells in chronic human immunodeficiency virus infection. Blood. 2000;96:3094–101. [PubMed] [Google Scholar]
- 8.Shankar P, Xu Z, Lieberman J. Viral-specific cytotoxic T lymphocytes lyse human immunodeficiency virus-infected primary T lymphocytes by the granule exocytosis pathway. Blood. 1999;94:3084–93. [PubMed] [Google Scholar]
- 9.Koup RA, Safrit JT, Cao Y, et al. Temporal association of cellular immune responses with the initial control of viremia in primary human immunodeficiency virus type 1 syndrome. J Virol. 1994;68:4650–5. doi: 10.1128/jvi.68.7.4650-4655.1994. [DOI] [PMC free article] [PubMed] [Google Scholar]
- 10.Borrow P, Lewicki H, Wei X, et al. Antiviral pressure exerted by HIV-1-specific cytotoxic T lymphocytes (CTLs) during primary infection demonstrated by rapid selection of CTL escape virus [see comments] Nat Med. 1997;3:205–11. doi: 10.1038/nm0297-205. [DOI] [PubMed] [Google Scholar]
- 11.Pantaleo G, Demarest JF, Soudeyns H, et al. Major expansion of CD8+ T cells with a predominant V beta usage during the primary immune response to HIV. Nature. 1994;370:463–7. doi: 10.1038/370463a0. [DOI] [PubMed] [Google Scholar]
- 12.Pantaleo G, Demarest JF, Schacker T, et al. The qualitative nature of the primary immune response to HIV infection is a prognosticator of disease progression independent of the initial level of plasma viremia. Proc Natl Acad Sci U S A. 1997;94:254–8. doi: 10.1073/pnas.94.1.254. [DOI] [PMC free article] [PubMed] [Google Scholar]
- 13.Jin X, Bauer DE, Tuttleton SE, et al. Dramatic rise in plasma viremia after CD8 (+) T cell depletion in simian immunodeficiency virus-infected macaques. J Exp Med. 1999;189:991–8. doi: 10.1084/jem.189.6.991. [DOI] [PMC free article] [PubMed] [Google Scholar]
- 14.Barouch DH, Kunstman J, Kuroda MJ, et al. Eventual AIDS vaccine failure in a rhesus monkey by viral escape from cytotoxic T lymphocytes. Nature. 2002;415:335–9. doi: 10.1038/415335a. [DOI] [PubMed] [Google Scholar]
- 15.Moore CB, John M, James IR, Christiansen FT, Witt CS, Mallal SA. Evidence of HIV-1 adaptation to HLA-restricted immune responses at a population level. Science. 2002;296:1439–43. doi: 10.1126/science.1069660. [DOI] [PubMed] [Google Scholar]
- 16.Schwartz O, Marechal V, Le Gall S, Lemonnier F, Heard JM. Endocytosis of major histocompatibility class I molecules is induced by the HIV-Nef protein. Nat Med. 1996;2:338–42. doi: 10.1038/nm0396-338. [DOI] [PubMed] [Google Scholar]
- 17.Collins KL, Chen BK, Kalams SA, Walker BD, Baltimore D. HIV-1 Nef protein protects infected primary cells against killing by cytotoxic T lymphocytes. Nature. 1998;391:397–401. doi: 10.1038/34929. [DOI] [PubMed] [Google Scholar]
- 18.Zajac AJ, Blattman JN, Murali-Krishna K, et al. Viral immune evasion due to persistence of activated T cells without effector function. J Exp Med. 1998;188:2205–13. doi: 10.1084/jem.188.12.2205. [DOI] [PMC free article] [PubMed] [Google Scholar]
- 19.Douek DC, Brenchley JM, Betts MR, et al. HIV preferentially infects HIV-specific CD4+ T cells. Nature. 2002;417:95–8. doi: 10.1038/417095a. [DOI] [PubMed] [Google Scholar]
- 20.Andersson J, Behbahani H, Lieberman J, et al. Perforin is not co-expressed with granzyme A within cytotoxic granules in CD8 T lymphocytes present in lymphoid tissue during chronic HIV infection. Aids. 1999;13:1295–303. doi: 10.1097/00002030-199907300-00005. [DOI] [PubMed] [Google Scholar]
- 21.Chen G, Shankar P, Lange C, et al. CD8 T cells specific for human immunodeficiency virus, Epstein–Barr virus, and cytomegalovirus lack molecules for homing to lymphoid sites of infection. Blood. 2001;98:156–64. doi: 10.1182/blood.v98.1.156. [DOI] [PubMed] [Google Scholar]
- 22.Trimble LA, Shankar P, Patterson M, Daily JP, Lieberman J. Human immunodeficiency virus-specific circulating CD8 T lymphocytes have down-modulated CD3zeta and CD28, key signaling molecules for T-cell activation. J Virol. 2000;74:7320–30. doi: 10.1128/jvi.74.16.7320-7330.2000. [DOI] [PMC free article] [PubMed] [Google Scholar]
- 23.Champagne P, Ogg GS, King AS, et al. Skewed maturation of memory HIV-specific CD8 T lymphocytes. Nature. 2001;410:106–11. doi: 10.1038/35065118. [DOI] [PubMed] [Google Scholar]
- 24.Coligan J, Kruisbeek A, Margulies D, Shevach E, Strober W, editors. Current protocols in immunology. New York: Wiley Interscience; [Google Scholar]
- 25.Nixon DF, Townsend AR, Elvin JG, Rizza CR, Gallwey J, McMichael AJ. HIV-1 gag-specific cytotoxic T lymphocytes defined with recombinant vaccinia virus and synthetic peptides. Nature. 1988;336:484–7. doi: 10.1038/336484a0. [DOI] [PubMed] [Google Scholar]
- 26.Doherty PC. The new numbers game for virus-specific CD8+ T cells. Science. 1998;280:227. doi: 10.1126/science.280.5361.227. [DOI] [PubMed] [Google Scholar]
- 27.Callan MF, Tan L, Annels N, et al. Direct visualization of antigen-specific CD8+ T cells during the primary immune response to Epstein–Barr virus in vivo. J Exp Med. 1998;187:1395–402. doi: 10.1084/jem.187.9.1395. [DOI] [PMC free article] [PubMed] [Google Scholar]
- 28.Lalvani A, Brookes R, Hambleton S, Britton WJ, Hill AV, McMichael AJ. Rapid effector function in CD8+ memory T cells. J Exp Med. 1997;186:859–65. doi: 10.1084/jem.186.6.859. [DOI] [PMC free article] [PubMed] [Google Scholar]
- 29.Tan LC, Gudgeon N, Annels NE, et al. A re-evaluation of the frequency of CD8+ T cells specific for EBV in healthy virus carriers. J Immunol. 1999;162:1827–35. [PubMed] [Google Scholar]
- 30.Liu L, Chahroudi A, Silvestri G, et al. Visualization and quantification of T cell-mediated cytotoxicity using cell-permeable fluorogenic caspase substrates. Nat Med. 2002;8:185–9. doi: 10.1038/nm0202-185. [DOI] [PubMed] [Google Scholar]
- 31.Sheehy ME, McDermott AB, Furlan SN, Klenerman P, Nixon DF. A novel technique for the fluorometric assessment of T lymphocyte antigen specific lysis. J Immunol Meth. 2001;249:99–110. doi: 10.1016/s0022-1759(00)00329-x. [DOI] [PubMed] [Google Scholar]
- 32.Lecoeur H, Fevrier M, Garcia S, Riviere Y, Gougeon ML. A novel flow cytometric assay for quantitation and multi-parametric characterization of cell-mediated cytotoxicity. J Immunol Meth. 2001;253:177–87. doi: 10.1016/s0022-1759(01)00359-3. [DOI] [PubMed] [Google Scholar]
- 33.Hislop AD, Gudgeon NH, Callan MF, et al. EBV-specific CD8+ T cell memory: relationships between epitope specificity, cell phenotype, and immediate effector function. J Immunol. 2001;167:2019–29. doi: 10.4049/jimmunol.167.4.2019. [DOI] [PubMed] [Google Scholar]
- 34.Catalina MD, Sullivan JL, Brody RM, Luzuriaga K. Phenotypic and functional heterogeneity of EBV epitope-specific CD8+ T cells. J Immunol. 2002;168:4184–91. doi: 10.4049/jimmunol.168.8.4184. [DOI] [PubMed] [Google Scholar]
- 35.Sandberg JK, Fast NM, Nixon DF. Functional heterogeneity of cytokines and cytolytic effector molecules in human CD8 (+) T lymphocytes. J Immunol. 2001;167:181–7. doi: 10.4049/jimmunol.167.1.181. [DOI] [PubMed] [Google Scholar]
- 36.Hamann D, Baars PA, Rep MH, et al. Phenotypic and functional separation of memory and effector human CD8+ T cells. J Exp Med. 1997;186:1407–18. doi: 10.1084/jem.186.9.1407. [DOI] [PMC free article] [PubMed] [Google Scholar]
- 37.Garba ML, Pilcher CD, Bingham AL, Eron J, Frelinger JA. HIV antigens can induce TGF-beta (1)-producing immunoregulatory CD8+ T cells. J Immunol. 2002;168:2247–54. doi: 10.4049/jimmunol.168.5.2247. [DOI] [PubMed] [Google Scholar]
- 38.Wagner L, Yang OO, Garcia-Zepeda EA, et al. Beta-chemokines are released from HIV-1-specific cytolytic T cell granules complexed to proteoglycans. Nature. 1998;391:908–11. doi: 10.1038/36129. [DOI] [PubMed] [Google Scholar]
- 39.Maecker HT, Maino VC, Picker LJ. Immunofluorescence analysis of T cell responses in health and disease. J Clin Immunol. 2000;20:391–9. doi: 10.1023/a:1026403724413. [DOI] [PubMed] [Google Scholar]
- 40.Abbas AK, Lichtman AH, Pober JS. Cellular and molecular immunology. 4. Philadelphia: WB Saunders Co; 2000. [Google Scholar]
- 41.Moretto WJ, Drohan LA, Nixon DF. Rapid quantification of SIV-specific CD8 T cell responses with recombinant vaccinia virus ELISPOT or cytokine flow cytometry. AIDS. 2001;14:2625–7. doi: 10.1097/00002030-200011100-00034. [DOI] [PubMed] [Google Scholar]
- 42.Kern F, Surel IP, Brock C, et al. T cell epitope mapping by flow cytometry. Nat Med. 1998;4:975–8. doi: 10.1038/nm0898-975. [DOI] [PubMed] [Google Scholar]
- 43.Betts MR, Ambrozak DR, Douek DC, et al. Analysis of total human immunodeficiency virus (HIV)-specific CD4 (+) and CD8 (+) T cell responses: relationship to viral load in untreated HIV infection. J Virol. 2001;75:11983–91. doi: 10.1128/JVI.75.24.11983-11991.2001. [DOI] [PMC free article] [PubMed] [Google Scholar]
- 44.Betts MR, Casazza JP, Patterson BA, et al. Putative immunodominant human immunodeficiency virus-specific CD8 (+) T-cell responses cannot be predicted by major histocompatibility complex class I haplotype. J Virol. 2000;74:9144–51. doi: 10.1128/jvi.74.19.9144-9151.2000. [DOI] [PMC free article] [PubMed] [Google Scholar]
- 45.Ogg GS, Jin X, Bonhoeffer S, et al. Quantitation of HIV-1-specific cytotoxic T lymphocytes and plasma load of viral RNA. Science. 1998;279:2103–6. doi: 10.1126/science.279.5359.2103. [DOI] [PubMed] [Google Scholar]
- 46.Altman JD, Moss PA, Goulder PJ, et al. Phenotypic analysis of antigen-specific T lymphocytes. Science. 1996;274:94–6. [PubMed] [Google Scholar]
- 47.Ogg GS, McMichael AJ. Quantitation of antigen-specific CD8+ T cell responses. Immunol Lett. 1999;66:77–80. doi: 10.1016/s0165-2478(98)00161-8. [DOI] [PubMed] [Google Scholar]
- 48.Mothe BR, Horton H, Carter DK, et al. Dominance of CD8 responses specific for epitopes bound by a single major histocompatibility complex class I molecule during the acute phase of viral infection. J Virol. 2002;76:875–84. doi: 10.1128/JVI.76.2.875-884.2002. [DOI] [PMC free article] [PubMed] [Google Scholar]
- 49.Czerkinsky CC, Nilsson LA, Nygren H, Ouchterlony O, Tarkowski A. A solid-phase enzyme-linked immunospot (ELISPOT) assay for enumeration of specific antibody-secreting cells. J Immunol Meth. 1983;65:109–21. doi: 10.1016/0022-1759(83)90308-3. [DOI] [PubMed] [Google Scholar]
- 50.Czerkinsky C, Andersson G, Ekre HP, Nilsson LA, Klareskog L, Ouchterlony O. Reverse ELISPOT assay for clonal analysis of cytokine production. I. Enumeration of gamma-interferon-secreting cells. J Immunol Meth. 1988;110:29–36. doi: 10.1016/0022-1759(88)90079-8. [DOI] [PubMed] [Google Scholar]
- 51.Murali-Krishna K, Altman JD, Suresh M, et al. Counting antigen-specific CD8 T cells: a reevaluation of bystander activation during viral infection. Immunity. 1998;8:177–87. doi: 10.1016/s1074-7613(00)80470-7. [DOI] [PubMed] [Google Scholar]
- 52.Larsson M, Jin X, Ramratnam B, et al. A recombinant vaccinia virus based ELISPOT assay detects high frequencies of Pol-specific CD8 T cells in HIV-1-positive individuals. AIDS. 1999;13:767–77. doi: 10.1097/00002030-199905070-00005. [DOI] [PubMed] [Google Scholar]
- 53.van der Meide PH, Groenestein RJ, de Labie MC, Heeney J, Pala P, Slaoui M. Enumeration of lymphokine-secreting cells as a quantitative measure for cellular immune responses in rhesus macaques. J Med Primatol. 1995;24:271–81. doi: 10.1111/j.1600-0684.1995.tb00181.x. [DOI] [PubMed] [Google Scholar]
- 54.Larsson M, Messmer D, Somersan S, et al. Requirement of mature dendritic cells for efficient activation of influenza A-specific memory CD8+ T cells. J Immunol. 2000;165:1182–90. doi: 10.4049/jimmunol.165.3.1182. [DOI] [PubMed] [Google Scholar]
- 55.Larsson M, Wilkens DT, Fonteneau JF, et al. Amplification of low-frequency antiviral CD8+ T cell responses using autologous dendritic cells. AIDS. 2002;16:171–80. doi: 10.1097/00002030-200201250-00005. [DOI] [PubMed] [Google Scholar]
- 56.World Health Organization (WHO) Weekly Epidemiol Record. 1998. pp. 381–4.
- 57.Altfeld MA, Trocha A, Eldridge RL, et al. Identification of dominant optimal HLA-B60- and HLA-B61-restricted cytotoxic T-lymphocyte (CTL) epitopes: rapid characterization of CTL responses by enzyme-linked immunospot assay. J Virol. 2000;74:8541–9. doi: 10.1128/jvi.74.18.8541-8549.2000. [DOI] [PMC free article] [PubMed] [Google Scholar]
- 58.Goulder PJ, Addo MM, Altfeld MA, et al. Rapid definition of five novel HLA-A*3002-restricted human immunodeficiency virus-specific cytotoxic T-lymphocyte epitopes by ELISPOT and intracellular cytokine staining assays. J Virol. 2001;75:1339–47. doi: 10.1128/JVI.75.3.1339-1347.2001. [DOI] [PMC free article] [PubMed] [Google Scholar]
- 59.Kern F, Surel IP, Faulhaber H, Frommel C, et al. Target structures of the CD8+ T cell response to human cytomegalovirus: the 72-kD major immediate-early protein revisited. J Virol. 1999;73:8179–84. doi: 10.1128/jvi.73.10.8179-8184.1999. [DOI] [PMC free article] [PubMed] [Google Scholar]
- 60.He XS, Rehermann B, Boisvert J, et al. Direct functional analysis of epitope-specific CD8+ T cells in peripheral blood. Viral Immunol. 2001;14:59–69. doi: 10.1089/08828240151061400. [DOI] [PubMed] [Google Scholar]
- 61.Campbell JJ, Murphy KE, Kunkel EJ, et al. CCR7 expression and memory T cell diversity in humans. J Immunol. 2001;166:877–84. doi: 10.4049/jimmunol.166.2.877. [DOI] [PubMed] [Google Scholar]
- 62.Oehen S, Brduscha-Riem K. Differentiation of naive CTL to effector and memory CTL. correlation of effector function with phenotype and cell division. J Immunol. 1998;161:5338–46. [PubMed] [Google Scholar]
- 63.Lanzavecchia A, Sallusto F. Dynamics of T lymphocyte responses: intermediates, effectors, and memory cells. Science. 2000;290:92–7. doi: 10.1126/science.290.5489.92. [DOI] [PubMed] [Google Scholar]
- 64.McDermott AB, Spiegel HML, Irsch J, Ogg GS, Nixon DF. A simple and rapid magnetic bead separation technique for the isolation of tetramer-positive virus-specific CD8 T cells. AIDS. 2001;15:810–2. doi: 10.1097/00002030-200104130-00024. [DOI] [PubMed] [Google Scholar]
- 65.Lim A, Baron V, Ferradini L, Bonneville M, Kourilsky P, Pannetier C. Combination of MHC-peptide multimer-based T cell sorting with the Immunoscope permits sensitive ex vivo quantitation and follow-up of human CD8+ T cell immune responses. J Immunol Meth. 2002;261:177–94. doi: 10.1016/s0022-1759(02)00004-2. [DOI] [PubMed] [Google Scholar]
- 66.O'Herrin SM, Lebowitz MS, Bieler JG, et al. Analysis of the expression of peptide-major histocompatibility complexes using high affinity soluble divalent T cell receptors. J Exp Med. 1997;186:1333–45. doi: 10.1084/jem.186.8.1333. [DOI] [PMC free article] [PubMed] [Google Scholar]
- 67.Dal Porto J, Johansen TE, Catipovic B, et al. A soluble divalent class I major histocompatibility complex molecule inhibits alloreactive T cells at nanomolar concentrations. Proc Natl Acad Sci USA. 1993;90:6671–5. doi: 10.1073/pnas.90.14.6671. [DOI] [PMC free article] [PubMed] [Google Scholar]
- 68.De Rosa SC, Herzenberg LA, Roederer M. 11-color, 13-parameter flow cytometry: identification of human naive T cells by phenotype, function, and T cell receptor diversity. Nat Med. 2001;7:245–8. doi: 10.1038/84701. [DOI] [PubMed] [Google Scholar]
- 69.Baumgarth N, Roederer M. A practical approach to multi-color flow cytometry for immunophenotyping. J Immunol Meth. 2000;243:77–97. doi: 10.1016/s0022-1759(00)00229-5. [DOI] [PubMed] [Google Scholar]
- 70.Bigos M, Baumgarth N, Jager GC, et al. Nine color eleven parameter immunophenotyping using three laser flow cytometry. Cytometry. 1999;36:36–45. doi: 10.1002/(sici)1097-0320(19990501)36:1<36::aid-cyto5>3.3.co;2-0. [DOI] [PubMed] [Google Scholar]
- 71.Roederer M, De Rosa S, Gerstein R, et al. 8 color, 10-parameter flow cytometry to elucidate complex leukocyte heterogeneity. Cytometry. 1997;29:328–39. doi: 10.1002/(sici)1097-0320(19971201)29:4<328::aid-cyto10>3.0.co;2-w. [DOI] [PubMed] [Google Scholar]
- 72.De Rosa SC, Mitra DK, Watanabe N, Herzenberg LA, Roederer M. Vdelta1 and Vdelta2 gammadelta T cells express distinct surface markers and might be developmentally distinct lineages. J Leukoc Biol. 2001;70:518–26. [PubMed] [Google Scholar]
- 73.Kalams SA, Johnson RP, Dynan MJ, et al. T cell receptor usage and fine specificity of human immunodeficiency virus 1-specific cytotoxic T lymphocyte clones: analysis of quasispecies recognition reveals a dominant response directed against a minor in vivo variant. J Exp Med. 1996;183:1669–79. doi: 10.1084/jem.183.4.1669. [DOI] [PMC free article] [PubMed] [Google Scholar]
- 74.Kalams SA, Johnson RP, Trocha AK, et al. Longitudinal analysis of T cell receptor (TCR) gene usage by human immunodeficiency virus 1 envelope-specific cytotoxic T lymphocyte clones reveals a limited TCR repertoire. J Exp Med. 1994;179:1261–71. doi: 10.1084/jem.179.4.1261. [DOI] [PMC free article] [PubMed] [Google Scholar]
- 75.Nixon DF, Douek D, Kuebler PJ, et al. Molecular tracking of an human immunodeficiency virus nef specific cytotoxic T cell clone shows persistence of clone-specific T cell receptor DNA but not mRNA following early combination antiretroviral therapy. Immunol Lett. 1999;66:219–28. doi: 10.1016/s0165-2478(98)00162-x. [DOI] [PubMed] [Google Scholar]
- 76.Douek DC, Betts MR, Brenchley JM, et al. A novel approach to the analysis of specificity, clonality, and frequency of HIV-specific T cell responses reveals a potential mechanism for control of viral escape. J Immunol. 2002;168:3099–104. doi: 10.4049/jimmunol.168.6.3099. [DOI] [PubMed] [Google Scholar]
- 77.Brosterhus H, Brings S, Leyendeckers H, et al. Enrichment and detection of live antigen-specific CD4 (+) and CD8 (+) T cells based on cytokine secretion. Eur J Immunol. 1999;29:4053–9. doi: 10.1002/(SICI)1521-4141(199912)29:12<4053::AID-IMMU4053>3.0.CO;2-C. [DOI] [PubMed] [Google Scholar]
- 78.Skinner PJ, Daniels MA, Schmidt CS, Jameson SC, Haase AT. Cutting edge. In situ tetramer staining of antigen-specific T cells in tissues. J Immunol. 2000;165:613–7. doi: 10.4049/jimmunol.165.2.613. [DOI] [PubMed] [Google Scholar]
- 79.Schmitz JE, Veazey RS, Kuroda MJ, et al. Simian immunodeficiency virus (SIV)-specific cytotoxic T lymphocytes in gastrointestinal tissues of chronically SIV-infected rhesus monkeys. Blood. 2001;98:3757–61. doi: 10.1182/blood.v98.13.3757. [DOI] [PubMed] [Google Scholar]
- 80.Heise C, Miller CJ, Lackner A, Dandekar S. Primary acute simian immunodeficiency virus infection of intestinal lymphoid tissue is associated with gastrointestinal dysfunction. J Infect Dis. 1994;169:1116–20. doi: 10.1093/infdis/169.5.1116. [DOI] [PubMed] [Google Scholar]
- 81.Mattapallil JJ, Smit-McBride Z, McChesney M, Dandekar S. Intestinal intraepithelial lymphocytes are primed for gamma interferon and MIP-1beta expression and display antiviral cytotoxic activity despite severe CD4 (+) T cell depletion in primary simian immunodeficiency virus infection. J Virol. 1998;72:6421–9. doi: 10.1128/jvi.72.8.6421-6429.1998. [DOI] [PMC free article] [PubMed] [Google Scholar]
- 82.Veazey R, DeMaria M, Chalifoux L, et al. Gastrointestinal tract as a major site of CD4+ T cell depletion and viral replication in SIV infection. Science. 1998;280:427–31. doi: 10.1126/science.280.5362.427. [DOI] [PubMed] [Google Scholar]
- 83.Mowat A, Viney J. The anatomical basis of intestinal immunity. Immunol Rev. 1997;156:145–66. doi: 10.1111/j.1600-065x.1997.tb00966.x. [DOI] [PubMed] [Google Scholar]
- 84.Couedel-Courteille A, Le Grand R, Tulliez M, Guillet J, Venet A. Direct ex vivo simian immunodeficiency virus (SIV)-specific cytotoxic activity detected from small intestine intraepithelial lymphocytes of SIV-infected macaques at an advanced stage of infection. J Virol. 1997;71:1052–7. doi: 10.1128/jvi.71.2.1052-1057.1997. [DOI] [PMC free article] [PubMed] [Google Scholar]
- 85.Murphey-Corb M, Wilson LA, Trichel AM, et al. Selective induction of protective MHC class I-restricted CTL in the intestinal lamina propria of rhesus monkeys by transient SIV infection of the colonic mucosa. J Immunol. 1999;162:540–9. [PubMed] [Google Scholar]
- 86.Veazey RS, Gauduin MC, Mansfield KG, et al. Emergence and kinetics of simian immunodeficiency virus-specific CD8 (+) T cells in the intestines of macaques during primary infection. J Virol. 2001;75:10515–9. doi: 10.1128/JVI.75.21.10515-10519.2001. [DOI] [PMC free article] [PubMed] [Google Scholar]
- 87.Cromwell MA, Veazey RS, Altman JD, et al. Induction of mucosal homing virus-specific CD8 (+) T lymphocytes by attenuated simian immunodeficiency virus. J Virol. 2000;74:8762–6. doi: 10.1128/jvi.74.18.8762-8766.2000. [DOI] [PMC free article] [PubMed] [Google Scholar]
- 88.Stevceva L, Kelsall B, Nacsa J, et al. Cervicovaginal lamina propria lymphocytes: phenotypic characterization and their importance in cytotoxic T-lymphocyte responses to simian immunodeficiency virus SIVmac251. J Virol. 2002;76:9–18. doi: 10.1128/JVI.76.1.9-18.2002. [DOI] [PMC free article] [PubMed] [Google Scholar]
- 89.Lohman BL, Miller CJ, McChesney MB. Antiviral cytotoxic T lymphocytes in vaginal mucosa of simian immunodeficiency virus-infected rhesus macaques. J Immunol. 1995;155:5855–60. [PMC free article] [PubMed] [Google Scholar]
- 90.Anton PA, Elliot J, Poles MA, et al. Enhanced levels of functional HIV-1 co-receptors on human mucosal T cells demonstrated using intestinal biopsy tissue. AIDS. 2000;14:1761–5. doi: 10.1097/00002030-200008180-00011. [DOI] [PubMed] [Google Scholar]
- 91.Poles MA, Elliott J, Taing P, Anton PA, Chen IS. A preponderance of CCR5 (+) CXCR4 (+) mononuclear cells enhances gastrointestinal mucosal susceptibility to human immunodeficiency virus type 1 infection. J Virol. 2001;75:8390–9. doi: 10.1128/JVI.75.18.8390-8399.2001. [DOI] [PMC free article] [PubMed] [Google Scholar]
- 92.Shacklett BL, Beadle TJ, Pacheco PA, et al. Isolation of cytomegalovirus-specific cytotoxic T-lymphocytes from gut- associated lymphoid tissue (GALT) of HIV type 1-infected subjects. AIDS Res Hum Retroviruses. 2000;16:1157–62. doi: 10.1089/088922200415009. [DOI] [PubMed] [Google Scholar]
- 93.Shacklett BL, Beadle TJ, Pacheco PA, et al. Characterization of HIV-1-specific cytotoxic T lymphocytes expressing the mucosal lymphocyte integrin CD103 in rectal and duodenal lymphoid tissue of HIV-1-infected subjects. Virology. 2000;270:317–27. doi: 10.1006/viro.2000.0299. [DOI] [PubMed] [Google Scholar]
- 94.Kaul R, Plummer FA, Kimani J, et al. HIV-1-specific mucosal CD8+ lymphocyte responses in the cervix of HIV-1-resistant prostitutes in Nairobi. J Immunol. 2000;164:1602–11. doi: 10.4049/jimmunol.164.3.1602. [DOI] [PubMed] [Google Scholar]
- 95.Shacklett BL, Cu-Uvin S, Beadle TJ, et al. Quantification of HIV-1-specific T cell responses at the mucosal cervicovaginal surface. Aids. 2000;14:1911–5. doi: 10.1097/00002030-200009080-00005. [DOI] [PubMed] [Google Scholar]
- 96.Musey L, Hu Y, Eckert L, Christensen M, Karchmer T, McElrath MJ. HIV-1 induces cytotoxic T lymphocytes in the cervix of infected women. J Exp Med. 1997;185:293–303. doi: 10.1084/jem.185.2.293. [DOI] [PMC free article] [PubMed] [Google Scholar]
- 97.White HD, Musey LK, Andrews MM, et al. Human immunodeficiency virus-specific and CD3-redirected cytotoxic T lymphocyte activity in the human female reproductive tract: lack of correlation between mucosa and peripheral blood. J Infect Dis. 2001;183:977–83. doi: 10.1086/319253. [DOI] [PubMed] [Google Scholar]
- 98.White HD, Prabhala RH, Humphrey SL, Crassi KM, Richardson JM, Wira CR. A method for the dispersal and characterization of leukocytes from the human female reproductive tract. Am J Reprod Immunol. 2000;44:96–103. doi: 10.1111/j.8755-8920.2000.440205.x. [DOI] [PubMed] [Google Scholar]
- 99.Hladik F, Lentz G, Delpit E, McElroy A, McElrath MJ. Coexpression of CCR5 and IL-2 in human genital but not blood T cells: implications for the ontogeny of the CCR5+ Th1 phenotype. J Immunol. 1999;163:2306–13. [PubMed] [Google Scholar]