Abstract
Precise matching of energy supply with demand requires delicately balanced control of the enzymes involved in substrate metabolism. In response to a change in substrate supply, the nonlinear properties of metabolic control may induce complex dynamic behavior. Using confocal imaging of flavoprotein redox potential and mitochondrial membrane potential, we show that substrate deprivation leads to subcellular heterogeneity of mitochondrial energization in intact cells. The complex spatiotemporal patterns of redox and matrix potential included local metabolic transients, cell-wide coordinated redox transitions, and propagated metabolic waves both within and between coupled cells. Loss of metabolic synchrony during mild metabolic stress reveals that intra- and intercellular control of mitochondrial function involves diffusible cytoplasmic messengers.
Nonlinear dynamic control in metabolic pathways plays a crucial role in conferring sensitivity and rapid responses to changes in cellular workload or environmental conditions. Through a combination of allosteric and stoichiometric effects on multiple control points, the enzymatic pathways involved in energy metabolism can undergo large changes in activity in response to small perturbations of key effector molecules (1). Experimental and theoretical studies have demonstrated that, under some conditions, such finely tuned systems may become unstable and display self-organizing oscillations, bistability, or chaotic behavior (reviewed in ref. 2). Early observations of metabolic oscillations in yeast (3–5) and our own investigation of oscillations of NADH and sarcolemmal K,ATP current in substrate-deprived heart cells (6) provide evidence that such phenomena can be observed in intact cells. In our previous work, modulation of the amplitude and/or frequency of the oscillations by external glucose led to the hypothesis that they were driven by a glycolytic oscillator, but the predominantly mitochondrial origin of the NADH fluorescence in cardiomyocytes (7) suggested that metabolic transients in oxidative phosphorylation were also present.
To investigate the mitochondrial component of the oscillations, the present study uses the endogenous fluorescence of flavoproteins to image redox oscillations in the mitochondrial matrix. Subcellular imaging reveals a remarkable degree of spatial and temporal heterogeneity in mitochondrial redox and electrical potential, including local transients and propagated metabolic waves. The last observation suggests that communication between mitochondria in the same or neighboring cells is likely to involve diffusible cytosolic messengers acting to synchronize the energy state of the entire population of mitochondria.
MATERIALS AND METHODS
All experiments were carried out at room temperature on adult guinea pig ventricular myocytes prepared by enzymatic dispersion, as previously described (6, 8). After isolation, cells were typically stored in a cardioplegic high-potassium solution (9) containing 120 mM K-glutamate, 25 mM KCl, 1 mM MgCl2, 10 mM Hepes, 0.1 mM EGTA, and 10 mM glucose, or, in control experiments, a modified Tyrode’s solution containing 140 mM NaCl, 5 mM KCl, 1 mM MgCl2, 10 mM Hepes, 10 mM glucose, and 0.2 mM CaCl2. The particular storage medium had no impact on the observed phenomena. Experimental recordings began after a short equilibration period (5–10 min) in glucose-free Tyrode’s solution (of the same composition as above, except without glucose and with 2 mM CaCl2) after transferring cells into an open superfusion chamber that provided unrestricted access to atmospheric oxygen. Fluorescence images were obtained by using Nikon PlanApo ×40 or ×60 water immersion objective lenses on a Nikon Diaphot-300 inverted microscope with a PCM-2000 confocal attachment equipped with Argon and Helium-Neon lasers. Mitochondrial matrix redox potential was estimated from flavoprotein autofluorescence (488 nm excitation/520 ± 15 nm or 515–565 nm emission). The source of the signal was determined to be primarily from NADH-linked α-lipoamide dehydrogenase, as previously described (10, 11), by testing the ability of mitochondrial uncouplers to change autofluorescence in the presence of rotenone, which prevents NADH-linked flavins from being oxidized (data not shown). Mitochondrial flavoproteins were predominantly reduced at the onset of the experiments. To image the distribution of mitochondrial inner-membrane electrical potential, 100 nM tetramethylrhodamine ethyl ester (TMRE) was added to the external solution and allowed to equilibrate for 20 min. In some experiments, TMRE fluorescence (543 nm excitation/605 ± 16 nm emission) and redox potential were collected simultaneously by using two separate color channels on the detector assembly (red and green planes of the resulting rgb images, respectively). Sequential 1,024 × 1,024 or 640 × 480 pixel gray scale (8-bits per pixel; redox only) or color (8-bits per pixel per plane; redox and TMRE) confocal images from the same optical section were acquired and stored at 5- to 10-sec intervals. The intervals between images noted in the legends are approximate because of timing variability introduced by the acquisition software; time plots have been adjusted to correspond to the actual acquisition time of each frame. Precautions were taken to reduce possible photo-induced cell or fluorophore damage: in control experiments, varying the input laser excitation intensity over a wide range did not affect the observed phenomena and affected only the rate of flavoprotein photobleaching, which was small enough to permit us to record hundreds of images in long-term (hours) experiments. Time-series images were analyzed off-line on a Silicon Graphics O2 workstation (Silicon Graphics, Mountain View, CA) by using the Tcl language interface to the SGI imagevision library or on a PC with the shareware program imagetool (University of Texas at San Antonio Health Sciences Center).
RESULTS AND DISCUSSION
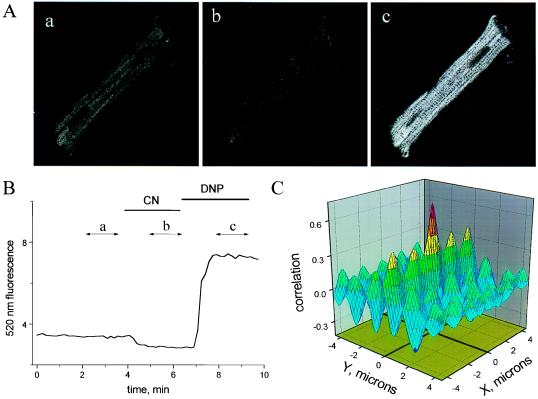
When excited with blue-green light, the autofluorescence of cardiac cells arises predominantly from mitochondrial dehydrogenases containing tightly bound flavin adenine dinucleotide (FAD), whose redox state is linked to that of mitochondrial NADH (10–14). The fluorescence of flavoproteins increases when oxidized; thus, these proteins serve as endogenous local reporters of mitochondrial matrix redox potential. In addition to confinement of the signal to the mitochondrial compartment, a significant advantage of measuring flavoprotein fluorescence is that the excitation (488 nm) and emission (520 nm) wavelengths are similar to those of fluorescein, allowing us to image redox potential without exposing the cell to potentially injurious ultraviolet light [as is used for NADH excitation (7)]. Flavoprotein signal decreases to a minimum in the presence of the cytochrome oxidase inhibitor cyanide (CN), and increases when the CN solution is replaced by one containing the mitochondrial uncoupler 2,4-dinitrophenol (DNP; Fig. 1 A and B). In addition, the spatial distribution of flavoprotein fluorescence paralleled that of mitochondria labeled with TMRE (15, 16), a cationic fluorophore that preferentially accumulates in the mitochondria owing to the large negative electrical potential of the matrix (≈−150 mV relative to cytoplasm) (17, 18). The close correspondence of flavoprotein and TMRE localization is clearly evident when simultaneously collected redox and TMRE images are cross-correlated (Fig. 1C). The resulting correlation map displays a large and narrow central peak with a maximum at 0.75 (1 being a perfect correlation), indicating coincidence of both images. A number of peripheral peaks are also evident, arising from the periodic structure conferred by the packing of mitochondria along myofibrillar bundles (periodicities in the Y-dimension) and between sarcomeric z-lines (periodicities in the X-dimension) (19).
Figure 1.
Mitochondrial redox in a cardiomyocyte. (A, a–c) Confocal images of endogenous flavoprotein fluorescence in the control (10 mM glucose-containing modified Tyrode’s; A, a), fully reduced (4 mM cyanide; A, b), and fully oxidized (200 μM 2,4-dinitrophenol; A, c) states. Each image was the average of 10 frames taken during the time segments shown in B (labeled a, b, c). Pixel brightness increases with oxidation of the mitochondrial flavoproteins. The spacing of the sarcomeric z-lines (transverse dark bands in A, c) is ≈1.8 μm, giving an internal scale of the images. (B) The time course of mean cell autofluorescence intensity change (arbitrary units) under fully reduced (cyanide) or oxidized (2,4-dinitrophenol) conditions. Image frames in the series were collected ≈10 sec apart. (C) Cross-correlation plot for simultaneously collected flavoprotein and TMRE fluorescence images (images not shown, but similar to Fig. 5A, a) demonstrating localization of the redox signal to the mitochondrial matrix.
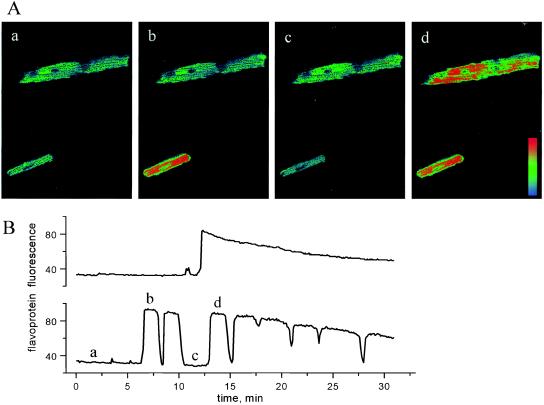
In contrast to the predictable effects of DNP or CN on steady-state redox potential, myocytes studied in the absence of exogenous metabolic substrate underwent rapid and periodic transitions between the reduced and oxidized states, as revealed by marked changes in flavoprotein fluorescence (Fig. 2A). A plot of the average fluorescence for each of the cells depicted in Fig. 2A over a longer time span illustrates two commonly observed patterns of mitochondrial redox transitions: (i) oscillations having a period in the range of 1–3 min (Fig. 2B Lower and c.f. ref. 6) or (ii) a maintained switch from reduced to oxidized (Fig. 2B Upper) or oxidized to reduced (not shown). Of note is the lack of correlation of redox transients among cells physically separated from each other in the microscopic field, indicating that there were no external messengers coordinating metabolic function. This was also true of adjacent, but unconnected, cells (not shown). Redox transitions occurred quite rapidly, faster than the time resolution of this experiment (≈6 sec between sequential images), and fluorescence was relatively homogeneously distributed throughout the cell, except for a few highly localized foci of oxidized mitochondria evident in the upper myocyte of Fig. 2A, c.
Figure 2.
Oscillations in mitochondrial redox potential in zero-glucose medium. (A, a–d) Confocal images of flavoprotein redox oscillations (lower cell) or a transition from reduced to oxidized (upper cell). Each image was the average of 10 taken during the time segments shown in B (labeled a, b, c, d). A pseudocolor palette graded from light blue (reduced) to red (oxidized) was applied. Note the local oxidation of a mitochondrial cluster at the right end of the upper myocyte in A, c. (B) The time course of mean cell fluorescence change (arbitrary units) during mitochondrial redox oscillation (lower plot corresponds to the lower cell in images shown in A) or a maintained transition of redox (upper plot corresponds to upper cell in A). The decline in fluorescence maxima late in the series is due to photobleaching. Frames were collected ≈6 sec apart.
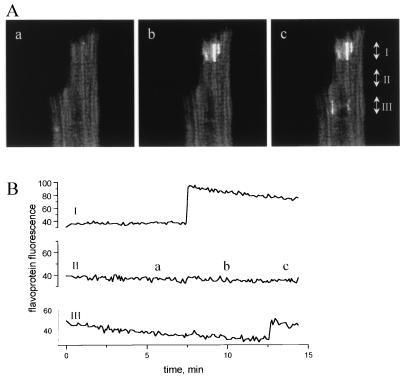
The latter finding, that small clusters of mitochondria could sometimes be oxidized independently, indicates that global control of energy metabolism in heart cells may result from synchronization of organelle-level metabolic functional units. Under some conditions, synchronization may be lost, as is clearly shown in Fig. 3A, where at least three separate clusters of mitochondria became oxidized at different times during the experiment without propagation of the redox transient to the rest of the cell (Fig. 3B). The smallest independent oscillatory or bistable foci observed were 1–2 microns in size—a dimension comparable to that of an individual cardiac mitochondrion (19, 20).
Figure 3.
Focal oxidation of mitochondrial flavoproteins. (A, a–c) The bright regions evident in A, b and A, c indicate highly localized oxidation of independent clusters of mitochondria. Each image is an average of 16 frames collected during the time segments shown in B (labeled a, b, c). (B) The time course of flavoprotein redox change in different subcellular regions. Values are the mean fluorescence intensities across the width of the cell at levels I, II, and III, as denoted on image. Regions I and III displayed oxidation of mitochondrial clusters, whereas the intervening region (II) remained reduced throughout the experiment. Image frames were collected ≈6 sec apart.
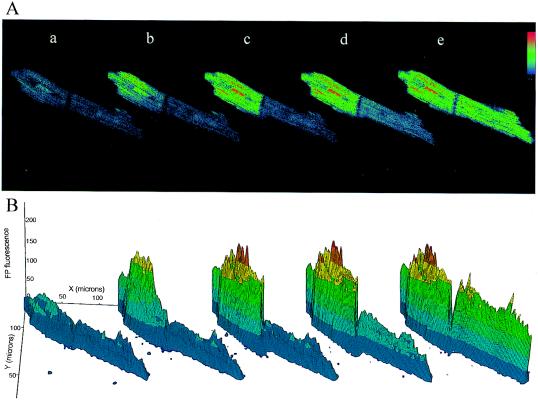
The connection between local and cell-wide redox events is exemplified by the propagated redox wave. In Fig. 4A, mitochondrial oxidation increased first at one end of a myocyte and then propagated to the junction between two cells coupled end to end. Remarkably, the wave was transmitted through the intercalated disc to the second myocyte, presumably through gap junctional channels. This is clearly seen as a redox gradient in the second myocyte in the series of three-dimensional (3D) surface plots (fourth plot of Fig. 4B). The propagation velocity of the redox wave was ≈2 μm/sec, which is several orders of magnitude slower than electrical propagation in cardiac muscle (≈0.1–1 m/sec) (21), but comparable to the average diffusion rate of small molecules in the cytoplasm (for ADP, ≈10 μm/sec) (calculated from data in ref. 22). Examination of multiple oscillations in this cell pair revealed that the site of initiation of redox transients was not the same throughout the experiment; in fact, back propagation from the right-hand cell to the left was also observed later in the sequence (the full sequence can be viewed in movie format at http://www.welch.jhu.edu/~bor/PNAS97.html). During the reduction phase of a given redox oscillation there appeared to be no specific order for fluorescence decline relative to that of the oxidation phase, i.e., the first area to become oxidized was not always the first to become reduced again. Transmission of the redox wave between cells strongly suggests that a biochemical messenger smaller than 1,000 Da molecular mass (the cutoff for gap junction permeation) (23) can communicate metabolic signals between cells.
Figure 4.
Propagated intra- and intercellular mitochondrial redox wave. (A, a–e) A sequential series of confocal images of flavoprotein fluorescence in a pair of cardiomyocytes coupled by an intercalated disc. A wave of oxidation propagated from the end of the first myocyte (A, b) to the cell–cell junction (A, c) and crossed over to the second myocyte (A, d and e). Single image frames were processed with a 3 × 3 median filter, and a pseudocolor palette graded from light blue (reduced) to red (oxidized) was applied. The time interval between images was (in seconds) 8.7 (A, a to b), 8.7 (A, b to c), 13 (A, c to d), 22.9 (A, d to e), 51.1 (A, d to e). (B) Three-dimensional plots of flavoprotein fluorescence intensity. Each image shown in A was sectioned into a 64 × 64 grid, and pixel intensities within each section were averaged and plotted in three dimensions to illustrate redox gradients within and between myocytes in the cell pair.
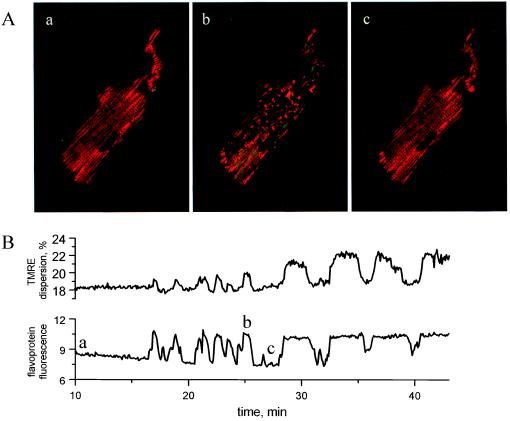
The pronounced subcellular changes in flavoprotein redox potential were indicative of localized and transient deenergization of the mitochondria. We therefore determined whether the redox transients were correlated with the collapse of mitochondrial inner membrane electrical potential by simultaneously measuring flavoprotein redox and TMRE fluorescence. In the reduced phase of redox oscillation (Fig. 5A, a; redox displayed as the green component of the images), the pattern of TMRE fluorescence (red component of images) was evenly distributed among chains of mitochondria spanning the length of the cell, in agreement with the tightly packed arrangement of mitochondria between myofilaments. During oxidation (Fig. 5A, b), however, a rapid redistribution of TMRE was observed, resulting in regional losses of the TMRE signal but retention of TMRE in small clusters of polarized mitochondria. The change in membrane potential determined from the TMRE fluorescence during such a transition was approximately 60 mV, although this value may be underestimated (e.g., because of the limited dynamic range of the detection system, out of focus fluorescence, etc.). When the myocyte subsequently became reduced, the even distribution of TMRE was restored, indicating functional recovery of the mitochondria after the metabolic transient (Fig. 5A, c). Thus, the oxidation phase of mitochondrial redox oscillations was associated with a marked increase in the spatial heterogeneity of mitochondrial membrane polarization. This is evident from oscillations in TMRE dispersion that correlated with redox transitions over the course of the experiment (Fig. 5B).
Figure 5.
Simultaneous imaging of mitochondrial redox and matrix electrical potential during metabolic oscillations. (A, a–c) Two-color confocal images during reduced (A, a and c) and oxidized (A, b) phases of metabolic oscillation. Averages of six frames corresponding to time points labeled a, b, c in B are shown, with the green component of each image indicating flavoprotein redox state and the red component indicating TMRE fluorescence. The marked redistribution of TMRE and spatial heterogeneity of mitochondrial membrane potential evident in A, b returned to the basal distribution (A, a) during a subsequent reduction (A, c). The islands of polarized mitochondria visible in A, b had increased TMRE fluorescence, as a result of TMRE redistributing from depolarized mitochondria to the cytoplasm. (B) Heterogeneity of TMRE fluorescence during mitochondrial oxidation was quantitatively assessed by dispersion analysis (dispersion was calculated as 0.05–0.95 interfractile range from histograms of each TMRE image in the time series). The correlation of TMRE dispersion (upper plot) and the flavoprotein redox state (lower plot) demonstrates the association of redox transients with heterogeneous mitochondrial depolarizations.
Mitochondrial membrane potentials have been shown to be moderately heterogeneous among individual organelles within cells under normal conditions (16, 24). The results obtained with TMRE show that during redox oscillations this intracellular variability can be extreme (more than 60 mV). Because mild metabolic perturbation often led to unsynchronized transitions in mitochondrial redox state (c.f. Fig. 3), it follows that when synchronous cell-wide transitions are observed (Fig. 2), there is a factor that coordinates the function of mitochondria. Coordination could occur through direct physical connections between mitochondria (25) or via a diffusible cytoplasmic messenger. We found evidence for the latter in the novel observation that redox transients can propagate between myocytes, as long as a physical cell–cell junction is present.
With regard to the nature of this messenger, it has been proposed that intracellular Ca2+ regulates mitochondrial function through activation of mitochondrial dehydrogenase activity (26, 27). In addition, Ca2+-induced mitochondrial permeability transitions have been reported in Ca2+-loaded preparations (28). The following evidence argues against Ca2+ as the mediator of oscillations in the present study: (i) no movement of intracellular structures or sarcomere shortening was observed during redox oscillations, (ii) no correlation between resting cytosolic Ca2+ and metabolic oscillations was detected in previous experiments [although suppression of voltage-activated sarcoplasmic reticular Ca2+ release was observed (6)], (iii) redox oscillations were observed in the presence or absence of added intracellular Ca2+ buffers (e.g., 5 mM EGTA), and (iv) application of ruthenium red (an inhibitor of the mitochondrial Ca2+ uniporter) did not alter the pattern of oscillation. Because cyclosporin A had no effect on the metabolic oscillations, the involvement of the permeability transition pore activated by Ca2+ or other triggers is unlikely.
Thus, the present findings leave open the question of what the messenger might be; however, our earlier observation that the photolytic release of intracellular ADP (6) can trigger metabolic oscillations provides at least one candidate for further investigation. ADP, as a coordinating factor, would coincide with the classical view of respiratory control (ref. 29; reviewed in ref. 30) and may explain the observed metabolic transitions. ADP-stimulated respiration, particularly when substrate is limited, can reduce mitochondrial membrane potential and oxidize the matrix. This would be equivalent to a transition from state 4 (ADP-limited) to state 2 (substrate-limited) respiration (31), with a substantial change in membrane potential from fully polarized to depolarized. In addition to ADP, other possible mediators include NADH and protons, which can form complex spatiotemporal patterns of concentration in oscillating glycolytic extracts (32, 33).
The striking spatial and temporal patterns of mitochondrial function presented here portray the considerable complexity of metabolic regulation in intact cardiac cells and illustrate the inadequacy of existing models of metabolic control based on the steady-state behavior of individual pathway components (34). With regard to the dynamic oscillatory behavior of energy metabolism, a wealth of theoretical and experimental data describe how nonlinear reaction kinetics can lead to glycolytic oscillations in tissue extracts and even intact cells (references within refs. 2 and 35). Although this prototypical oscillator provided a simple framework to explain our previous findings, our present data suggest that a more comprehensive model, incorporating mitochondrial metabolism, is required. A dynamic model integrating a glycolytic oscillator with mitochondrial function has been described by Aon et al. (36); however, the present findings underscore the necessity to develop 3D models of the reaction–diffusion type that take into consideration the subcellular organization of metabolism. This is especially important in light of recent evidence for enzymatic channeling (37), enzyme redistribution (38, 39), and compartmentation within cells (40).
The complex regulation required for a rapid and sensitive response to changes in energy supply and demand brings with it the potential for metabolic instability. Our findings indicate that the conditions inducing instability are close to the physiological operating range, because mild perturbation of the system elicits oscillation. This dynamic behavior is particularly important in the heart because metabolic changes are directly coupled to ion-channel activity and perturbations of energy metabolism are common events (e.g., during changes in workload, autonomic activation, or ischemia). By introducing variable regions of electrical inexcitability, spatiotemporal oscillations in energy metabolism, which may occur in intact heart (41) [and have also been described in the brain (42)], would profoundly affect function and set the stage for anomalous electrical behavior. The present findings provide a basis for understanding metabolic control, communication, and synchronization spanning multiple levels—from the mitochondrion, to the myocyte, to the myocardial syncytium.
Acknowledgments
This work was supported by National Institutes of Health Grants R37HL36957 (E.M.) and R01HL54598 (B.O.), and American Heart Association Grant GIA94014990 (B.O. and D.N.R.).
Footnotes
This paper was submitted directly (Track II) to the Proceedings Office.
Abbreviation: TMRE, tetramethylrhodamine ethyl ester.
References
- 1.Prigogine I. Order Out of Chaos: Man’s New Dialogue with Nature. Boulder, CO: Random House; 1984. [Google Scholar]
- 2.Berridge M J, Rapp P E. J Exp Biol. 1979;81:217–279. doi: 10.1242/jeb.81.1.217. [DOI] [PubMed] [Google Scholar]
- 3.Duysens L N M, Amesz J. Biochim Biophys Acta. 1957;24:19–26. doi: 10.1016/0006-3002(57)90141-5. [DOI] [PubMed] [Google Scholar]
- 4.Hommes F A. Arch Biochem Biophys. 1964;108:36–46. doi: 10.1016/0003-9861(64)90352-2. [DOI] [PubMed] [Google Scholar]
- 5.Chance B, Schoener B, Elsaesser S. Proc Natl Acad Sci USA. 1964;52:337–341. doi: 10.1073/pnas.52.2.337. [DOI] [PMC free article] [PubMed] [Google Scholar]
- 6.O’Rourke B, Ramza B M, Marban E. Science. 1994;265:962–966. doi: 10.1126/science.8052856. [DOI] [PubMed] [Google Scholar]
- 7.Eng J, Lynch R M, Balaban R S. Biochem J. 1989;55:621–630. doi: 10.1016/S0006-3495(89)82859-0. [DOI] [PMC free article] [PubMed] [Google Scholar]
- 8.Mitra R, Morad M. Am J Physiol. 1985;249:H1056–H1060. doi: 10.1152/ajpheart.1985.249.5.H1056. [DOI] [PubMed] [Google Scholar]
- 9.Isenberg G, Klockner U. Pflügers Arch Eur J Physiol. 1982;395:6–18. doi: 10.1007/BF00584963. [DOI] [PubMed] [Google Scholar]
- 10.Kunz W S, Kunz W. Biochim Biophys Acta. 1985;841:237–246. doi: 10.1016/0304-4165(85)90064-9. [DOI] [PubMed] [Google Scholar]
- 11.Hassinen I, Chance B. Biochem Biophys Res Commun. 1968;31:895–900. doi: 10.1016/0006-291x(68)90536-6. [DOI] [PubMed] [Google Scholar]
- 12.Kunz W S, Gellerich F N. Biochem Med Metab Biol. 1993;50:103–110. doi: 10.1006/bmmb.1993.1051. [DOI] [PubMed] [Google Scholar]
- 13.Kunz W S. FEBS Lett. 1986;195:92–96. doi: 10.1016/0014-5793(86)80137-5. [DOI] [PubMed] [Google Scholar]
- 14.Chance B, Salkovitz I A, Kovach A G. Am J Physiol. 1972;223:207–218. doi: 10.1152/ajplegacy.1972.223.1.207. [DOI] [PubMed] [Google Scholar]
- 15.Ehrenberg B, Montana V, Wei M D, Wuskell J P, Loew L M. Biophys J. 1988;53:785–794. doi: 10.1016/S0006-3495(88)83158-8. [DOI] [PMC free article] [PubMed] [Google Scholar]
- 16.Loew L M, Tuft R A, Carrington W, Fay F S. Biophys J. 1993;65:2396–2407. doi: 10.1016/S0006-3495(93)81318-3. [DOI] [PMC free article] [PubMed] [Google Scholar]
- 17.Nicholls D G, Ferguson S J. Bioenergetics 2. San Diego: Academic; 1992. [Google Scholar]
- 18.Wan B, Doumen C, Duszynski J, Salama G, LaNoue K F. Am J Physiol. 1993;265:H445–H452. doi: 10.1152/ajpheart.1993.265.2.H445. [DOI] [PubMed] [Google Scholar]
- 19.Dow J W, Harding N G L, Powell T. Cardiovasc Res. 1981;15:483–514. doi: 10.1093/cvr/15.9.483. [DOI] [PubMed] [Google Scholar]
- 20.Segretain D, Rambourg A, Clermont Y. Anat Rec. 1981;200:139–151. doi: 10.1002/ar.1092000204. [DOI] [PubMed] [Google Scholar]
- 21.Wit A L, Janse M J. The Ventricular Arrhythmias of Ischemia and Infarction: Electrophysiological Mechanisms. Mount Kisco, NY: Futura; 1993. [DOI] [PubMed] [Google Scholar]
- 22.Kushmerick M J, Podolsky R J. Science. 1969;166:1297–1298. doi: 10.1126/science.166.3910.1297. [DOI] [PubMed] [Google Scholar]
- 23.Veenstra R D. J Bioenerg Biomembr. 1996;28:327–337. doi: 10.1007/BF02110109. [DOI] [PubMed] [Google Scholar]
- 24.Smiley S T, Reers M, Mottola-Hartshorn C, Lin M, Chen A, Smith T W, Steele G D, Jr, Chen L B. Proc Natl Acad Sci USA. 1991;88:3671–3675. doi: 10.1073/pnas.88.9.3671. [DOI] [PMC free article] [PubMed] [Google Scholar]
- 25.Amchenkova A A, Bakeeva L E, Chentsov Y S, Skulachev V P, Zorov D B. J Cell Biol. 1988;107:481–495. doi: 10.1083/jcb.107.2.481. [DOI] [PMC free article] [PubMed] [Google Scholar]
- 26.Hansford R G. J Bioenerg Biomembr. 1994;26:495–508. doi: 10.1007/BF00762734. [DOI] [PubMed] [Google Scholar]
- 27.Denton R M, McCormack J G. Annu Rev Physiol. 1990;52:451–466. doi: 10.1146/annurev.ph.52.030190.002315. [DOI] [PubMed] [Google Scholar]
- 28.Ichas F, Jouaville L S, Sidash S S, Mazat J P, Holmuhamedov E L. FEBS Lett. 1994;348:211–215. doi: 10.1016/0014-5793(94)00615-6. [DOI] [PubMed] [Google Scholar]
- 29.Chance B, Williams C M. Adv Enzymol. 1956;17:65–134. doi: 10.1002/9780470122624.ch2. [DOI] [PubMed] [Google Scholar]
- 30.Heineman F W, Balaban R S. Annu Rev Physiol. 1990;52:523–542. doi: 10.1146/annurev.ph.52.030190.002515. [DOI] [PubMed] [Google Scholar]
- 31.Chance B, Williams G R. Nature (London) 1955;176:250–254. doi: 10.1038/176250a0. [DOI] [PubMed] [Google Scholar]
- 32.Mair T, Muller S C. J Biol Chem. 1996;271:627–630. doi: 10.1074/jbc.271.2.627. [DOI] [PubMed] [Google Scholar]
- 33.Boiteux A, Hess B, Sel’kov E E. Curr Topics Cell Regul. 1980;17:171–203. doi: 10.1016/b978-0-12-152817-1.50010-9. [DOI] [PubMed] [Google Scholar]
- 34.Kohn M C, Garfinkel D. Ann Biomed Eng. 1983;11:361–531. doi: 10.1007/BF02584214. [DOI] [PubMed] [Google Scholar]
- 35.Goldbeter A. Biochemical Oscillations and Cellular Rhythms. Melbourne: Cambridge Univ. Press; 1996. [Google Scholar]
- 36.Aon M A, Cortassa S, Westerhoff H V, Berden J A, Van Spronsen E, Van Dam K. J Cell Sci. 1991;99:325–334. doi: 10.1242/jcs.99.2.325. [DOI] [PubMed] [Google Scholar]
- 37.Srivastava D K, Bernhard S A. Annu Rev Biophys Biophys Chem. 1987;16:175–204. doi: 10.1146/annurev.bb.16.060187.001135. [DOI] [PubMed] [Google Scholar]
- 38.Hess B, Boiteux A, Chance E M. Mol Biol Biochem Biophys. 1980;32:157–164. doi: 10.1007/978-3-642-81503-4_12. [DOI] [PubMed] [Google Scholar]
- 39.Cortassa S, Aon M A. Cell Biol Int. 1994;18:687–713. doi: 10.1006/cbir.1994.1099. [DOI] [PubMed] [Google Scholar]
- 40.Weiss J N, Lamp S T. Science. 1987;238:67–69. doi: 10.1126/science.2443972. [DOI] [PubMed] [Google Scholar]
- 41.Chance B, Williamson J R, Jamieson D, Schoener B. Biochem Zeitschrift. 1965;341:357–377. [Google Scholar]
- 42.Dora E, Olaffson K, Chance B, Kovach A G. Adv Exp Med Biol. 1976;75:299–305. doi: 10.1007/978-1-4684-3273-2_36. [DOI] [PubMed] [Google Scholar]


