Abstract
Expression of cardiac L-type Ca2+ channels in dysgenic myotubes results in large Ca2+ currents and electrically evoked contractions resulting from Ca2+-entry dependent release of Ca2+ from the sarcoplasmic reticulum. By contrast, expression of either P/Q-type or N-type Ca2+ channels in dysgenic myotubes does not result in electrically evoked contractions despite producing comparably large Ca2+ currents. In this work we examined the possibility that this discrepancy is caused by the preferential distribution of expressed L-type Ca2+ channels in close apposition to sarcoplasmic reticulum Ca2+ release channels. We tagged the N termini of different α1 subunits (classes A, B, C, and S) with a modified green fluorescent protein (GFP) and expressed each of the fusion channels in dysgenic myotubes. Each GFP-tagged α1 subunit exhibited Ca2+ channel activity that was indistinguishable from its wild-type counterpart. In addition, expression of GFP-α1S and GFP-α1C in dysgenic myotubes restored skeletal- and cardiac-type excitation-contraction (EC) coupling, respectively, whereas expression of GFP-α1A and GFP-α1B failed to restore EC coupling of any type. Laser-scanning confocal microscopy revealed a distinct expression pattern for L-type compared with non-L-type channels. After injection of cDNA into a single nucleus, GFP-α1S and GFP-α1C were present in the plasmalemma as small punctate foci along much of the longitudinal extent of the myotube. In contrast, GFP-α1A and GFP-α1B were not concentrated into punctate foci and primarily were found adjacent to the injected nucleus. Thus, L-type channels possess a targeting signal that directs their longitudinal transport and insertion into punctate regions of myotubes that presumably represent functional sites of EC coupling.
Excitation-contraction (EC) coupling of striated muscle (skeletal and cardiac) occurs as a close interplay between the L-type Ca2+ channels or dihydropyridine receptors (DHPRs) of the plasma membrane and the Ca2+ release channels or ryanodine receptors (RyRs) of the sarcoplasmic reticulum (SR) (for review see ref. 1). In cardiac muscle, rapid Ca2+ influx through L-type channels triggers RyRs to open and, thereby, causes a massive release of SR Ca2+ (2). In contrast, in skeletal muscle there is no need for Ca2+ influx (3). Instead, membrane depolarization is thought to induce a conformational change in the DHPR (or voltage sensor) of the plasma membrane (4, 5), which subsequently activates the SR RyR, possibly via a direct protein–protein interaction (6–8). Even though the two mechanisms of EC coupling differ, both require a close physical association between the DHPR and the RyR. Indeed, in both cultured mouse skeletal muscle (9) and chicken myocardial cells (10), DHPRs and RyRs colocalize in clusters that can be detected as punctate foci at the light microscopic level.
Experiments analyzing wild-type and chimeric skeletal and cardiac DHPRs expressed in dysgenic myotubes have helped to elucidate molecular mechanisms of EC coupling. Dysgenic myotubes are prepared from the skeletal muscle of mice homozygous for a frame-shift in the coding region of the α1S subunit of the skeletal DHPR (11). Dysgenic myotubes lack skeletal-type EC coupling (12) and slowly activating L-type Ca2+ currents (13). However, injection of cDNA expression plasmids encoding the skeletal DHPR into the nuclei of dysgenic myotubes restores both slowly activating L-type Ca2+ current and skeletal-type EC coupling (i.e., electrically evoked contractions in the absence of extracellular Ca2+) (14). In contrast, expression of the cardiac DHPR in dysgenic myotubes results in both cardiac-like, rapidly activating Ca2+ currents and cardiac-type EC coupling (evoked contractions requiring extracellular Ca2+) (15).
Surprisingly, in dysgenic myotubes expressing the brain N-type (16) or P/Q-type (17) Ca2+ channels, Ca2+ influx-dependent contractile activity (i.e., cardiac-type EC coupling) is almost never observed even though the Ca2+ current density is comparable to that for the cardiac DHPR. The inability of large, non-L-type Ca2+ currents to trigger SR Ca2+ release might be because of a lack of targeting of the non-L-type Ca2+ channels into clusters at functional sites of EC coupling, namely, the junctions of the SR with either the surface membrane (peripheral couplings) or the transverse (T) tubules (18–20). Accordingly, few (or none) of the non-L-type Ca2+ channels would be positioned close enough to RyRs to trigger SR Ca2+ release.
Thus, the objective of the present work was to compare the subcellular distribution of four different kinds of voltage-gated Ca2+ channels expressed in the dysgenic cell system: the skeletal DHPR (α1S; ref. 21), the cardiac DHPR (α1C; ref. 22), the neuronal P/Q-type Ca2+ channel (α1A; ref. 23), and the neuronal N-type Ca2+ channel (α1B; ref. 16). To visualize the subcellular distribution of the expressed channels, the N terminus of each α1 subunit was fused with the green fluorescent protein (GFP), previously cloned from the pacific jellyfish Aequorea victoria (24). Interestingly, the addition of this relatively large (27 kDa) protein to the Ca2+ channel α1 subunits did not appear to interfere with the physiological properties of any of the four Ca2+ channels. Macroscopic channel properties (activation rate, voltage-dependence, and expression level) and restoration (or lack of restoration) of EC coupling were indistinguishable from their untagged, wild-type counterparts. By using confocal microscopy, we also were able to demonstrate differential subcellular targeting of L-type versus non-L-type Ca2+ channels. Our results indicate that only the L-type channels are efficiently targeted throughout the myotube and cluster in punctate foci, presumably reflecting localization to functional sites of EC coupling.
MATERIALS AND METHODS
Plasmid Construction.
The coding sequences of the α1 subunits of the skeletal muscle DHPR (α1S) (21), cardiac muscle DHPR (α1C) (22), neuronal P/Q-type (α1A) (23), and N-type (α1B) (16) Ca2+ channels were inserted “in-frame” and downstream of the coding region of a modified GFP, cloned in a proprietary mammalian expression vector, kindly provided by P. Seeburg (Center for Molecular Biology, University of Heidelberg, Germany). The HindIII to EcoRI segment of the polylinker of pSP72 (Promega) was inserted directly after the last GFP codon (Lys-238). Transcription was under the control of a cytomegalovirus promoter. To avoid the potential loss of the GFP label because of the known, physiological truncation of the carboxyl terminus of various Ca2+ channel α1 subunits (25–29) we fused the GFP to the N terminus of each α1 subunit. To allow in-frame ligation of the 5′ terminus of the α1 cDNAs, a SalI site was introduced by PCR in-frame directly in front of the initiating ATG. Thus, the first ATG was 24 bp downstream of the final GFP codon. Ligation of the 3′ terminus of the α1 cDNAs into polylinker sites was accomplished either by native or by previously introduced restriction sites (14, 16) downstream of the termination codon: EcoRI (nucleotide 5676) for α1S (14), HpaI (nucleotide 6609) into SmaI for α1C, BamHI (nucleotide 7614) for α1A, and EcoRI (nucleotide 7327) for α1B (16). GFP cDNA was modified by introducing point mutations via PCR mutagenesis (30) to optimize for brightness and spectral properties (mutation S65T) (31), and to suppress thermosensitivity (mutations V163A, I167T, and S175G) (32). Finally, PCR-modified GFP and α1 cDNA stretches were sequenced to confirm sequence integrity.
Expression of cDNA.
Primary cultures of myotubes isolated from newborn dysgenic mice were prepared as described previously (33). Approximately 1 week after plating, myotubes were microinjected (14) into a single nucleus with solutions of expression plasmids (300–400 ng/μl) carrying cDNAs for either GFP, GFP-α1S, GFP-α1C, GFP-α1A, or GFP-α1B. Injected myotubes subsequently were examined for the development of green fluorescence. Expressing cells were evaluated for restoration of contractility, the presence of macroscopic Ca2+ currents, and subcellular channel distribution.
Contractile Recordings.
Fluorescent myotubes were tested for the ability to contract in response to electrical stimulations (10 ms, 80 V) through an extracellular pipette placed near the cell (14). Contractions were recorded in a normal rodent Ringer solution (145 mM NaCl/5 mM KCl/2 mM CaCl2/1 mM MgCl2/10 mM Hepes, pH 7.4 with NaOH) or Ca2+-free rodent Ringer’s (equimolar substitution of Ca2+ by Mg2+). Contractions were videotaped, and the movement of a characteristic surface marker on the contracting cell was analyzed frame by frame (30 frames/s) by using an EVO-9700 Hi8 Desktop Video (SONY, Institute of Applied Video Technology, Hollywood, CA).
Electrophysiological Characterization.
Macroscopic Ca2+ currents were measured by using the whole-cell patch clamp technique (34). Whole-cell patch-clamp pipettes were pulled from borosilicate glass and had resistances of 1.5–1.9 MΩ when filled with an internal solution containing 140 mM cesium-aspartate, 10 mM cesium-EGTA, 5 mM MgCl2, and 10 mM Hepes (pH 7.4 with CsOH). The composition of the external bath solution was 10 mM CaCl2, 145 mM tetraethylammonium-Cl, 3 μM tetrodotoxin, and 10 mM Hepes (pH 7.4 with tetraethylammonium-OH). Test pulses were preceded by a 1-s prepulse to −30 mV to inactivate endogenous T-type Ca2+ currents (35). Test currents were corrected for linear components of leakage and capacitative currents by digitally scaling and subtracting a preceding control current elicited by a hyperpolarizing voltage step (20–40 mV amplitude) applied from the holding potential of −80 mV. Ca2+ current densities (expressed in pA/pF) were normalized by linear cell capacitance. Values are given as mean ± SD. All recordings were performed at room temperature.
Fluorescence Analysis.
Myotubes cultured on 35-mm culture dishes were superfused with a normal rodent Ringer solution (see above) mounted under a glass coverslip and examined by using a Zeiss Axiophot epifluorescence microscope equipped with a HBO 50 mercury lamp and a filter set suitable for the detection of fluorescein. Fluorescent myotubes were visualized by using a Zeiss 40× PlanNeofluar (numerical aperture 0.75) objective and digitized by using a charge-coupled device video camera and a DEI-470 processing unit (Optronics, Galeta, CA). Images were later processed by using the Adobe Photoshop software (ADOBE Systems, Mountain View, CA).
Laser-Scanning Confocal Microscopy.
Myotubes were superfused in a normal rodent Ringer solution and mounted under a glass coverslip as described above. The culture dish subsequently was fastened upside-down on the stage of a Nikon Inverted microscope. Fluorescing cells were analyzed by using a Sarastro 2000 confocal laser-scanning microscope (Molecular Dynamics) with a Nikon 60× PlanApo oil immersion objective (numerical aperture 1.40) and the ImageSpace software (Silicon Graphics, Mountain View, CA). GFP excitation/emission was achieved with a filter set (488 nm/510 nm) designed for fluorescein detection. Image were 1,024 × 1,024 pixels with a pixel size of 0.11 μm. Step size between confocal sections was 2 μm. To enable comparison between different myotubes, all images were recorded at the same adjustments of laser power (17 mW/30% transmission) and photomultiplier sensitivity (750 V) and were processed (Adobe Photoshop software) by using identical values for contrast and brightness.
RESULTS AND DISCUSSION
N-Terminal Tagging of α1 Subunits with Modified GFP.
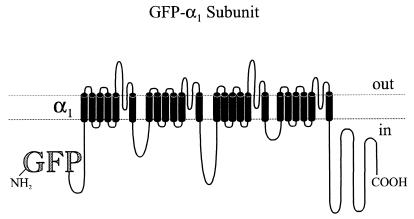
GFP has been used successfully as a protein tag on both the amino- and carboxyl termini of a wide range of cytosolic and membrane-bound proteins (for review see ref. 36) and in some cases physiological differences were reported depending on the terminus carrying the tag (e.g., ref. 37). We tagged the N terminus of the Ca2+ channel α1 subunits (Fig. 1) because of the known physiological truncation of the C termini of several α1 subunits (25–29). N-terminal, in-frame tagging of α1 subunits (skeletal L-type: α1S, cardiac L-type: α1C, P/Q-type: α1A, and N-type: α1B) with a modified GFP and expression in dysgenic myotubes led to fully functionally Ca2+ channels as detailed below. Initial experiments showed that a GFP modified at Ser-65 (S65T, ref. 31) exhibited bright cytosolic fluorescence when expressed alone, but that S65T-GFP fused with the Ca2+ channel α1 subunits exhibited only little fluorescence (data not shown). Lowering the incubation temperature for injected cells from 37°C to 30°C greatly enhanced fluorescence caused by the temperature sensitivity of the development of GFP fluorescence (31, 36, 38). However, the lower incubation temperature resulted in the complete loss of myotube contractile ability (from both normal myotubes and dysgenic myotubes expressing either GFP-α1S or GFP-α1C). Therefore, we introduced additional point mutations into GFP(S65T) to suppress its thermosensitivity (V163A, I167T, S175G; ref. 32) (subsequently referred to as “GFP” for simplicity). Ca2+ channel α1 subunits tagged by the modified GFP generated sufficient fluorescence even when injected cells were incubated at 37°C.
Figure 1.
Schematic representation of GFP-α1 subunit fusion proteins. The N terminus of L-type (α1S and α1C) and non-L-type (α1A and α1B) Ca2+ channel α1 subunits was fused to the C terminus of a modified version of the GFP. in, intracellular; out, extracellular.
Distinct Cellular Distribution of L-Type and Non-L-Type Ca2+ Channels.
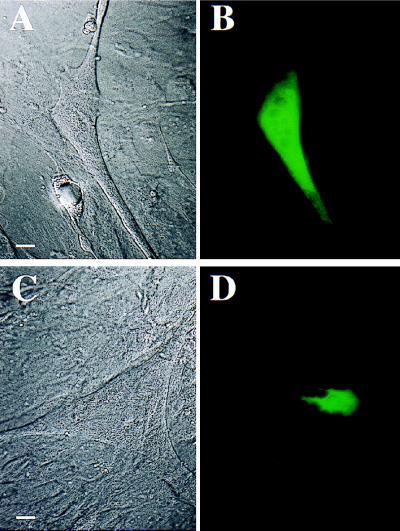
Two to four days after injection of expression plasmids into single nuclei, myotubes were screened with epifluorescence microscopy for the development of green fluorescence. Surprisingly, fluorescence of skeletal and cardiac L-type Ca2+ channels was not restricted to the regions surrounding the injected nucleus. Instead, the fluorescence was distributed throughout a large section of the cell (see GFP-α1C in Fig. 2 A and B). However, the fluorescence associated with expression of the neuronal P/Q-type and N-type channels was strongly concentrated around the injected nucleus (see GFP-α1A in Fig. 2 C and D). The observation of a different distribution of L-type and non-L-type channels in skeletal myotubes points to the possibility that different targeting mechanisms exist for the different Ca2+ channel subtypes. However, it is also possible that the tagging of the Ca2+ channel α1 subunits may have artifactually caused an improper expression of the fusion channel. Thus, we characterized the functional properties (macroscopic currents and EC coupling) of the GFP-α1 subunit fusion proteins.
Figure 2.
Different expression patterns of L-type and non-L-type Ca2+ channels in dysgenic skeletal myotubes. Phase contrast (A and C) and corresponding fluorescence images (B and D) of dysgenic skeletal myotubes 4 days after mononuclear injection of GFP-α1C (A and B) or GFP-α1A (C and D) cDNAs. GFP-α1C (and also GFP-α1S, data not shown) exhibited a widespread distribution of fluorescence (B), whereas GFP-α1A (and also GFP-α1B, data not shown) exhibited a predominantly perinuclear distribution of fluorescence (D). (Scale bar = 10 μm.)
GFP-Tagged Ca2+ Channels Are Functionally Unaltered.
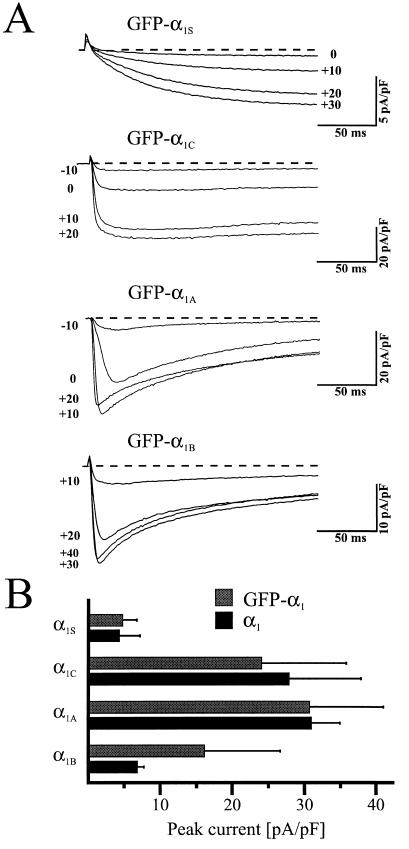
Despite the obvious differences in the fluorescence distribution of the four classes of GFP-tagged Ca2+ channels, each fusion protein resulted in a functional voltage-gated Ca2+ channel on expression in dysgenic myotubes. For example, expression of GFP-α1S in dysgenic myotubes restored slowly activating L-type Ca2+ current that was indistinguishable from its untagged (14) counterpart (Fig. 3A). Similarly, expression of GFP-α1C, GFP-α1A, and GFP-α1B in dysgenic myotubes led to the appearance of rapidly activating Ca2+ currents (Fig. 3A) similar to their respective untagged, wild-type channels (15–17). Whole-cell peak currents (mean ± SD) were 4.8 ± 2.1 pA/pF (n = 14) for GFP-α1S, 23.9 ± 12.5 pA/pF (n = 11) for GFP-α1C, 30.7 ± 11.2 pA/pF (n = 10) for GFP-α1A and 16.1 ± 10.5 pA/pF (n = 11) for GFP-α1B (Fig. 3B). These peak currents are similar to values obtained for the wild-type channels on expression in the same system (15–17). Thus, tagging the N terminus of Ca2+ channel α1 subunits with this relatively large (27 kDa) GFP protein does not interfere with the normal electrophysiological properties of the channel.
Figure 3.
GFP-α1 subunits exhibit typical class-specific macroscopic Ca2+ current properties on expression in dysgenic skeletal myotubes. (A) Representative whole-cell Ca2+ currents attributable to the four GFP-α1 subunit fusion channels. Macroscopic Ca2+ currents were elicited by 200-ms step depolarizations to the indicated potentials (after a prepulse to inactivate T-type currents) from a holding potential of −80 mV. Current amplitudes were normalized by linear cell capacitance. (B) Comparison of peak Ca2+ currents attributable to the four classes of GFP-α1 subunit fusion channels (gray columns) with their corresponding unfused, wild-type counterparts (black columns). Bars represent the mean ± SD of 10–31 recordings, except for untagged α1A (17) and α1B (16), which are the mean ± SEM. Values for the untagged α1 subunits were as published previously: α1S and α1C (15), α1A (17), and α1B (16).
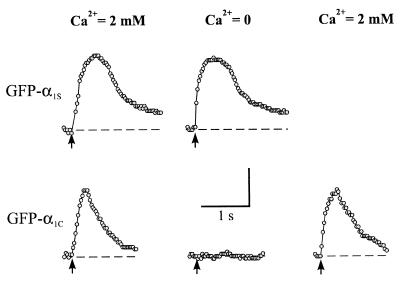
We also investigated the ability (or inability) of the GFP-α1 subunit fusion proteins to activate SR RyRs and, thus, support either skeletal- or cardiac-type EC coupling. As shown in Fig. 4 dysgenic myotubes expressing GFP-α1S (Upper) exhibited strong contractions on extracellular stimulation that were indistinguishable from those of normal myotubes. Moreover, these contractions resulted from a skeletal-type EC coupling mechanism because contractions persisted on removal of extracellular Ca2+. Alternatively, a cardiac-type or Ca2+-induced-Ca2+-release mechanism was found on expression of GFP-α1C in dysgenic myotubes because contraction was abolished on removal of extracellular Ca2+ (Fig. 4, Lower). Identical results have been obtained previously with the untagged, wild-type channels (14, 15). Thus, tagging of the N termini of muscle L-type Ca2+ channels apparently is without effect on the ability of these channels to participate efficiently in functional EC coupling.
Figure 4.
Restoration of electrically evoked contractions in dysgenic skeletal myotubes expressing GFP-α1S and GFP-α1C. Electrically evoked contractions obtained from myotubes expressing GFP-α1S (Upper) and GFP-α1C (Lower) in normal rodent Ringer (2 mM Ca2+, first column) and in Ca2+ free Ringer solution (equimolar substitution of Ca2+ by Mg2+, middle column). Removal of extracellular Ca2+ blocked contractions of GFP-α1C but not of GFP-α1S expressing cells. Recovery of electrically evoked contractions in the GFP-α1C expressing myotube after a return to the normal rodent Ringer solution is shown (Lower, far right). Vertical scale bar: movement distance of 10 μm (GFP-α1S expressing myotube) or 7 μm (GFP-α1C expressing myotube). Arrows indicate the time of application of the electrical stimulus (10 ms, 80 V). Note: In the presence of extracellular Ca2+, contractions were never observed for either GFP-α1A or GFP-α1B expressing myotubes (n > 50 for each construct).
Electrical stimulation was applied to more than 50 myotubes exhibiting intense green fluorescence for each of the neuronal constructs (GFP-α1A and GFP-α1B). None of these myotubes displayed contractile activity, even in the presence of extracellular Ca2+ (data not shown). These results are in agreement with previous observations on the untagged counterparts (16, 17). The inability of the P/Q-type channel (GFP-α1A) to support Ca2+-induced-Ca2+-release is especially striking because this channel produced peak Ca2+ current densities that were statistically indistinguishable from those of the cardiac L-type channel (see Fig. 3B). Comparable GFP-α1A and GFP-α1C current densities should have provided similar total Ca2+ influx, though only that attributable to the cardiac L-type channels was capable of triggering the release of SR Ca2+. Our observation that the P/Q-type and N-type channels were distributed differently than L-type channels (Fig. 2) raised the possibility that the neuronal channels are not directed to the functional sites of EC coupling. To compare the distribution of the different types of Ca2+ channels with higher resolution, we used laser-scanning confocal microscopy.
Only L-Type Ca2+ Channels Cluster in Punctate Foci.
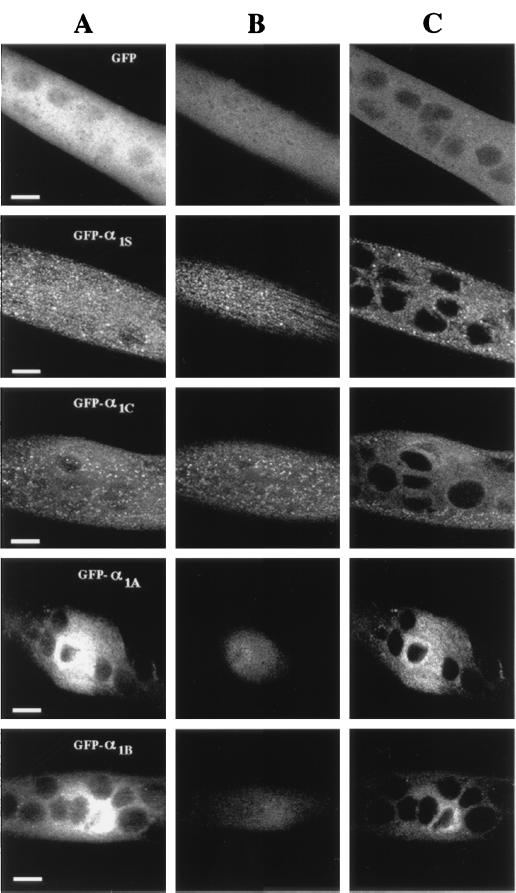
Confocal imaging allows the visualization of fluorescent signals in a restricted plane of focus, thus limiting out-of-focus blur. Moreover, serial optical sections can be reconstructed by computer calculations to produce three-dimensional projections that reveal a much higher resolution compared with normal epifluorescence microscopy. As shown in the calculated projection in Fig. 5A, myotubes expressing GFP alone (Top) looked opaque and densely filled because of the cytosolic localization of free GFP. The topmost section of these control cells exhibits a relatively homogeneous fluorescence (Fig. 5B, Top). Similar results also were found for confocal sections through the midlevel of the cell (Fig. 5C). In contrast, myotubes expressing GFP-α1S (Fig. 5, second row) or GFP-α1C (Fig. 5, third row) exhibited a more inhomogeneous appearance. For both constructs, there were many clusters on or near the surface membrane, as indicated by the topmost optical section (Fig. 5B) and the midlevel optical section (Fig. 5C, note the clusters near the periphery). These clusters near the surface membrane may correspond to sites of peripheral couplings between the SR and surface plasmalemma, which are relatively plentiful early during myogenesis (18, 19). The midlevel section also revealed clusters that appeared to be far from the surface and that may represent nascent junctions between the SR and T-tubules (19). Clustered DHPRs previously have been demonstrated in mouse myotubes by using immunolabeling, which further revealed that the DHPR clusters were colocalized with RyR clusters (9). Thus, it seems likely that clusters of GFP-α1S also were colocalized with RyRs. Because the confocal images reveal a subcellular distribution for GFP-α1C similar to GFP-α1S, it also appears likely that α1C expressed in dysgenic myotubes colocalizes with the endogenous skeletal RyRs, which would seem a prerequisite for the demonstrated ability of α1C to produce cardiac-type EC coupling in dysgenic myotubes.
Figure 5.
GFP-α1S and GFP-α1C channels, but not GFP-α1A and GFP-α1B channels, cluster in a punctate distribution on expression in dysgenic skeletal myotubes. Laser-scanning confocal images of dysgenic myotubes (in vivo) performed 4 days after mononuclear injection of cDNA expression plasmids containing GFP only (top row), GFP-α1S (second row), GFP-α1C (third row), GFP-α1A (fourth row), and GFP-α1B (bottom row). (A) Calculated three-dimensional projection (“maximum intensity”) of 8–10 confocal sections (2-μm distances) of myotubes expressing each of the indicated constructs. (B and C) Topmost confocal section of the cell (B) and of a more central slice (C), 6–8 μm deeper than in B of the same myotube as depicted in A. Identical laser and photomultiplier adjustments were used for all images. (Scale bar = 10 μm.)
Myotubes expressing GFP-α1A and GFP-α1B exhibited an entirely different spatial pattern (Fig. 5, fourth and bottom rows). The non-L-type channel fluorescence spread only a very limited distance away from the injected nucleus and was concentrated perinuclearly, which is especially evident in the midlevel sections (Fig. 5C, fourth and bottom rows). The topmost section (Fig. 5B, fourth and bottom rows) revealed only diffuse staining, which may indicate that the neuronal channels are incorporated diffusely into the plasma membrane only near the injected nucleus. Alternatively, it may be that the surface density of the brain channels was too low to be detected by fluorescence and that the signal from the topmost section represents out-of-focus fluorescence from deeper within the cell. However, some channels must have been present in the plasmalemma to account for the large Ca2+ currents supported by the GFP-α1A and GFP-α1B constructs (Fig. 3).
An argument that the surface density of the brain channels is indeed low compared with L-type channels is provided by the measurements of Adams et al. (17). They found that although current densities were similar in myotubes expressing α1A and α1C, the amount of maximal intramembrane charge movement (Qmax) was much lower for α1A than α1C. Because Qmax provides an indirect measurement of the number of channels in the plasmalemma, they postulated that the P/Q-type channels are present in the plasmalemma at a much lower density than the cardiac L-type channels, but that the P/Q-type channels have a much higher open probability. Our results support a much lower surface density for the P/Q-type channels than for L-type channels: even if all the apparently, surface-associated signal of α1A (and α1B) represented channels in the plasmalemma, this fluorescence was still clearly much less than the surface-associated fluorescence in myotubes expressing α1S or α1C.
If it is true that the GFP-tagged α1A and α1B subunits are present in the plasmalemma at only a very low density, they may have been undetectable by fluorescence measurements. Nonetheless, it is clear that the neuronal channels did not form high-density clusters like the muscle L-type channels. Thus, Ca2+ entry through α1A and α1B channels would be expected to couple very inefficiently to SR Ca2+ release because most or all of the SR RyRs would be far away from the nearest α1A or α1B channels. In contrast, comparable amounts of Ca2+ ions entering through cardiac L-type channels located in close proximity to SR Ca2+ release sites (i.e., in punctate clusters at peripheral couplings and SR/T-tubule junctions) throughout much of the myotubes’ extension would ensure a very efficient triggering of SR Ca2+ release.
Taken together, our data unequivocally demonstrate that N-terminal labeling of different classes of voltage-gated Ca2+ channels yields fully functional Ca2+ channels on expression in dysgenic myotubes. Thus, GFP tagging of Ca2+ channels should provide an extremely valuable tool in studying Ca2+ channel physiology and ultrastructure. Moreover, our results provide evidence for the importance of two essential factors required for efficient EC coupling in cultured myotubes: (i) an abundant, widespread distribution of Ca2+ channels along the myotube plasma membrane and (ii) a punctate distribution of plasmalemmal Ca2+ channels, presumably reflecting their close association with SR RyRs. The ability of transport and insertion of Ca2+ channels throughout the cell and the targeting of channels to functional sites of EC coupling appear to be features unique to the muscle L-type Ca2+ channels. Thus, it should be possible to identify regions of the L-type channels essential for their transport, targeting, and clustering through the use of GFP-tagged L-type/non-L-type chimeras.
Acknowledgments
We thank Kimberly Lopez-Jones for providing excellent dysgenic myotube cultures and Dr. P. Seeburg for the gift of an earlier version of the GFP expression vector. This work was supported by a Schrödinger scholarship from the Fonds zur Förderung der Wissenschaftlichen Forschung, Austria (J01242-GEN) to M.G. and by National Institutes of Health Grant NS 24444 to K.G.B.
ABBREVIATIONS
- SR
sarcoplasmic reticulum
- GFP
green fluorescent protein
- EC
excitation-contraction
- DHPR
dihydropyridine receptor
- RyR
ryanodine receptor
References
- 1.Flucher B E, Franzini-Armstrong C. Proc Natl Acad Sci USA. 1996;93:8101–8106. doi: 10.1073/pnas.93.15.8101. [DOI] [PMC free article] [PubMed] [Google Scholar]
- 2.Nabauer M, Callewaert G, Cleemann L, Morad M. Science. 1989;244:800–803. doi: 10.1126/science.2543067. [DOI] [PubMed] [Google Scholar]
- 3.Armstrong C M, Bezanilla F M, Horowicz P. Biochim Biophys Acta. 1972;267:605–608. doi: 10.1016/0005-2728(72)90194-6. [DOI] [PubMed] [Google Scholar]
- 4.Schneider M F, Chandler W K. Nature (London) 1973;242:244–246. doi: 10.1038/242244a0. [DOI] [PubMed] [Google Scholar]
- 5.Rios E, Brum G. Nature (London) 1987;325:717–720. doi: 10.1038/325717a0. [DOI] [PubMed] [Google Scholar]
- 6.Lu X, Xu L, Meissner G. J Biol Chem. 1994;269:6511–6516. [PubMed] [Google Scholar]
- 7.Lu X, Xu L, Meissner G. J Biol Chem. 1995;270:18459–18464. doi: 10.1074/jbc.270.31.18459. [DOI] [PubMed] [Google Scholar]
- 8.El-Hayek R, Antoniu B, Wang J, Hamilton S L, Ikemoto N. J Biol Chem. 1995;270:22116–22118. doi: 10.1074/jbc.270.38.22116. [DOI] [PubMed] [Google Scholar]
- 9.Flucher B E, Andrews S B, Fleischer S, Marks A R, Caswell A, Powell J A. J Cell Biol. 1993;123:1161–1174. doi: 10.1083/jcb.123.5.1161. [DOI] [PMC free article] [PubMed] [Google Scholar]
- 10.Sun X H, Protasi F, Takahashi M, Takeshima H, Ferguson D G, Franzini-Armstrong C. J Cell Biol. 1995;129:659–671. doi: 10.1083/jcb.129.3.659. [DOI] [PMC free article] [PubMed] [Google Scholar]
- 11.Chaudhari N. J Biol Chem. 1992;267:25636–25639. [PubMed] [Google Scholar]
- 12.Powell J A, Fambrough D M. J Cell Physiol. 1973;82:21–38. doi: 10.1002/jcp.1040820104. [DOI] [PubMed] [Google Scholar]
- 13.Beam K G, Knudson C M, Powell J A. Nature (London) 1986;320:168–170. doi: 10.1038/320168a0. [DOI] [PubMed] [Google Scholar]
- 14.Tanabe T, Beam K G, Powell J A, Numa S. Nature (London) 1988;336:134–139. doi: 10.1038/336134a0. [DOI] [PubMed] [Google Scholar]
- 15.Tanabe T, Mikami A, Numa S, Beam K G. Nature (London) 1990;344:451–453. doi: 10.1038/344451a0. [DOI] [PubMed] [Google Scholar]
- 16.Fujita Y, Mynlieff M, Dirksen R T, Kim M S, Niidome T, et al. Neuron. 1993;10:585–598. doi: 10.1016/0896-6273(93)90162-k. [DOI] [PubMed] [Google Scholar]
- 17.Adams B A, Mori Y, Kim M S, Tanabe T, Beam K G. J Gen Physiol. 1994;104:985–996. doi: 10.1085/jgp.104.5.985. [DOI] [PMC free article] [PubMed] [Google Scholar]
- 18.Courbin P, Koenig J, Ressouches A, Beam K G, Powell J A. Neuron. 1989;2:1341–1350. doi: 10.1016/0896-6273(89)90072-x. [DOI] [PubMed] [Google Scholar]
- 19.Franzini-Armstrong C, Pinçon-Raymond M, Rieger F. Dev Biol. 1991;146:364–376. doi: 10.1016/0012-1606(91)90238-x. [DOI] [PubMed] [Google Scholar]
- 20.Franzini-Armstrong C, Jorgensen A O. Annu Rev Physiol. 1994;56:509–534. doi: 10.1146/annurev.ph.56.030194.002453. [DOI] [PubMed] [Google Scholar]
- 21.Tanabe T, Takeshima H, Mikami A, Flockerzi V, Takahashi H, Kangawa K, Kojima M, Matsuo H, Hirose T, Numa S. Nature (London) 1987;328:313–318. doi: 10.1038/328313a0. [DOI] [PubMed] [Google Scholar]
- 22.Mikami A, Imoto K, Tanabe T, Niidome T, Mori Y, Takeshima H, Narumiya S, Numa S. Nature (London) 1989;340:230–233. doi: 10.1038/340230a0. [DOI] [PubMed] [Google Scholar]
- 23.Mori Y, Friedrich T, Kim M-S, Mikami A, Nakai J, et al. Nature (London) 1991;350:398–402. doi: 10.1038/350398a0. [DOI] [PubMed] [Google Scholar]
- 24.Prasher D C, Eckenrode V K, Ward W W, Prendergast F G, Cormier M J. Gene. 1992;111:229–233. doi: 10.1016/0378-1119(92)90691-h. [DOI] [PubMed] [Google Scholar]
- 25.De Jongh K S, Merrick D K, Catterall W A. Proc Natl Acad Sci USA. 1989;86:8585–8589. doi: 10.1073/pnas.86.21.8585. [DOI] [PMC free article] [PubMed] [Google Scholar]
- 26.Lai Y, Seagar M J, Takahashi M, Catterall W A. J Biol Chem. 1990;265:20839–20848. [PubMed] [Google Scholar]
- 27.De Jongh K S, Warner C, Colvin A A, Catterall W A. Proc Natl Acad Sci USA. 1991;88:10778–10782. doi: 10.1073/pnas.88.23.10778. [DOI] [PMC free article] [PubMed] [Google Scholar]
- 28.Hell J W, Westenbroek R E, Elliott E M, Catterall W A. Ann NY Acad Sci. 1994;747:282–293. [PubMed] [Google Scholar]
- 29.Hell J W, Appleyard S M, Yokoyama C T, Warner C, Catterall W A. J Biol Chem. 1994;269:7390–7396. [PubMed] [Google Scholar]
- 30.Horton R M, Hunt H D, Ho S N, Pullen J K, Pease L R. Gene. 1989;77:61–68. doi: 10.1016/0378-1119(89)90359-4. [DOI] [PubMed] [Google Scholar]
- 31.Heim R, Cubitt A B, Tsien R Y. Nature (London) 1995;37:663–664. doi: 10.1038/373663b0. [DOI] [PubMed] [Google Scholar]
- 32.Siemering K R, Golbik R, Sever R, Haseloff J. Curr Biol. 1996;6:1653–1663. doi: 10.1016/s0960-9822(02)70789-6. [DOI] [PubMed] [Google Scholar]
- 33.Adams B A, Beam K G. J Gen Physiol. 1989;94:429–444. doi: 10.1085/jgp.94.3.429. [DOI] [PMC free article] [PubMed] [Google Scholar]
- 34.Hamill O P, Marty A, Neher E, Sakmann B, Sigworth F J. Pflügers Arch. 1981;391:85–100. doi: 10.1007/BF00656997. [DOI] [PubMed] [Google Scholar]
- 35.Adams B A, Tanabe T, Mikami A, Numa S, Beam K G. Nature (London) 1990;346:569–572. doi: 10.1038/346569a0. [DOI] [PubMed] [Google Scholar]
- 36.Cubitt A B, Heim R, Adams S R, Boyd A E, Gross L A, Tsien R Y. Trends Biochem Sci. 1995;20:448–455. doi: 10.1016/s0968-0004(00)89099-4. [DOI] [PubMed] [Google Scholar]
- 37.Dobson S P, Livingstone C, Gould G W, Tavare J M. FEBS Lett. 1996;393:179–184. doi: 10.1016/0014-5793(96)00879-4. [DOI] [PubMed] [Google Scholar]
- 38.Ogawa H, Inouye S, Tsuji F I, Yasuda K, Umesono K. Proc Natl Acad Sci USA. 1995;92:11899–11903. doi: 10.1073/pnas.92.25.11899. [DOI] [PMC free article] [PubMed] [Google Scholar]


